
You have a dashboard that is not working and three ways to spend money on it: redesign the screens, rebuild the system underneath, or hire someone to do both.
Choosing well means seeing what good looks like in your industry, at your data volume.
Dashboard design changes shape depending on what it has to survive. These 21 interfaces all run in production, sorted by industry, with the strongest evidence leading each section and every reported figure attributed.
Dashboard Design: Key Findings
- MIT researchers found the brain can identify an image seen for as little as 13 milliseconds, far below the 100 milliseconds previously assumed. A colored status token gets read in a glance; a number has to be parsed.
- Gartner projected in August 2025 that 40% of enterprise applications would carry task-specific AI agents by the end of 2026, up from less than 5% in 2025. In fact, four dashboards below already ship one.
- Designli cut Freightmate's fleet-map load time from roughly 33 seconds to eight in a single sprint, about 70%, by fixing inefficient queries.
What Is Dashboard Design, and What Makes One Effective?
Dashboard design organizes metrics, trends, and operational data into a view that helps users understand what is happening and decide what to do next.
1. Designing Around Business Goals Gives Every Metric a Purpose
As Mara Linares, Marketing Manager at Designli, explains:
“Start with the outcome the user needs to achieve and the decisions the dashboard should help them make.”
She recommends two connected dashboards:
- Execution dashboards for track activities, deliverables, owners, and progress.
- Business outcomes dashboards track measures such as acquisition, activation, paying customers, and revenue.
Connecting these views helps teams investigate whether completed work contributes to growth.
2. Showing Where Numbers Come from Builds Trust in the Dashboard
Identify the sources behind each metric and make its calculation traceable. Leave room to address tracking gaps as the product evolves.
As Linares notes, “A visual redesign cannot compensate for missing measurements, unreliable source data, or inefficient data retrieval.”
When customers regularly check performance or investigate exceptions, consider placing reporting within that workflow, with relevant filters, supporting records, and clear next actions.
3. Clear Hierarchy and Responsive Design Help Users Act Faster
- Lead the summary. Give key metrics prominence and provide access to supporting details, following Microsoft’s dashboard guidance.
- Choose charts for the question. Use lines for trends and bars for comparisons. Datawrapper’s 2025 guidance explains why bars make small differences easier to distinguish than pie slices.
- Keep interactions responsive.Google reports that 90% of the time on a page is spent after it loads, based on Chrome usage data. Test filters and detail views, acknowledge actions promptly, and show when results are loaded.
Best Dashboard Designs for Logistics and Fleet Operations
Logistics dashboards carry the hardest version of the problem: hundreds of moving objects, data arriving from several sources at different intervals, and an operator who has to spot the exceptions from the fleet.
Get the hierarchy wrong here, and the cost lands in a missed pickup or a load that spoils in transit.
- Freightmate by Designli
- Samsara by Samsara's In-house Design Team
- Motive by Motive's In-house Design Team
1. Freightmate by Designli
Standout Features:
- One color per trailer
- Three GPS sources merged
- One-click trip detail
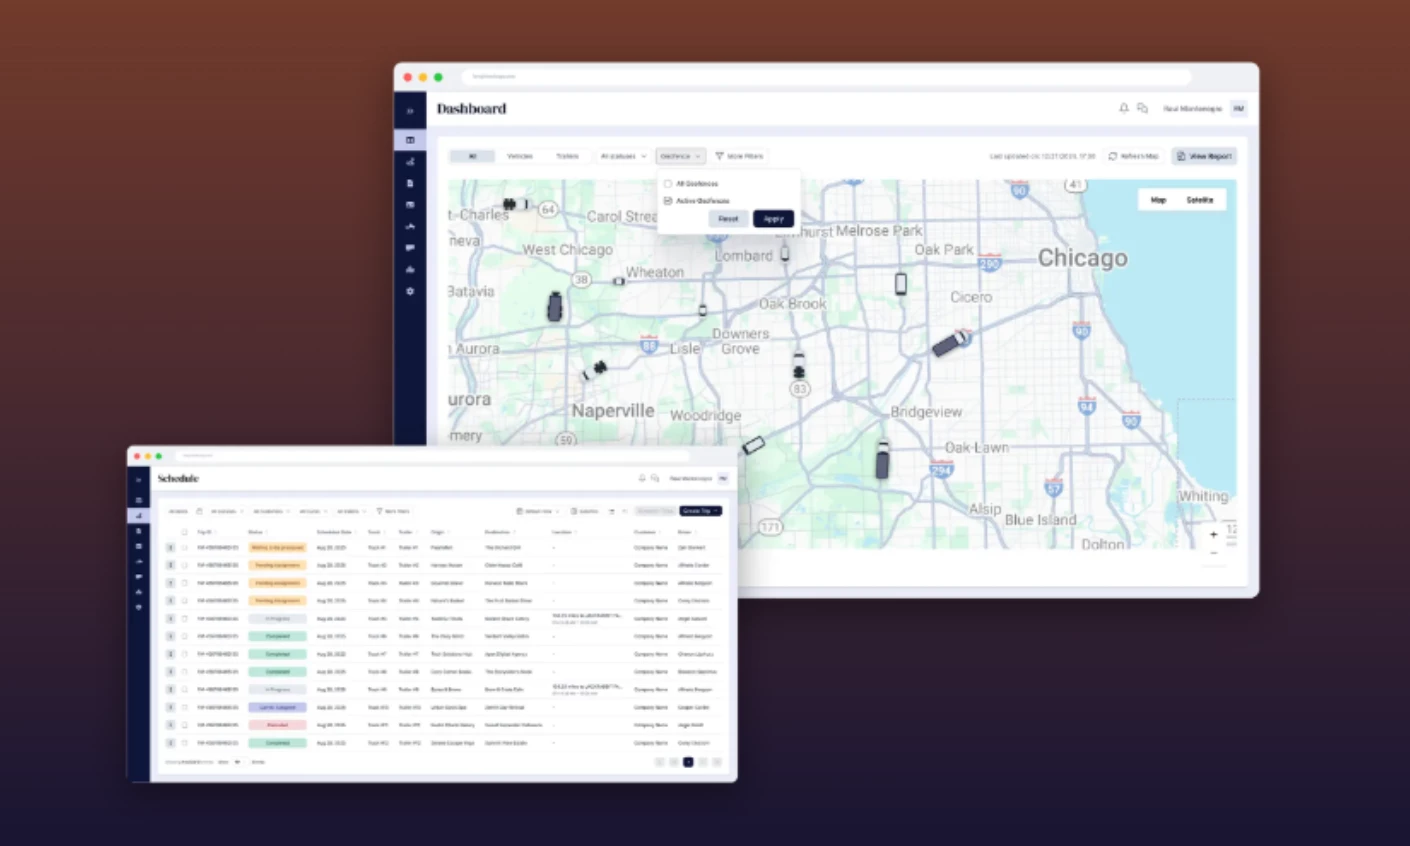
Freight mate is a transportation management platform for owner-operators and fleet owners, covering dispatch, load tracking, invoicing, and documents. Its founder approached Designli with customers already using the product, seeking faster development and a more consultative partner.
Discovery established where the product was falling short. Linares explains:
“During the initial discovery work, the team identified slow dashboard maps, notification gaps, and reporting that did not fully meet the operation’s needs.”
Designli replaced an off-the-shelf BI tool with reporting built around those requirements. The fleet view brought together three tracking sources, with filters, trip details, and geofence of SMS alerts.
As Keith Shields, CEO of Designli, explains, “operators should never have to think about the sources.”
Query optimization reduced map loading from roughly 33 seconds to eight in the first sprint.
Shields also highlights the point when “the number itself stops moving but the user still feels like they’re waiting.” Rendering the map structure before every pin resolve can make progress visible.
To support future development, Designli standardized interface components before refreshing the screens.
Shields explains why: “every new screen either copies an old inconsistency or invents a new one.”
Why it works: Designli connected the interface changes to specific operational problems, improving reporting access and map performance together.
Designli's work is also DesignRush-recognized. Its Cabin Time app was DesignRush's App Design pick in the Best of Design Awards 2025.
See more of the team's work on Designli's agency profile.
2. Samsara by Samsara In-house Design Team
Standout Features:
- Paired map and list
- Prioritized safety inbox
- Role-scoped permissions
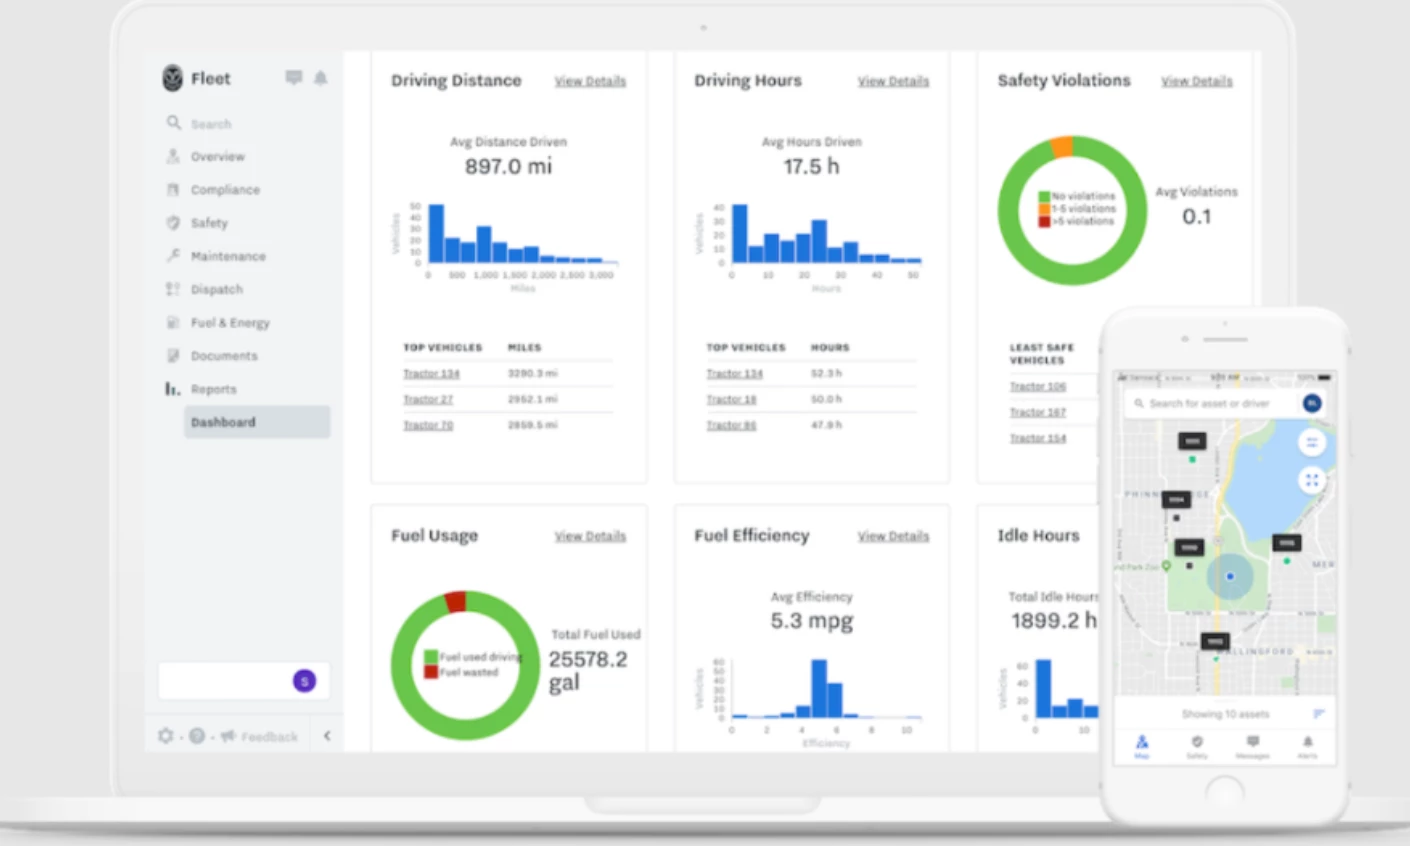
Fleet teams can monitor vehicles, drivers, equipment, and sites from a single cloud dashboard in the Samsara fleet platform.
The design has to accommodate thousands of assets while helping dispatch, safety, maintenance, and compliance teams find the information they need. The fleet view, for example, places an interactive map beside a trip list so dispatchers can check vehicle locations and scan trips on the same screen.
The Safety Inbox sorts automatically detected events into a prioritized queue. Managers can review an incident and add a coaching note in the same workflow. Driver Safety Scores combine harsh driving events, speeding, and AI-detected behaviors into a single score per driver, making it easier to compare performance over a selected period.
Role-based permissions give dispatchers, managers, and administrators access to the tools they need. A dispatcher can focus on today’s routes, while a safety manager can access incident and coaching records.
Why it works: The prioritized inbox helps fleet managers see which incidents need attention first. Keeping footage review and coaching notes in one workflow reduces the time they spend finding clips and documenting follow-up.
Potential limitation: Reviewers on Capterra report that moving between dashboards, the safety inbox, coaching, and driver profiles is not intuitive, and that key features can be hard to find. The exception-first pattern works, and the seams between the four surfaces are where it strains.
3. Motive by Motive's In-house Design Team
Standout Features:
- Permission-shaped navigation
- Score plus leaderboard
- Evidence beside the event
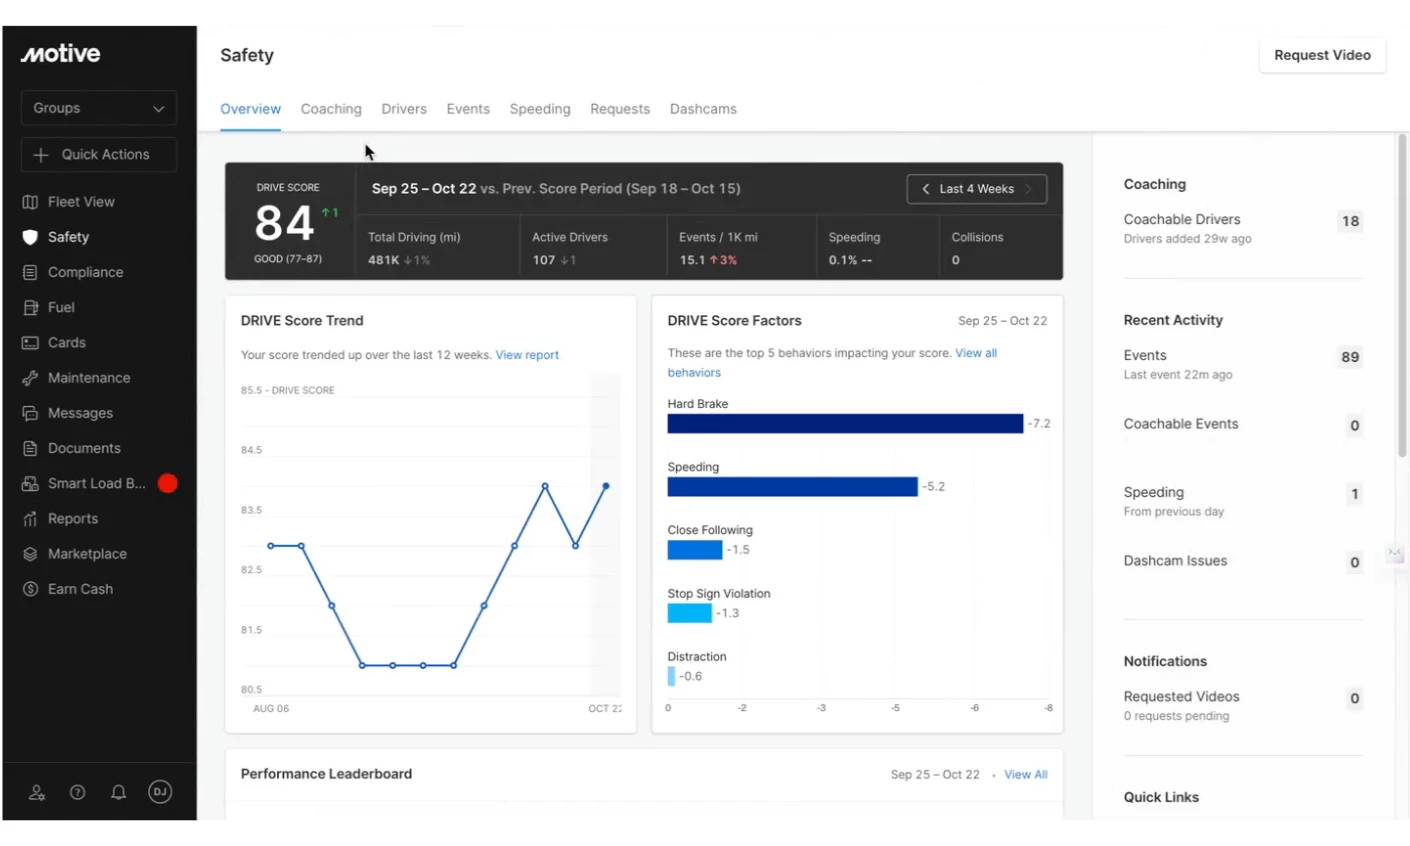
Motive's Fleet View covers the same ground as Samsara and organizes it around a different idea. Instead of scoping permissions inside a shared interface, the left-hand navigation only renders the areas a user's account can reach.
Two managers at the same company may see different options depending on their permissions. That keeps the menu relevant to each person’s work, though it can make troubleshooting harder when a colleague sees a different layout.
The Safety Hub shows the fleet or group Safety Score alongside trends, recent events, the driving behaviors that most affect the score, and a driver leaderboard. Managers can use this overview to decide which drivers need attention before opening any footage.
A separate DRIVE risk score summarizes each driver’s risk over a rolling two-week period. Managers can switch between groups to review safety performance by depot, team, or vehicle group.
On mobile, an interactive map sits beside a searchable list of drivers, vehicles, and assets.
Why it works: Trip history and dashcam footage sit side by side in the coaching view. Managers can review a flagged event, add context, and mark it as coached without switching tabs.
Potential limitation: Reviewers on Capterra report that some settings and reports are hard to locate at first. They also note occasional lag between the driver app and the dashboard.
Best Dashboard Designs for Analytics and SaaS
For analytics dashboards, the design goal shifts from simply presenting a static answer to making the next question effortless to ask.
The following examples demonstrate how to build interfaces that guide open-ended exploration without overwhelming the user.
- PostHog by PostHog's In-house Design Team
- Tableau by Tableau's In-house Design Team
- Google Analytics 4 by Google's In-house Design Team
4. PostHog by PostHog's In-house Design Team
Standout Features:
- Tile-level filter overrides
- Markdown section headings
- AI change summary
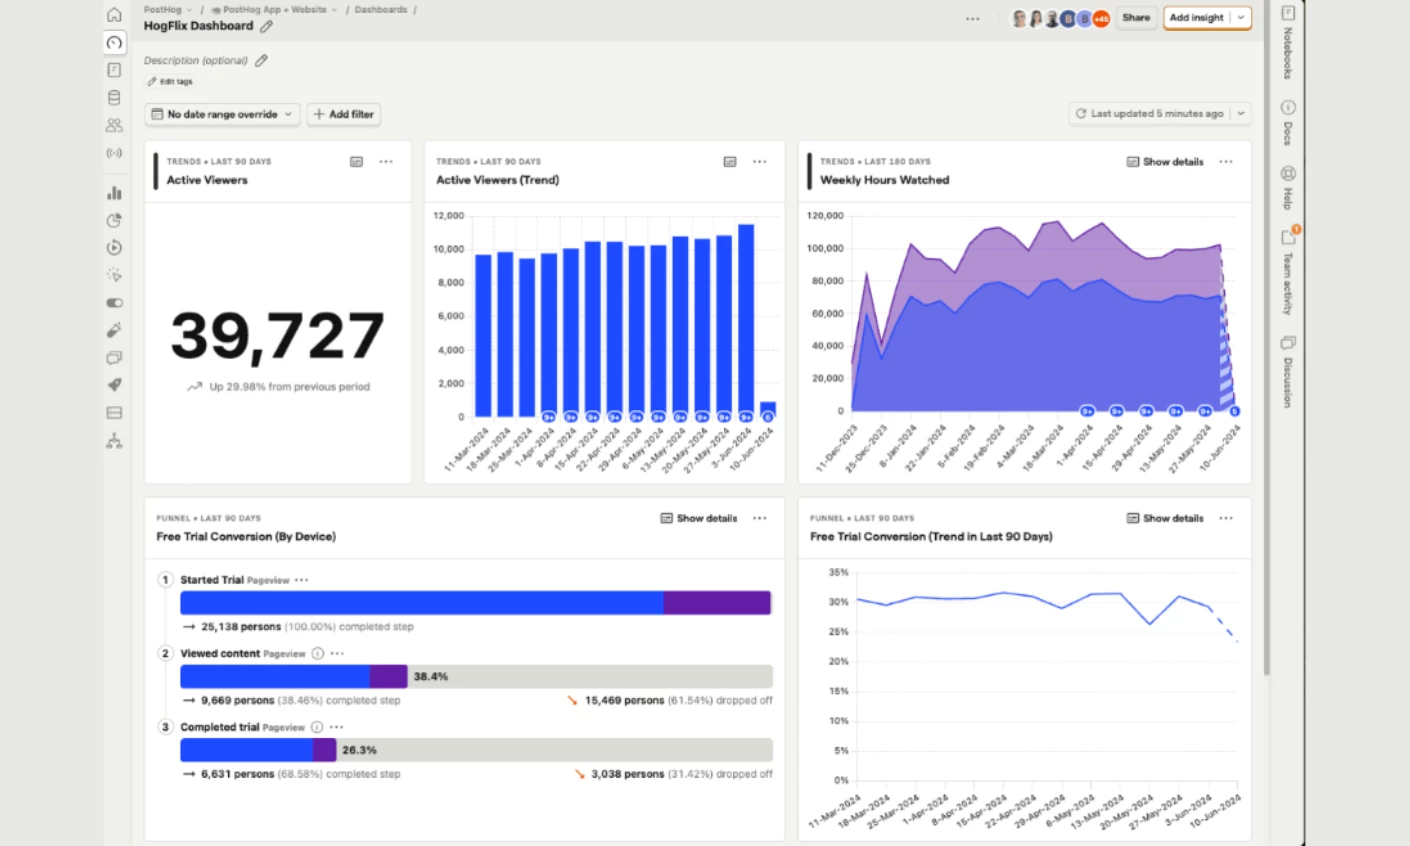
PostHog's dashboard docs group saved insights into dashboards so teams can track key metrics over time. Notebooks give them a place to explore one-off questions.
Teams can set a date range, filter by property, or choose a breakdown for the whole dashboard. They can also adjust filters on individual tiles. For example, a tile can show a quarterly trend while the rest of the dashboard stays on a weekly view. When tile and dashboard filters apply together, the data must meet both sets of conditions.
Markdown tiles add headings, dividers, and notes between charts. On narrow screens, the tiles stack in a single column in the same order as on desktop.
Clicking the sparkle icon captures the current values and refreshes each insight. PostHog’s AI then compares the previous and updated values and summarizes changes such as spikes, drops, and trend reversals.
Why it works: Using plain-text Markdown sections prevents dashboards from becoming confusing data graveyards. When cross-functional teams can understand a dashboard without asking a data scientist to interpret it, the software becomes an enterprise-wide system of record.



5. Tableau by Tableau's In-house Design Team
Standout Features:
- Chart guidance built into the tool
- Per-device layouts from one dashboard
- Native CRM embedding through the Salesforce ecosystem
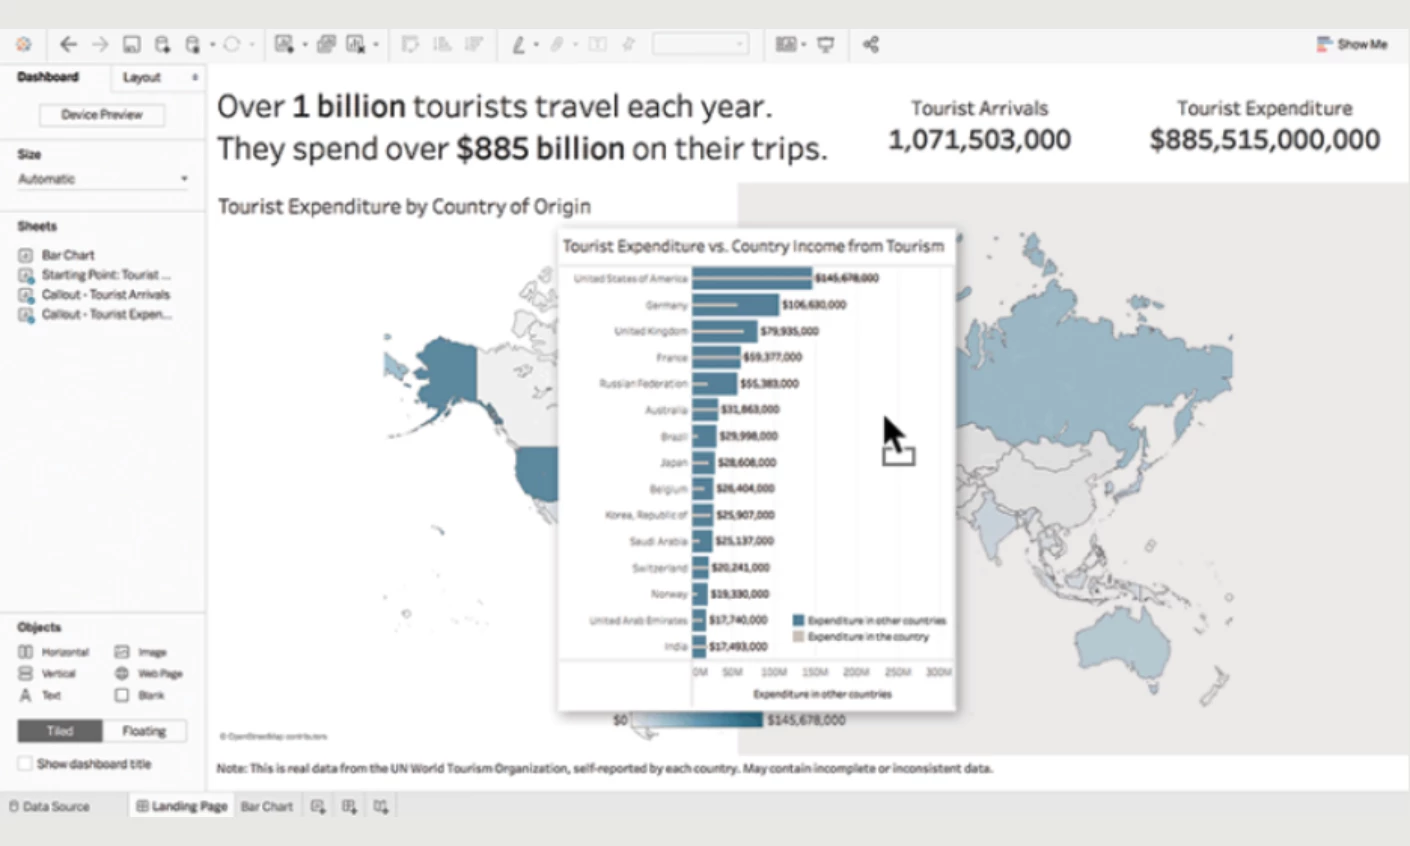
Tableau serves as the main visual analytics platform within the Salesforce network. Instead of forcing you to write complex queries, the software provides a blank canvas where you can pull raw data fields to generate interactive charts. This approach helps everyday business users build dashboards without needing a computer science degree.
The interface maps information directly to specific visual elements, like color or size. You can simply drag a sales figure onto the screen, and the platform handles the rendering. Recent updates also introduced conversational features like Tableau Pulse. You can ask a question in plain English to receive custom metric summaries directly in your daily workflow.
Since Salesforce owns the company, the software connects smoothly with tools like Sales Cloud. You can embed these visualizations directly into your existing setup to put real-time pipeline forecasts right where your team already works.
Why it works: The platform blends a highly accessible interface with massive processing power. You get simple visual building blocks to handle the heavy datasets. This setup helps you evaluate information quickly without crossing a steep technical barrier.
Potential limitation: The sheer volume of customization options can easily overwhelm a beginner. While basic views come together quickly, mastering the deeper software features requires significant time and training.
6. Google Analytics 4 by Google's In-house Design Team
Standout Features:
- Home that learns your habits
- Three snapshot templates
- Reports and Explore split
Google Analytics 4 is one of the most widely used analytics interfaces, which makes its design decisions worth reading even when they misfire. Two of them stand out.
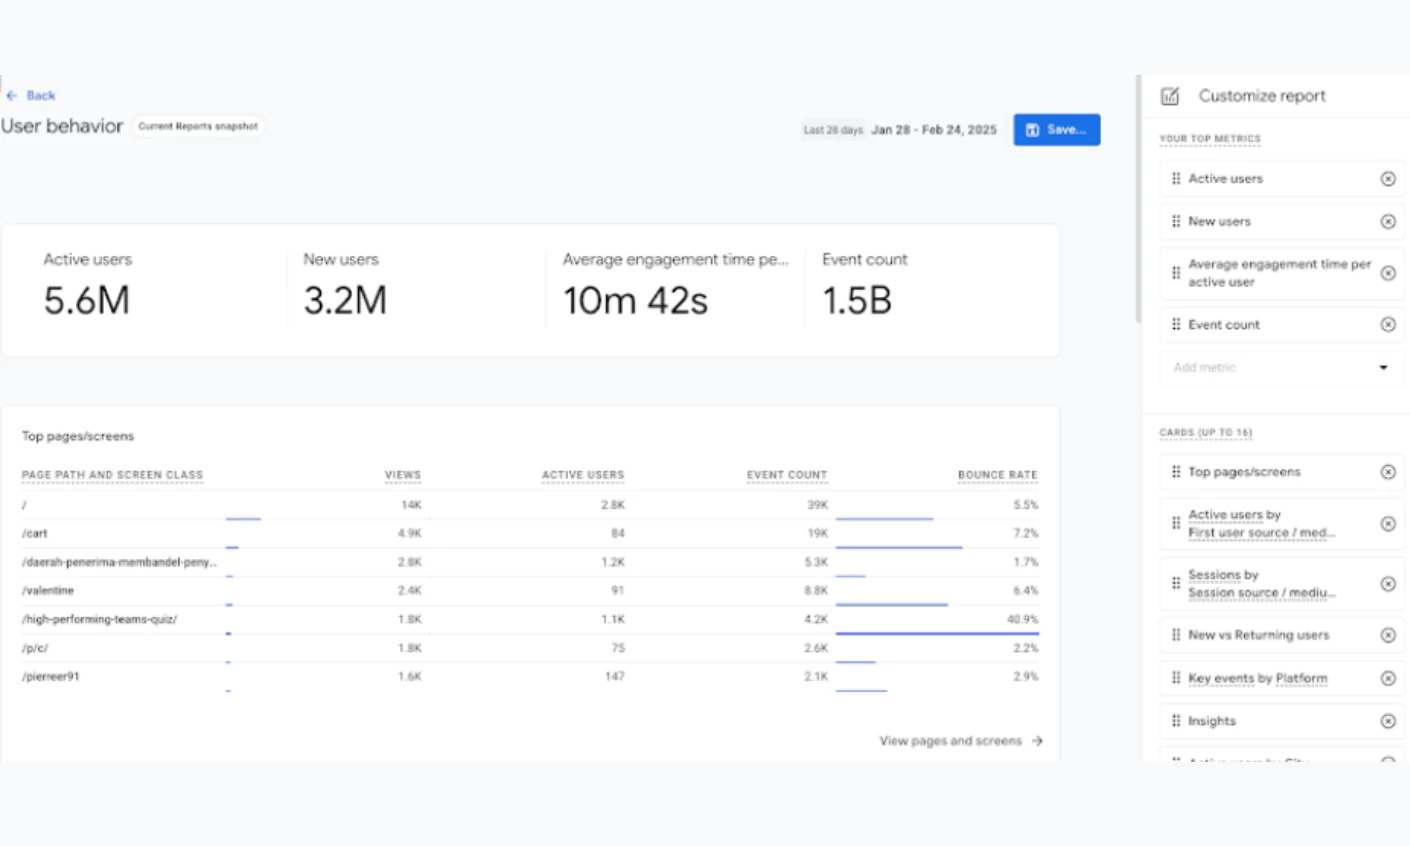
The page shows users, new users, average engagement time, and revenue. A Realtime card shows activity from the past 30 minutes across up to five countries, and an Insights card flags anomalies and emerging trends.
The Recently viewed and Because you view frequently sections bring reports back into view based on what each person opens. That gives users quick access to the reports they use most without having to set up their home page. Google Analytics 4 Home documentation
The Reports snapshot starts with a reporting goal. Choose one of three templates, User behavior, Sales and revenue, or Marketing performance, then add, remove, edit, or rearrange cards.
Each snapshot can hold up to 16 cards. Choosing a template first helps teams decide which metrics belong in the report.
Why it works: Offering templates tied to specific business objectives (rather than a blank canvas) lowers the barrier to activation. It converts reporting from a specialist bottleneck into a self-serve feature, ensuring marketers get immediate value from the platform before they lose interest.
Potential limitation: The split between Reports and Explore is where most users lose their footing. Reports covers preconfigured collections and topics, while anything beyond them requires an exploration built from a Variables panel of dimensions, metrics, and segments. The boundary is a technical most marketers are not equipped to handle.
Best Dashboard Designs for Finance and Fintech
Financial dashboards carry a duty the others do not: the interface has to demonstrate that the number is trustworthy rather than merely display it. Every design decision below is downstream of that, from the register the interface adopts to what it refuses to put in a queue.
7. ENBD X by UXDA for Emirates NBD
Standout Features:
- One 360-degree portfolio view
- Pending items surfaced
- In-app document signing
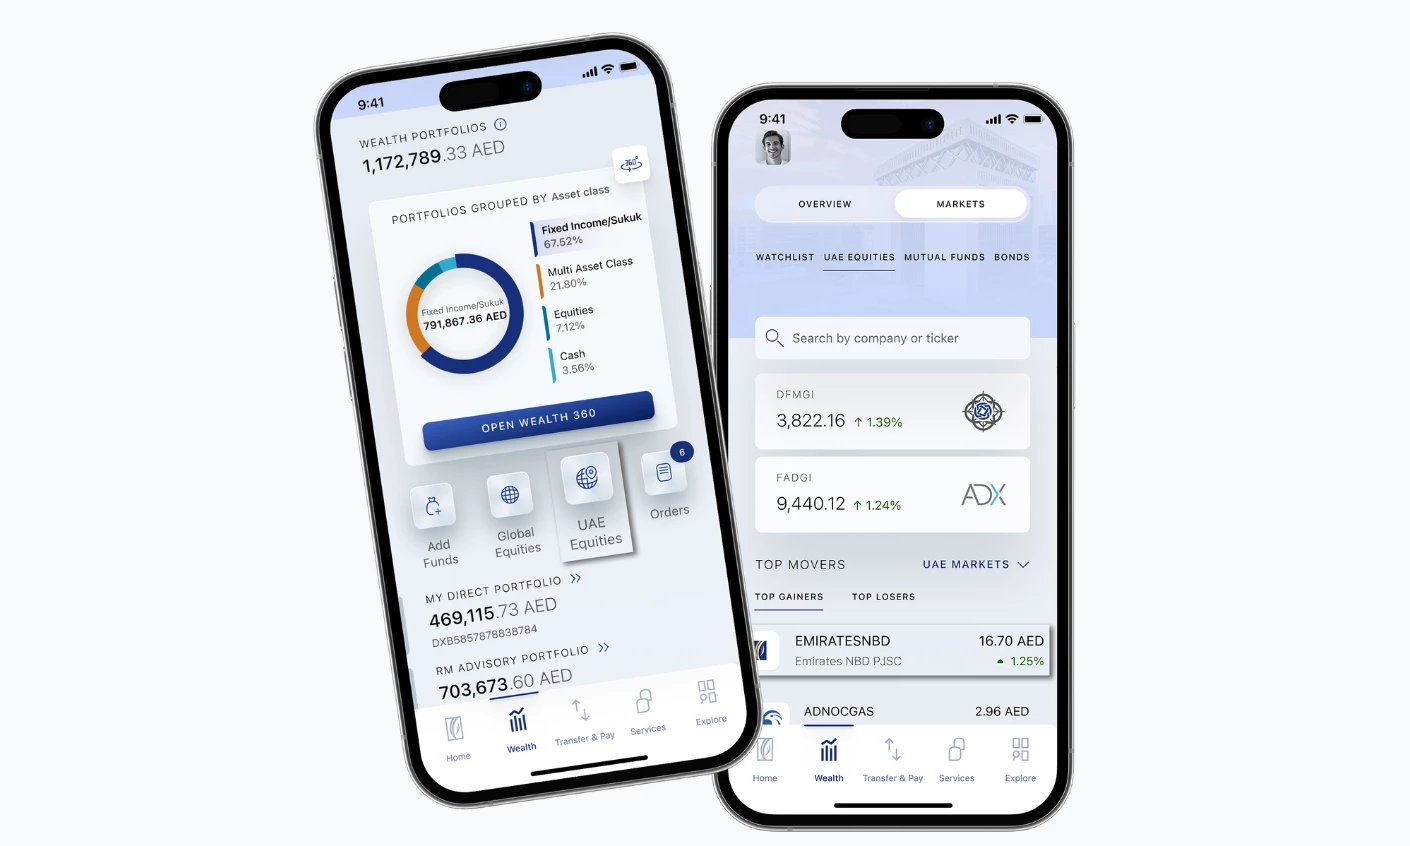
ENBD X is Emirates NBD's rebuilt mobile banking app, designed with financial UX agency UXDA and rolled out to all of the bank's customers after a first version shipped in six months. Its organizing idea is a global dashboard giving a 360-degree view of the customer's entire financial portfolio, with critical updates like upcoming payments and the status of pending requests sitting alongside the balances rather than behind a notifications icon.
That decision matters more than it sounds. Most banking apps separate what you have from what's about to happen, which forces the customer to assemble the actual answer themselves.
Putting pending items on the same surface as balances means the screen answers "where do I stand" rather than "what's my balance," and the two are different questions.
The app carries over 150 services, most processed instantly, and embeds a wealth platform into everyday banking instead of splitting it into a second app: instant investment account opening, more than 11,000 securities and ETFs across 21 markets, personal watchlists, and IPO subscriptions.
Secure Sign closes the loop by letting customers view, update, and sign investment documents in-app regardless of the trade's complexity, which removes the branch visit that would otherwise interrupt every serious transaction. Card controls follow the same logic, with lock and unlock, PIN reset, and spending and withdrawal limits set directly.
Emirates NBD reports around 50% more activity than the previous app, measured in logins and transactions. That's a bank-reported engagement figure rather than a revenue one, and no baseline or measurement window is published.
Why it works: Consolidating everyday banking and wealth management into a single surface removes the exact moment a user would typically switch to a competitor's specialized app. By keeping the user in one ecosystem, the bank dramatically increases cross-selling opportunities and overall platform engagement.
8. Kraster Wallet by Flatonica
Standout Features:
- Dark high-contrast field
- 3D brand objects
- Mobile-first cold storage
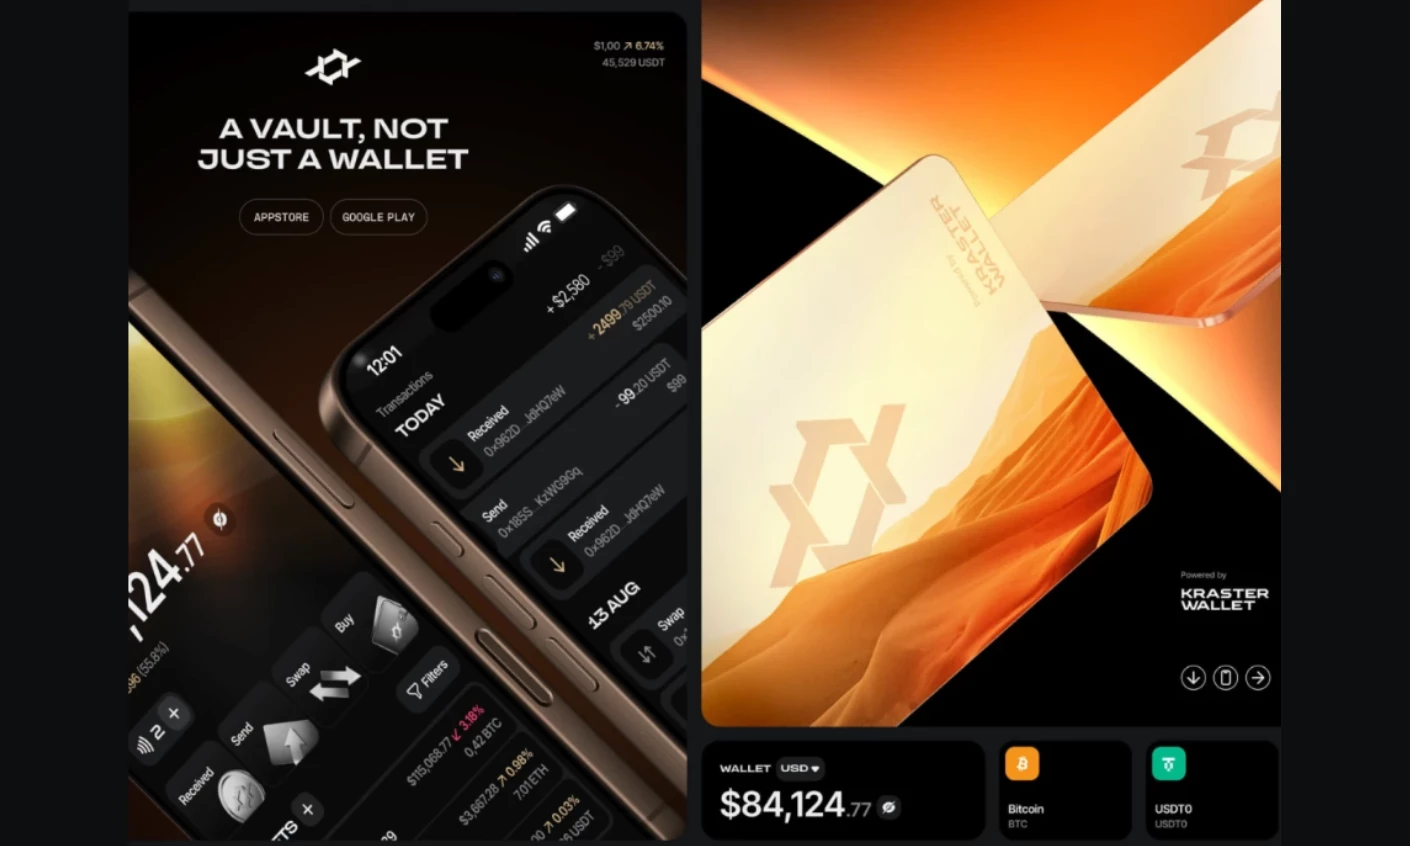
Kraster Wallet is a cold-storage crypto wallet, and it won Best Banking & Finance App Design in the DesignRush Best of Design Awards 2025. The design problem is that cold storage is a security product where the interface has to signal seriousness before it explains anything.
DesignRush's jurors credited the pairing of a dark, high-contrast interface with refined 3D branding for communicating security and technical precision at a glance, and noted that the mobile-first flows make advanced cold storage feel controlled without softening what the product actually does.
The lesson carries past crypto: in any product where the user is being asked to trust a number, the visual register is part of the argument.
Why it works: In a category where the product's entire value is custody of something irreplaceable, the visual register does the same job a security certification does. Restraint reads as competence, and competence is what converts.
Browse more best UI app designs.
9. Ramp by Ramp's In-house Design Team
Standout Features
- Actionable-only inbox
- Policy agent triage
- Card-level limits
Ramp's review workflow sits inside a finance platform covering corporate cards, expense management, accounts payable, and procurement, and its best design decision is a subtraction.
The Inbox tab holds every approval a reviewer owes, across reimbursements, transactions, bills, and spend requests, with a count of items needing attention, and Ramp explicitly recommends working from it rather than from the full transaction list.
What the inbox leaves out is the interesting part. Transactions with missing receipts, transactions with policy exemptions, and pending charges that haven't cleared are deliberately excluded, since none of them can be decided yet.
An item enters the queue only once every required field is satisfied and the charge has settled, and everything else waits under the transactions view. The count on the tab means something exact, the number of decisions actually available, rather than the number of things technically outstanding.
The AI layer follows the same principle. Ramp's policy agent reviews the full transaction set, approves what's compliant, and forwards only exceptions with a reference to the policy clause and an audit trail, so the human sees the disputed cases rather than the whole ledger.
Spend requests arrive with a traffic-signal recommendation attached. Limits are set per card rather than through parent budgets, which matches how a subscription or one-off purchase is actually authorized.
Why it works: A queue that only contains actionable items is the cheapest way to build user trust. When finance teams learn the inbox count is 100% accurate and decidable, they stop second-guessing the software, saving immense amounts of time and deeply embedding the tool into daily operations.
Healthcare and Wellness Dashboard Examples
Health dashboards face a tension the other categories avoid: the data is frequently ambiguous, so the design cannot be vague. The consumer products below do this by compressing complex metrics into simple scores and mapping raw data onto a chronological timeline.
- eat.che by Pocolo
- Oura by Oura's In-house Design Team
- Withings Health Mate by Withings' In-house Design Team
10. eat.che by Pocolo
Standout Features
- Restrained palette
- Consistent cross-device modules
- AI tracking made habitual
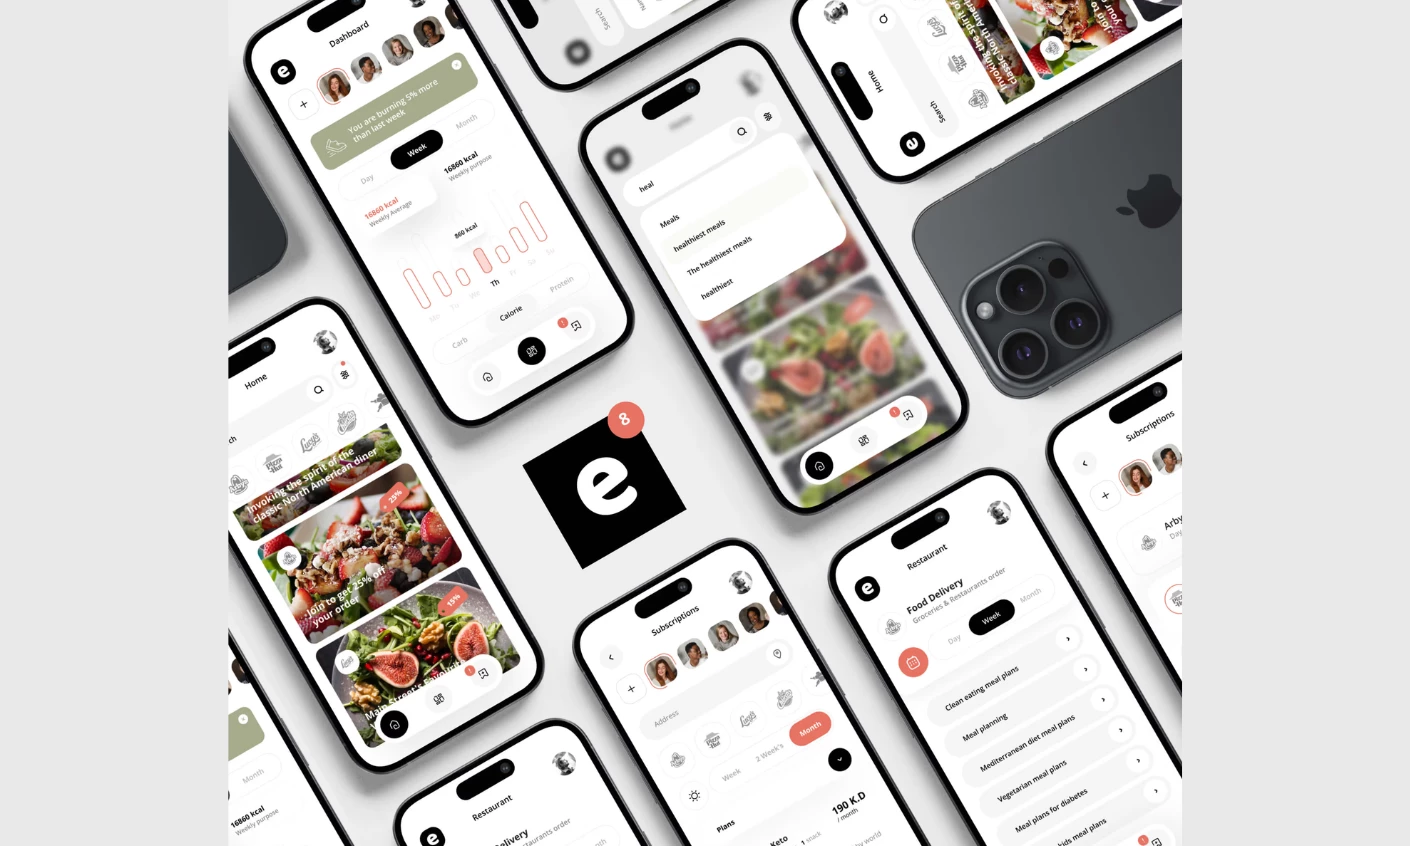
eat.che is an AI-assisted nutrition tracker and took Best Food & Beverage App Design in the DesignRush Best of Design Awards 2025. Nutrition data is dense and repetitive, which is why most tracking apps render it as a spreadsheet and lose their users in week two.
DesignRush's jurors highlighted the reduction of complex nutrition data into a clean, minimalist interface that stays calm and immediately usable. They credited the restrained palette and the consistent design across devices for turning tracking into a habit rather than a chore. Consistency across devices is the operative decision, since the same module in the same place on phone and desktop is what makes a daily interaction survive.
Why it works: A nutrition tracker only earns its subscription fee if the user survives past the initial two-week drop-off. By maintaining absolute layout consistency across mobile and desktop, the app turns tracking into an automatic muscle memory, directly increasing user retention and lifetime value (LTV).
Read more about this dashboard design in our full eat.che app design analysis.
11. Oura by Oura's In-house Design Team
Standout Features:
- Three scores, seven contributors each
- Three tabs by time horizon
- Crown threshold marker
Oura's app redesign organizes an entire health platform around three numbers. Readiness, Sleep, and Activity each run 0 to 100 and each decomposes into seven contributors, also scored 0 to 100, so the headline is always one tap from its own explanation.
Readiness contributors include resting heart rate, HRV balance, body temperature, recovery index, and activity balance, which means a low score arrives with a cause attached rather than as a verdict.
Thresholds are marked rather than left to interpretation. Scores of 85 or higher earn a crown icon beside the number, and anything under 70 is framed as a signal to prioritize rest. Encoding the boundary in the interface removes the question every scored dashboard provokes, which is whether this number is good.
The 2024 redesign is the decision worth copying. Five tabs, Home, Readiness, Sleep, Activity, and Resilience, collapsed into three: Today, Vitals, and My Health, split by time horizon rather than by metric. Laura Furman, Staff Product Manager at Oura, described the problem as one of accumulation.
Members have had to sift through multiple data points, she said, to reach the ones that mattered. Today carries what to do now, Vitals the current detailed picture, and My Health the long-term trend.
Why it works: Reorganizing tabs by time horizon (Today, Vitals, My Health) rather than by data type perfectly matches user intent. It turns the app into a daily advisor, the exact pivot required to maintain a recurring consumer subscription.
12. Withings Health Mate by Withings' In-house Design Team
Standout Features:
- Chronological default screen
- Live link for clinicians
- Household profiles
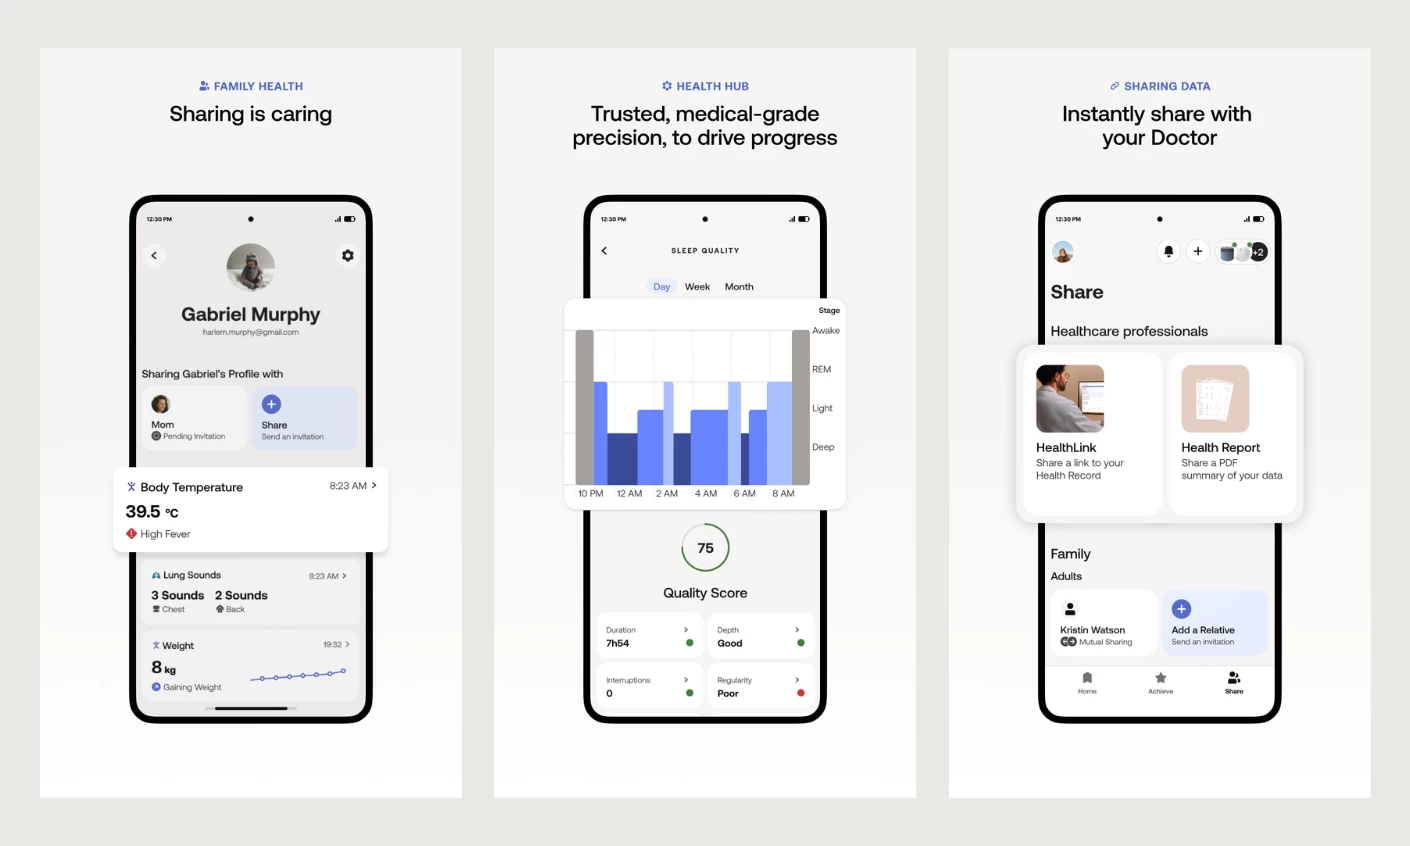
Withings Health Mate takes the opposite structural approach to Oura, and the comparison is the most useful thing about it. Its default screen is a Timeline organized chronologically, combining the latest measurements, activity, and sleep with coaching insights and badges.
Where Oura consolidates many inputs into a few scores, Withings preserves the sequence of events, which suits a product spanning scales, blood pressure monitors, thermometers, sleep mats, and watches.
Both approaches are defensible, and they serve different users. A score answers "how am I doing" for someone with one device and a daily routine. A timeline answers "what happened and when" for someone assembling a picture from several instruments, including measurements taken deliberately rather than passively.
Withings adds a Health Improvement Score on a 1 to 100 scale for subscribers, plus a weekly breakdown of strengths and weaknesses, which layers the score model on top of the timeline rather than replacing it.
The clinical handoff is the feature no consumer dashboard in this list matches. Withings generates a secure shareable report or a live link to the health dashboard, so a clinician gets immediate access to current metrics without an export. Multiple household profiles share data between members.
The app also carries a plain disclaimer that it's intended for informational purposes and isn't a substitute for professional medical advice, a design element in itself, since a clinical-grade appearance creates an obligation to state the limit of what the numbers mean.
Why it works: By keeping raw measurements legible and providing a secure live link, Withings converts a consumer dashboard into a clinical referral document. This allows them to market the hardware to both end-users and medical professionals.
Project Management Dashboard Examples
Project management dashboards all aim to answer one question: is the work on track? You can find the answer through vocabulary, templates, or color, which can all carry different meanings. These platforms show why you should pick your design philosophy before you pick your tool.
- Linear by Linear's In-house Design Team
- Asana by Asana's In-house Design Team
- monday.com by monday.com's In-house Design Team
13. Linear by Linear's In-house Design Team
Standout Features:
- Fixed measure vocabulary
- Click a slice, act on issues
- Hideable global filters
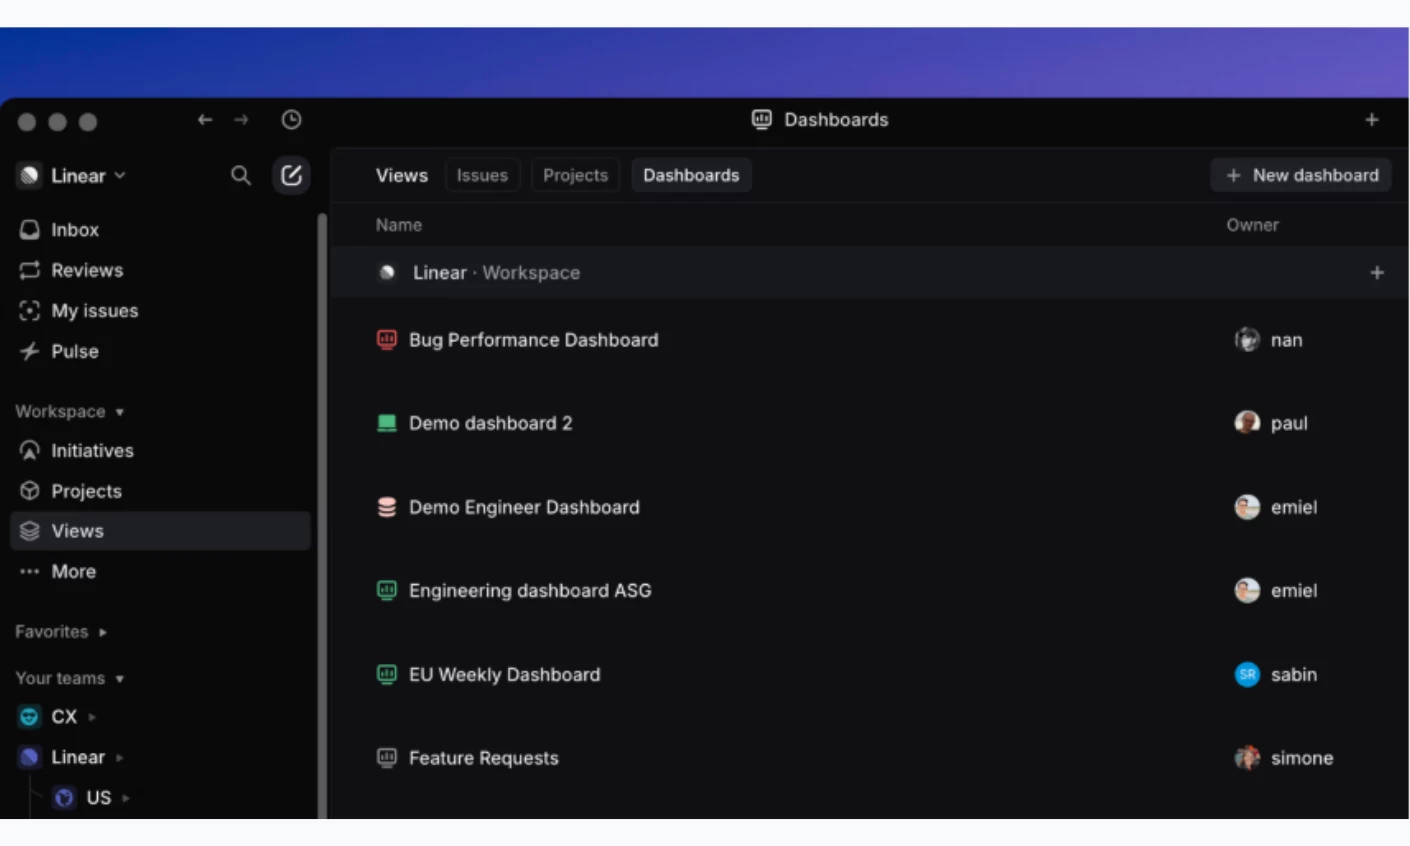
Linear's dashboard documentation restricts what a dashboard can measure, and the restriction is the design. Insights offers six measures, issue count, effort, cycle time, triage time, lead time, and issue age, with no formula builder anywhere. Every team in the workspace therefore means the same thing by cycle time, which is the problem configurable analytics creates and rarely solves.
Dashboards assemble those insights as charts, metric blocks, and tables. Global filters apply across the board and can be hidden while still working, and insights pulled from an existing View inherit them, so the same chart legitimately looks different in two places. The docs say so plainly rather than leaving it as a surprise.
Every element is a doorway. Clicking a slice, a metric, or a percentile marker opens the underlying issues, where work can be assigned, re-statused, or triaged without leaving the page.
Graphs mark the 25th, 50th, 75th, and 95th percentiles on hover, so the distribution stays visible rather than averaged away. Commure, a healthcare technology company supporting more than 400,000 clinicians, uses Linear dashboards daily for triage, SLA performance, and postmortem follow-through.
Why it works: By rigidly locking down the vocabulary of performance metrics, Linear forces cross-functional alignment, pitching the tool to executives as a source of absolute truth rather than just another issue tracker.
Potential limitation: Insights requires the Business plan, whereas Dashboards requires the Enterprise plan. The restraint above is unavailable at the tiers where small teams start, which is exactly where a shared definition of cycle time is cheapest to establish.
14. Asana by Asana's In-house Design Team
Standout Features:
- Three reporting scopes
- Chart templates for non-analysts
- Numeric roll-ups
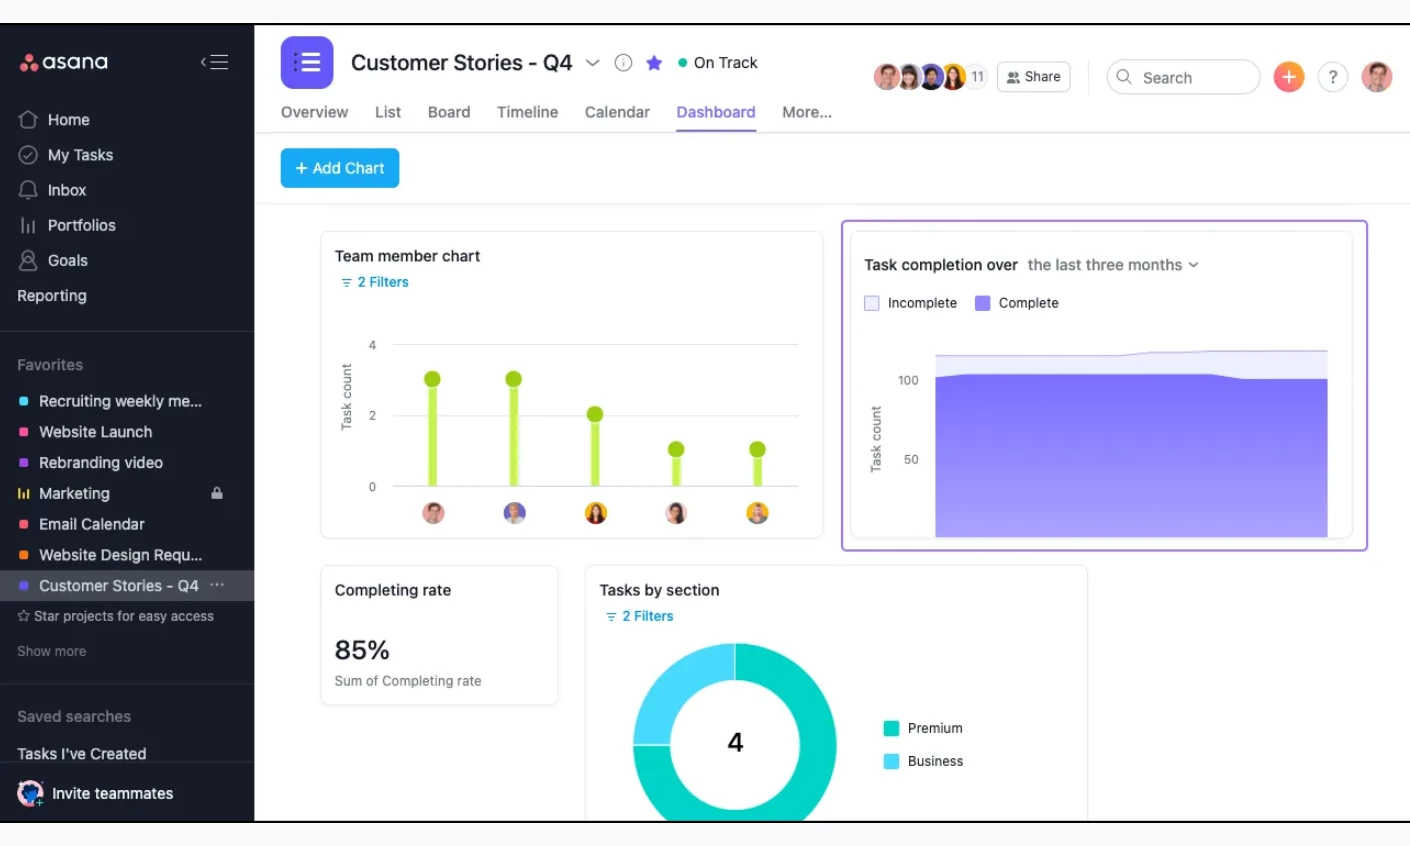
Asana's reporting dashboards take the configurable path Linear declines, and it works because the scopes are named clearly. Project dashboards cover one project, portfolio dashboards roll up a group, and Universal Reporting builds charts across many projects, portfolios, or the whole workspace: pick a source, filter it, choose a chart type, and pin the result to a shareable dashboard.
Chart types run to column, line, burn-up, donut, number, and lollipop, with numeric roll-ups summing custom fields such as budgets, costs, or hours.
The design accommodation for non-analysts is the part worth copying. Ready-made chart templates let someone build a working dashboard without knowing which chart answers their question, which converts reporting from a specialist task into a self-serve one. Clicking an at-risk task from a chart opens it directly, where ownership can be reassigned or a deadline moved.
Why it works: Chart templates lower the friction of creating that crucial first dashboard, the exact point where most reporting initiatives (and software trials) fail. By making the "aha moment" achievable for non-analysts, Asana accelerates enterprise adoption and expands its user base beyond project managers.
Potential limitation: portfolio health indicators are calculated from project status updates, so the dashboard is only as current as the last person who wrote one. The lead time chart also measures creation to completion, which includes time spent in the backlog and isn't the same as cycle time, a distinction that matters if the number is being used to judge a team.
15. monday.com by monday.com's In-house Design Team
Standout Features:
- Battery bar per project
- Status labels as colored circles
- Cross-board aggregation
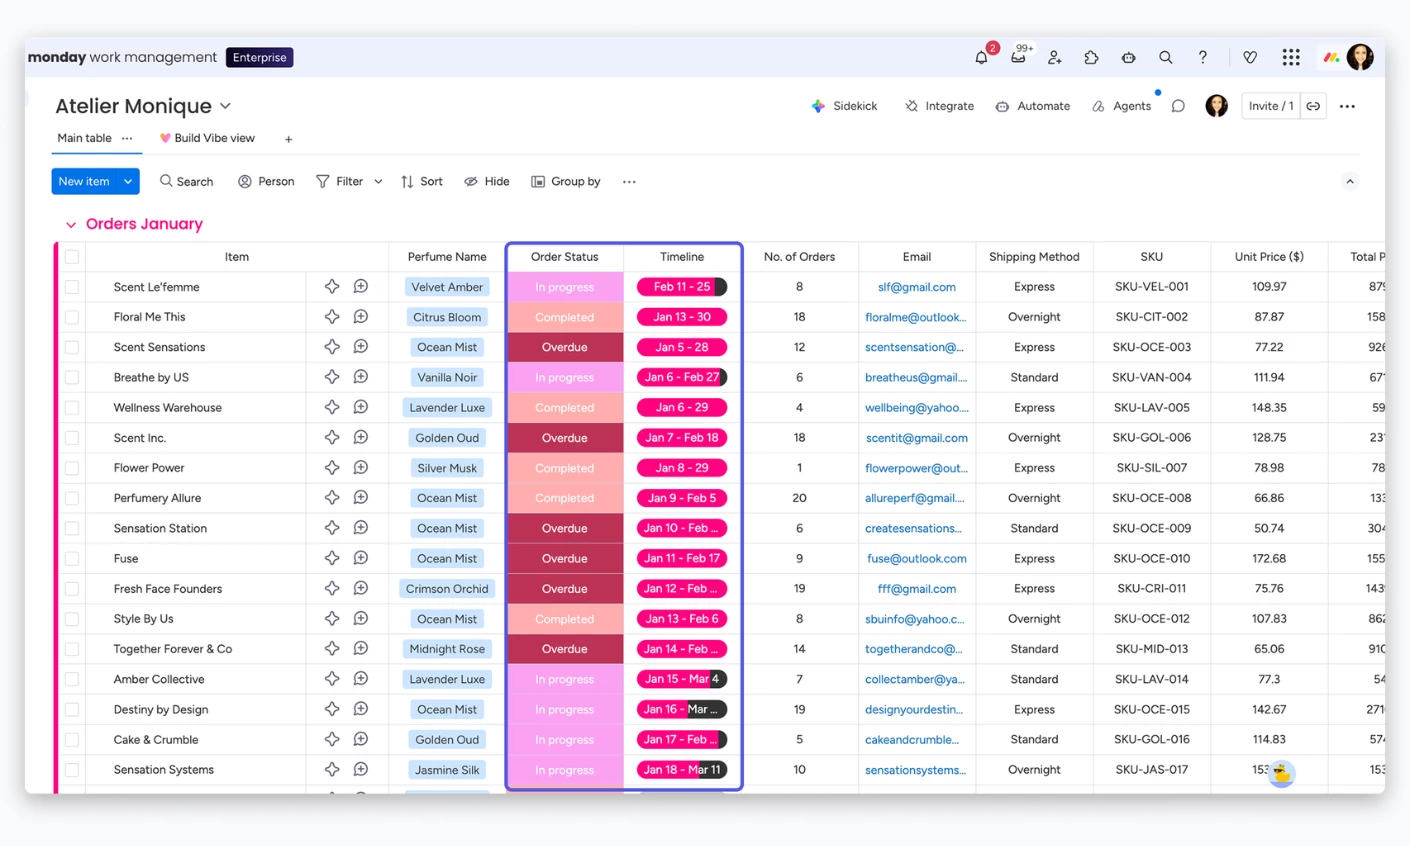
monday.com's dashboard docs describe dashboards built from more than 30 widgets that pull item and column data out of connected boards, including boards belonging to different portfolios, and show them side by side. The design bet is that status color is the primary unit of meaning, which is why the platform reads as a wall of color where its competitors read as a wall of numbers.
The Battery widget is the clearest expression of it. A single battery-style bar shows how much of a board is complete, with each status label rendered as a colored circle beneath it, and clicking a circle names the label and gives the percentage of items carrying it across every connected board.
An entire categorical distribution collapses into one object that reads at a glance and expands on demand. The Overview widget applies the same idea one level up, giving each connected board a row with its earliest and latest timeline dates and a battery bar splitting done from remaining.
Why it works: Encoding status distribution purely through color in a single "battery" object makes project health instantly readable. This scannability is what allows the platform to be sold upward to C-suite decision-makers, who demand immediate, high-level answers without digging into the weeds.
Potential limitation: Widgets surface data from columns, so a column that exists on some boards and not others contributes data only from the boards that have it.
A dashboard is only as coherent as the column naming across the boards feeding it, and no amount of widget configuration fixes an inconsistent taxonomy. Dashboards also build on desktop only, though they're viewable on mobile.
Best Dashboard Designs for eCommerce and Retail
ECommerce dashboards answer a question that changes by the hour: what is selling, to whom, and whether today is better than yesterday. The merchant reading it is rarely an analyst, so the design has to make the comparison obvious without a query.
- Shopify Admin by Shopify's In-house Design Team
- Klaviyo by Klaviyo's In-house Design Team
- Sneakers Online Store App by Apollo Studio
16. Shopify Admin by Shopify's In-house Design Team
Standout Features:
- One question per chart
- Labels outside the data area
- Color-independent encoding
Shopify's admin is the daily working surface for millions of merchants, and its decisions are documented publicly in the Polaris design system behind it. That documentation makes it one of the few commercial dashboards where the reasoning can be read rather than inferred.
Three rules do most of the work. Every visualization is built to answer a single question about the dataset, on the grounds that a chart answering several questions becomes hard to read and easy to misread.
Axis labels sit outside and separate from the data area so the range stays legible without competing with the data, and axis lines appear only where data appears rather than bleeding to the edge of the screen. Month and weekday names use standard abbreviations, a small rule that removes a surprising amount of clutter from any time series.
The third rule is an accessibility floor with a design consequence: merchants must be able to understand a chart without perceiving color. That forces a second encoding, whether position, label, or shape, into every chart that uses color, the same discipline that keeps a status system legible for a colorblind operator.
Why it works: WebAIM's 2026 Million report, which tested the top one million home pages in February 2026, found low-contrast text on 83.9% of them, up from 79.1% the previous year. Strict accessibility rules ensure the dashboard survives contact with a real merchant's dimly lit warehouse or sun-glared phone screen.
17. Klaviyo by Klaviyo's In-house Design Team
Standout Features:
- Global conversion-metric selector
- Peer benchmarks inline
- Role-gated reporting
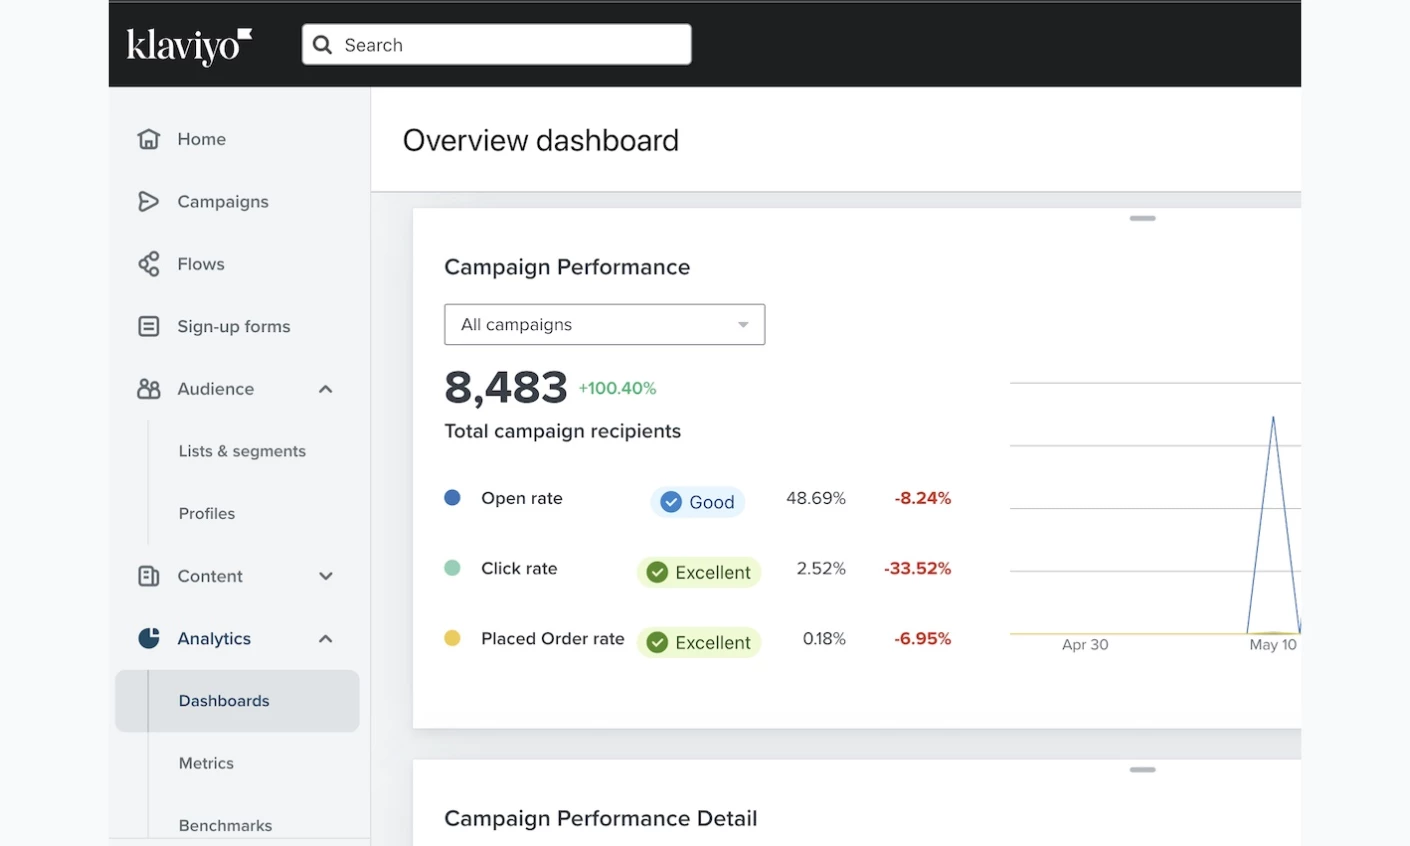
Klaviyo's overview dashboard lands every user on a prebuilt Overview, and its defining control sits in the header beside the date range: a single conversion-metric selector that redefines what every card counts. Pick Placed Order and the dashboard reports revenue behavior; pick a custom event and the same layout reports something else. One dropdown changes the meaning of the screen, which is a lot of power to hand a user on the strength of one clear label.
Benchmarks are woven in rather than parked in a separate product. The overview flags which metrics run ahead of or behind peer groups, and clicking one opens the full benchmark report. Industry benchmarks show in the graphs but never the tables, a defensible restraint, since a comparison belongs where its context is visible rather than in a cell where it reads as a target.
The deliverability card is the house style in miniature: bounce, spam, and unsubscribe rates in three consistently assigned colors over the chosen range. It stays blank until enough messages have been sent for the figures to mean anything. Access is scoped by role, so owners, admins, managers, and analysts reach reporting while campaign coordinators and content creators don't.
Why it works: A global metric selector allows one dashboard to serve multiple definitions of success, saving immense development costs. More importantly, it keeps the entire marketing team looking at the same structural view, establishing the platform as the singular system of record for revenue.
18. Sneakers Online Store App by Apollo Studio
Standout Features:
- Dashboard-structured home
- Lime green status accents
- Gallery-led product detail
The two dashboards above this one are merchant tools. Apollo Studio's Sneakers Online Store concept is the shopper-facing case, and it belongs here because it treats a retail home screen the way the rest of this list treats an operations screen: as a dashboard with a hierarchy rather than a feed.
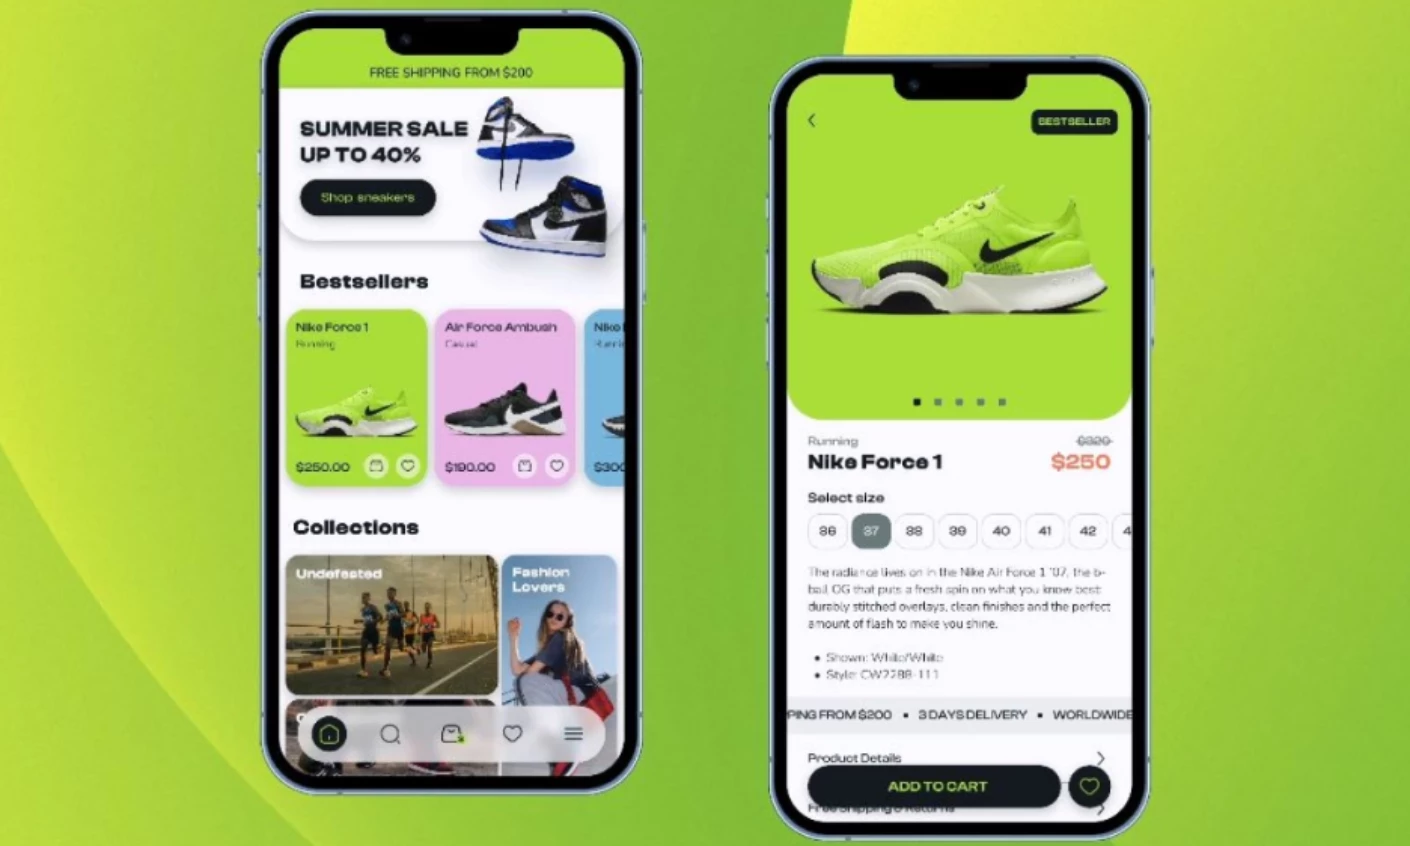
The home screen segments the catalog into named sections for best deals, bestsellers, and specific collections, so a shopper lands on a structured overview and picks a lane instead of scrolling one undifferentiated list. That is the same top-of-screen hierarchy decision Grafana and Shopify Admin make, applied to browsing rather than monitoring.
Color does status work here too. Lime green and a cooler pink mark the interactive elements against a restrained field, so a tap target registers before its label does, and the product detail leans on a prominent gallery carrying materials and sizing rather than a wall of copy.
Why it works: A browse surface organized as a dashboard shortens the distance between opening the app and finding something to buy. DesignRush's analysis credits the well-structured dashboard as the design's lead feature, which is the retail version of the hierarchy rule the operations dashboards in this guide are built on.
IoT and Smart Home Dashboard Examples
Physical-world dashboards get one distinct advantage: the data has a real-world location. Space itself provides a structural framework relying on rooms, zones, and floors that the user already understands. The following examples showcase how to successfully map dense, localized sensor data into modular, predictable layouts.
- Neuro Building Management System by UX Team
- Home Assistant by Home Assistant's Open-Source Project Team
- Smart Residential Complex App by Aleksandr Volodkovich
19. Neuro Building Management System by UX Team
Standout Features:
- Role-based views
- Modular cards
- White-label scalability
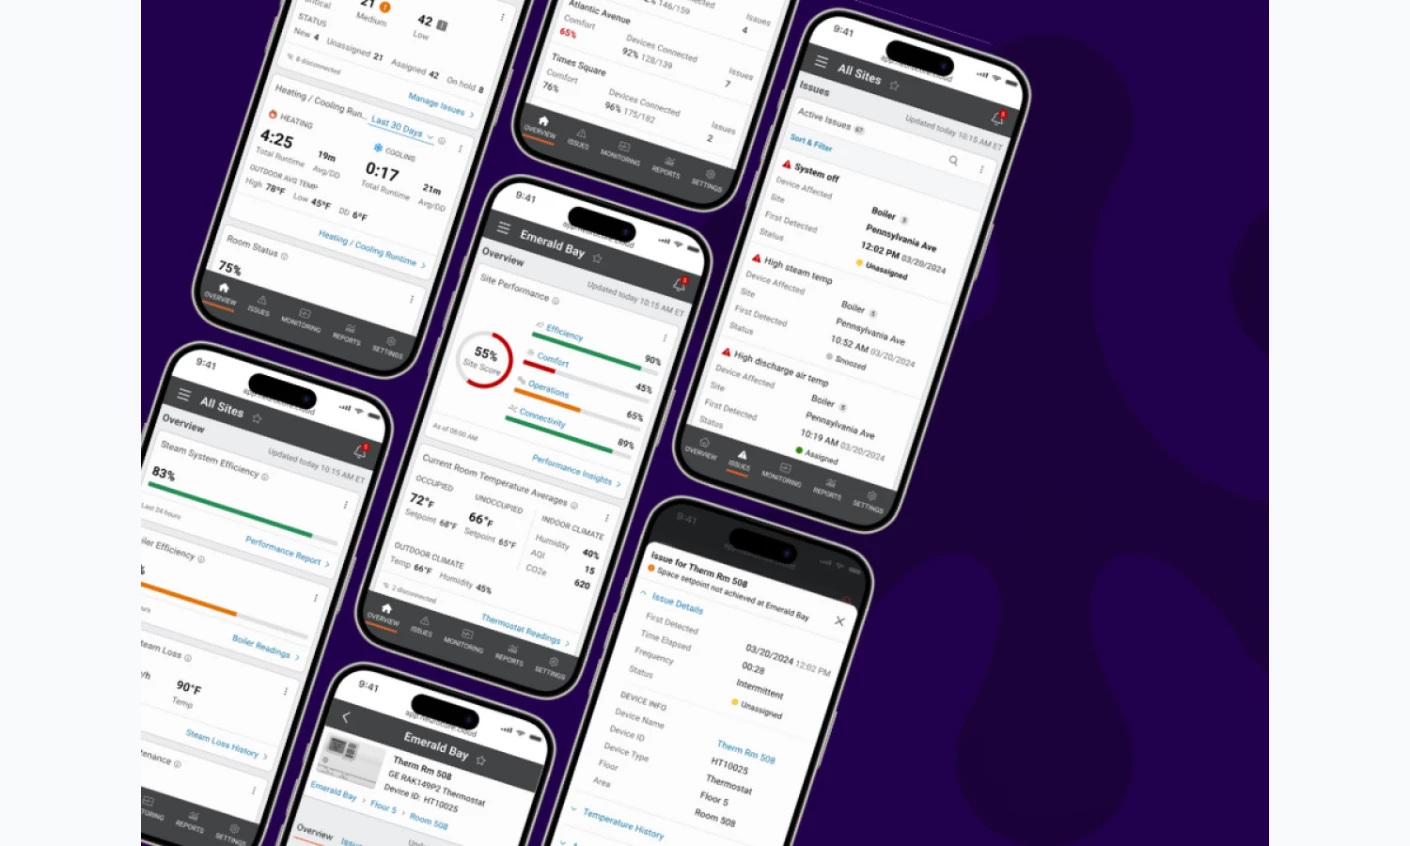
Neuro is a building management system, and it won People's Choice for App Design in the DesignRush Best of Design Awards 2025. Building data is the definition of overwhelming, with every sensor in every zone reporting continuously, consumed by facilities staff, tenants, and owners who each need a different subset.
DesignRush's jurors credited it for turning dense building and IoT data into clear, role-based dashboards that hold up across mobile and web, with smart hierarchy, modular cards, and a white-label structure that scales. Role-based views are the decision worth copying. Instead of one screen with a permissions filter over it, each role gets a composition built for the decisions that role actually makes.
Why it works: Composing specific views per role completely removes the training costs associated with complex, single-permissioned screens. For a white-label enterprise product, proving that tenants and staff can use it with zero onboarding is often the difference between losing a demo and winning a massive deployment.
Read the complete Neuro Building Management System design breakdown.
20. Home Assistant by Home Assistant's Open-Source Project Team
Standout Features:
- Grid-stable sections
- Area-grouped cards
- Per-section theming
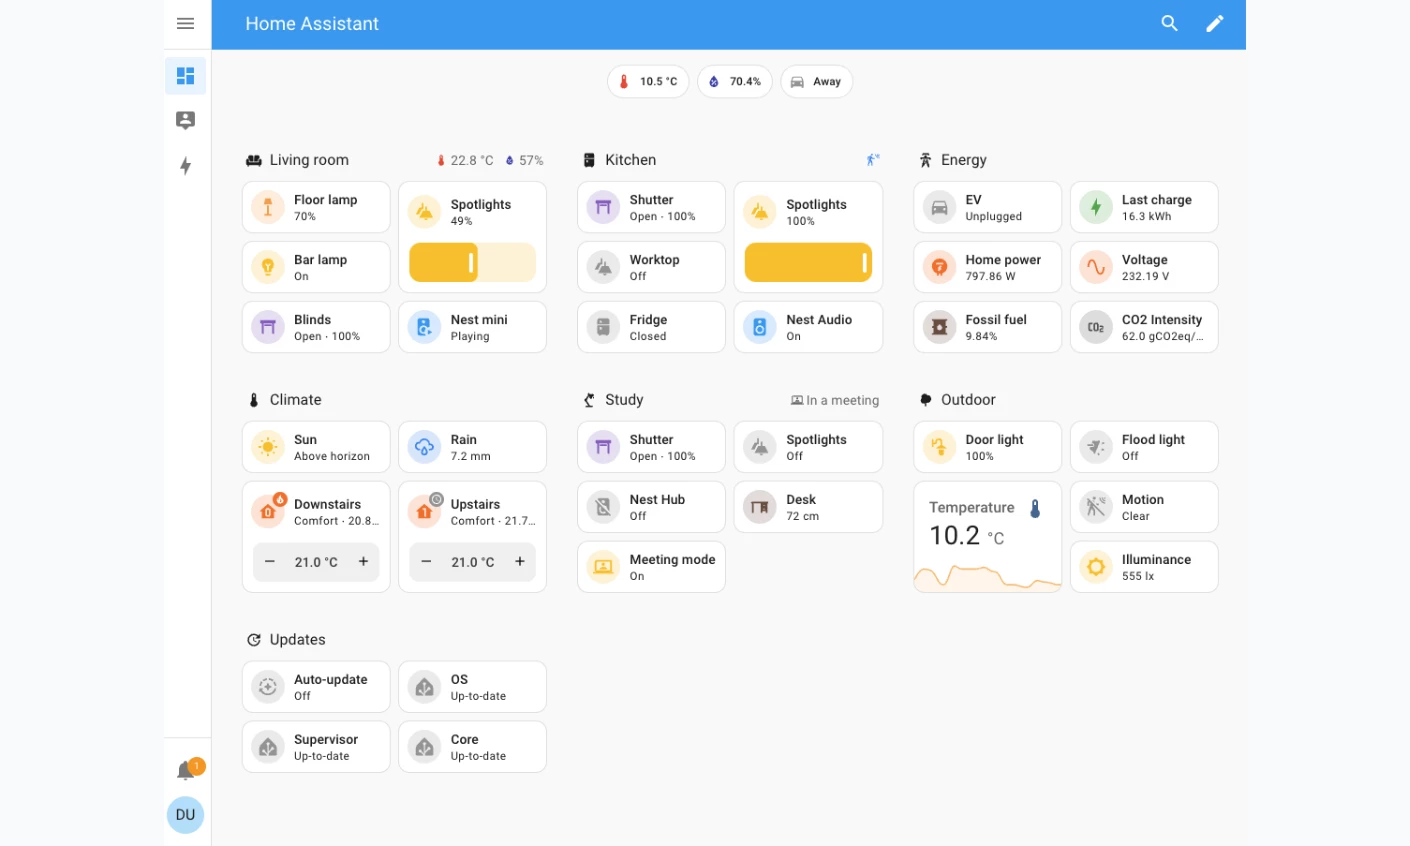
Home Assistant is open-source home automation software, and its dashboard redesign is the clearest published example of a team choosing predictability over efficiency. The original masonry layout arranged cards in columns by height, which packed space well but made card position unstable, so moving one card or resizing the window shifted everything else with it.
The Sections view, now the default, groups cards into a grid. When the window narrows, sections rearrange to fit the available width while the number of card columns inside each section stays fixed. The team's stated reason is that this preserves the user's muscle memory for where each card sits, and delivering it meant standardizing the width and height of the Tile, Button, and Sensor cards so they occupy predictable grid space.
The home dashboard prepopulates by grouping entities into areas, so rooms rather than device types provide the first level of structure. Sections can carry their own theme, letting a household use warm colors for alerts and cool ones for ambient information without a separate design system, and a footer card stays pinned above the others while scrolling.
Why it works: Locking cards to a predictable grid ensures the dashboard can be operated by muscle memory. For a smart home screen a user taps a dozen times a day, this physical stability creates deep product reliance; if a layout shifts and causes a misclick, the user abandons the interface.
21. Smart Residential Complex App by Aleksandr Volodkovich
Standout Features:
- Room filter as primary navigation
- Energy panel over day and month
- Voice control per room
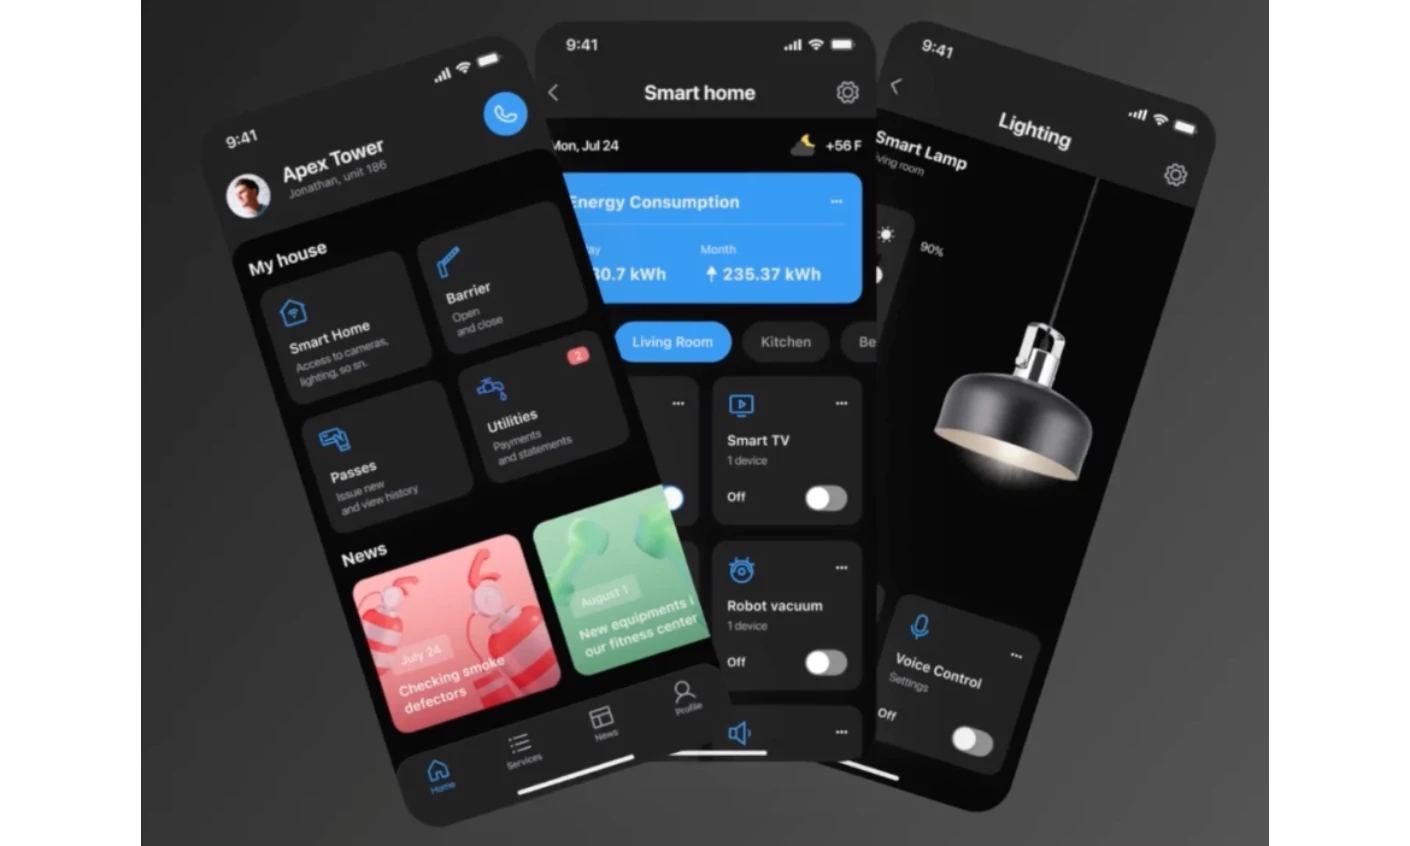
Aleksandr Volodkovich's Smart Residential Complex concept is a resident-facing control app for a connected building, and it makes the structural bet this section opens with: the layout follows the space. A room filter is the primary control, so a resident narrows the whole apartment to a single room and acts only on the devices there.
Each room opens a panel that states how many devices the setting covers, then exposes controls for lighting, sound, curtains, and appliances, with brightness, color, and on-time all adjustable and a voice command path for anyone who would rather not tap through it. An energy panel sits above the rooms and reports consumption for the current day and the running month, which keeps the one number a resident checks most at the top of the screen.
The app reaches past the walls as well. It carries vehicle-gate access, temporary and permanent visitor passes with an expiry the interface states plainly, and a utilities section for scheduling payments and reading meters through the phone camera.
Why it works: Mapping controls onto rooms removes the lookup step a flat device list forces, because the resident already knows the building's layout. A dark, high-contrast interface in one consistent blue keeps a dense control surface legible on a phone held at arm's length.
Dashboard Design Trends in 2026
Three things dominate the advice teams are given about dashboard design in 2026. Each is worth adopting under specific conditions, and each is worth refusing under others.
Dark Mode vs. Light Mode
No credible measurement establishes how many people prefer dark mode. The percentages in circulation (from 68%, 82%, to 91%) trace back to statistics aggregators with no named survey behind them, and none of them survive a basic fact-check.
The reading research is more detailed, and it points the other way. Nielsen Norman Group reviewed the academic literature in 2020 and reported that Cosima Piepenbrock's team at the Institut für Experimentelle Psychologie in Düsseldorf found light mode outperformed dark mode on visual acuity and proofreading tasks, in adults aged 18 to 33 and 60 to 85 alike, all with normal or corrected-to-normal vision.
A companion study found the light-mode advantage grew as font size shrank. Interestingly, participants reported no difference in their perceived readability even as their measured performance changed.
Dashboards run small type in dense tables, which is precisely the condition where the light-mode advantage is largest. NN/g also notes that people with cloudy ocular media, such as cataracts, may perform better in dark mode.
Therefore, the honest position is that the default should follow the task and the environment rather than the trend.
Condition | Favors light | Favors dark |
Small type, dense tables | ✔ |
|
Long sessions in a dim room |
| ✔ |
Bright ambient light | ✔ |
|
Users with cataracts or light sensitivity |
| ✔ |
Charts with saturated status colors |
| ✔ |
Extended reading of labels and text | ✔ |
|
Do not treat dark mode as a default aesthetic upgrade; treat it as an environmental and accessibility accommodation. For data-dense screens requiring precise, rapid reading, light mode holds an objective performance advantage.
The most effective design decision is to provide a system-aware toggle and rigorously test both palettes for contrast. Designing in one mode and lazily inverting to the other almost always fails, as a status color that reads perfectly on white will often vibrate, bleed, or disappear on charcoal.
Glassmorphism
Glassmorphism hands you a frosted-glass panel: a translucent fill, a backdrop blur somewhere in the 12 to 20 pixel range, a hairline white border at low opacity, and a soft shadow underneath. Concept work carried the style for years. Now it ships in enterprise interfaces.
The panel reads as depth without a drop shadow, and it earns its keep when the layer beneath it carries meaning , a filter panel floating over the map it filters, say. Contrast is where things get dicey.
A translucent card borrows its background from whatever sits behind it. So the same white label passes a contrast check over a pale street grid, then fails a second later once a dark satellite tile scrolls underneath.
Jason Saldana, President and CEO of the branding agency Copa Design, describes beauty and function as two sides of the same coin; neither can be sacrificed. In practice, that means testing your blur against the ugliest background it will ever land on. Mockups always pick the flattering one.
As such, it should only be used when seeing the context beneath the UI element is genuinely helpful to the user (like a floating control panel over a live map).
If you use it, you must dynamically test text contrast against the absolute darkest and lightest possible backgrounds that could scroll behind the glass. Otherwise, you are trading accessibility for aesthetics.
AI-Surfaced Insight Modules
Gartner projected in August 2025 that 40% of enterprise applications would carry task-specific AI agents by the end of 2026, up from under 5% in 2025.
Four dashboards on this list already ship one, and together they show you what the pattern looks like in practice. Ramp's policy agent triages a full transaction set, then forwards the exceptions with the relevant policy clause attached.
PostHog compares a dashboard before and after a refresh and tells you what moved. When filter overrides muddy that comparison, it switches itself off. Mercury fields questions like "why did expenses increase this month" in plain conversation, while Oura's Advisor reads sleep, activity, and dietary data as one picture.
All four need the same thing: a visible path from the claim back to the rows that produced it. A module telling you three shipments are at risk belongs one click away from those three shipments. You can squint at a chart and sense whether it's lying to you. An assertion gives you nothing to squint at.
An AI insight module is only as valuable as its audit trail. If the AI agent summarizes a trend or flags an anomaly, the interface must immediately provide a one-click path to the raw data rows that triggered the alert. Dashboard design in 2026 is about proving the AI’s work so the human operator can trust the output.
How To Choose the Right Dashboard Design Approach
Match the approach to the decision the dashboard supports rather than to the industry it sits in. A fleet console and a hospital console have more in common with each other than either has with an executive report.
If the dashboard is for | Prioritize | Deprioritize |
Real-time operational monitoring | Status encoding, exception queues, alerting | Historical depth, configurability |
Executive reporting | KPI cards, period comparison, one screen | Drill-down, filtering |
Analyst tooling | Drill-down paths, filters, raw data access | Visual restraint, fixed layout |
Consumer-facing products | One headline figure, plain language, mobile layout | Data density, multi-panel views |
Additionally, a dashboard’s layout must survive the physical constraints of the hardware it lives on. Screen size and input method (a desktop cursor versus a hurried thumb tap) dictate exactly how much data a user can absorb at a given moment.
Imtiaz Ahmed, founder of Design Fly 24, begins with the person on the other side of the screen. It's all about understanding the end user, he told DesignRush. Layout decisions follow from there, and the feature list waits its turn.
If your users work on | Design for |
Desktop | Multi-panel density, complex chart types, hover detail |
Tablet | Horizontal navigation, larger touch targets, simplified charts |
Mobile | One metric per screen, swipeable cards, critical alerts only |
There's a related fork in the road: lock the vocabulary down, or leave it open. Linear and Asana each pick a side. A fixed set of measures means everyone on the team says cycle time and means the same thing by it.
A configurable one lets you answer questions the vendor never saw coming, though someone still has to write those definitions down and keep them current.
Build versus embed lands in the same place. Embedding an existing business intelligence tool ships faster and costs less, right up until your product's rules stop matching the tool's assumptions.
Shields describes the threshold as the point where "commercial tools force us to bend our business to fit their mold." For Freightmate, per-user licensing and customization limits pushed the team to build reporting in-house: load-tested to a million rows, and fluent in the same language as the rest of the product.
What Dashboard Design Costs and How Long It Takes
DesignRush lists 4,548 dashboard design companies, rated 4.6 on average across 6,902 verified client reviews, with rankings last updated on June 24, 2026. Among the agencies ranked on the first page of the dashboard design agency directory, published hourly rates run from $20 to $175 and minimum budgets from under $1,000 to $25,000–$50,000.
The spread tracks location and seniority more than capability. Clay in San Francisco publishes $175 per hour, UX Team in New Jersey $145, Designli in Greenville $85, Alty in Portugal $75, ELEKS $50, and Ungrammary in Mumbai $35. A US-based senior team and an equally capable offshore one can differ by a factor of four on the same brief.
Scope | What it includes | Typical engagement |
Single dashboard redesign | One view, existing design system, no new data model | Weeks |
Dashboard plus design system | Component rebuild first, then screens | Months |
Product-embedded reporting suite | Custom reporting replacing an embedded BI tool | Months, then ongoing |
Overruns turn out to be easier to predict than the base cost. Most of the gap between estimate and invoice comes from four places: features added mid-project, integration complexity, client content delays, and extra revision rounds. Only the first one is truly unavoidable.
Marina Marsh, Founder and President of Web Loft Designs, points out that the design line rarely tells you the whole cost.
There's a lot more that goes into creating a successful website, she told DesignRush. Dashboards work the same way, and the data model plus the performance tuning often cost more than the interface sitting on top of them.
Best Dashboard Designs: Key Takeaways
Fixing a failing dashboard does not always require a massive budget or a ground-up rebuild. Work through these six foundational fixes in order of effort, tackling the quickest and cheapest wins first.
- Audit your color system. Confirm each color means one thing across every screen, and cut any legend past five categories. A morning's work.
- Remove non-data ink. Lighten gridlines, drop borders, and delete axes where values are already labeled. Stop before the chart stops reading as a chart.
- Fix the hierarchy. Move the summary to the top-left, push detail behind an interaction, and check that a user can find the exception without comparing cards.
- Make the queue exact. If your dashboard shows a count of things needing attention, make sure every item in it can actually be acted on today, the way Ramp's inbox does.
- Measure perceived load, not just measured load. Decide what renders instantly and what streams in. This is where an optimized query stops helping.
- Rebuild the design system before the screens. Slowest and most expensive, and the one that decides whether every later change is cheap or costly.

Our team ranks agencies worldwide to help you find a qualified partner. Visit our Agency Directory for the top dashboard design agencies, as well as:
- Top UI/UX Design Agencies
- Top Product Design Companies
- Top Software Development Companies
- Top Web Development Companies
- Top AI Companies
Our design experts also recognize the most innovative design projects across the globe. Visit our Design Awards section to see the best and latest in design.