AI Infographics: Key Points
- AI-infographic generators are accelerating visual production by 2–5x, reducing design costs up to 60%, and driving up to 87% higher conversion rates for visual-led campaigns, making them a key asset for marketers and agencies.
- AI isn’t replacing graphic design. Teams that pair automation with strategic oversight are outperforming competitors in speed, consistency, and content volume.
- Brands investing in visual content strategy outperform competitors in engagement and recall: 90% of marketers say infographics directly influence purchasing decisions, while Google prioritizes visual-rich content in SEO rankings.
Design bottlenecks slow down everything: launches, pitches, reports, even strategy.
But in 2025, a new wave of AI-powered infographic tools is helping teams move faster without cutting corners. These platforms aren't gimmicks; they're practical, repeatable systems for turning raw ideas into ready-to-use visuals.
Whether you're a CMO building campaign reports, an agency scaling content for clients, or a brand team converting briefs into assets, here are 9 tools changing how visual content gets done.
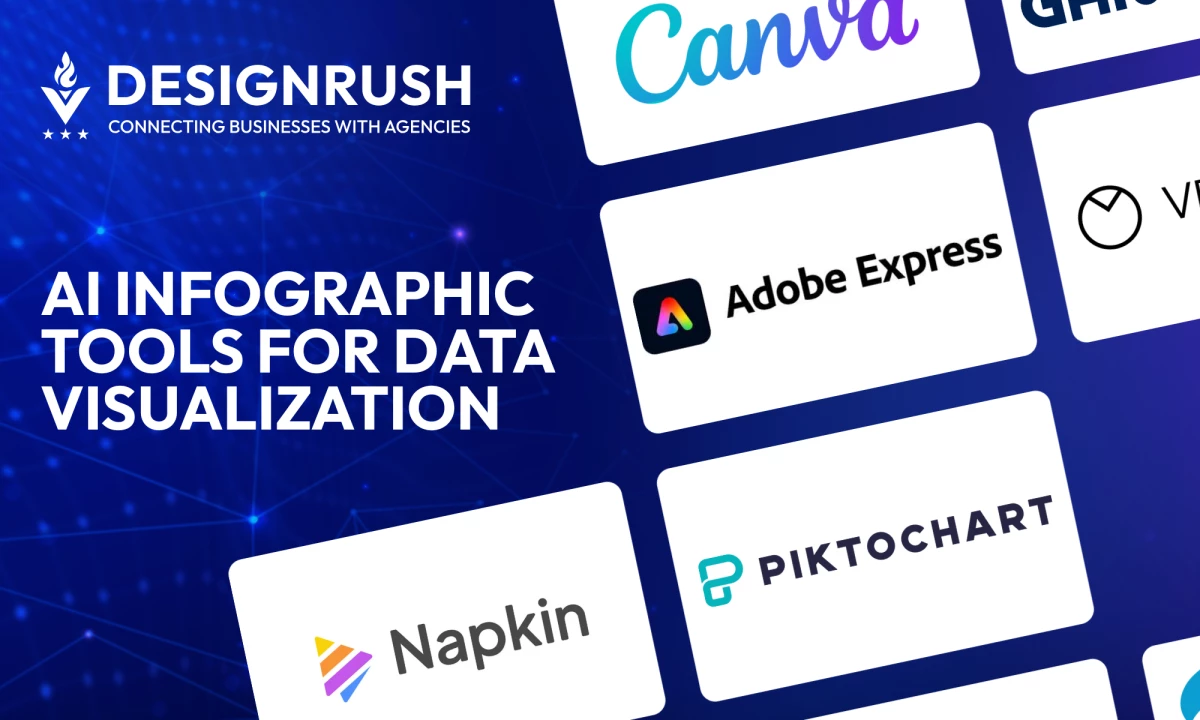
The Top 9 AI Infographic Tools and What They’re Best At
Here’s your strategic rundown of the top platforms being used by agencies, brand teams, and marketing leaders today.
1. Piktochart AI
Overview:
Paste your content, and Piktochart’s AI Assistant converts it into structured visuals. Drag-and-drop editing and branded outputs make this strong for business reporting.
Pros:
- Beginner-friendly editor
- AI Assistant transforms copy into visual layouts
- Built-in brand assets and presentation tools
- Excellent for reports and presentation-ready infographics
Limitations:
- AI Credits Per Use: AI-based infographic creation consumes credits, one each for prompt, text, and more, and limits apply per plan. Free users have significantly fewer credits than Pro/Business plans.
- Template Familiarity: AI tends to use the same base templates. Without manual customization, outputs may feel repetitive or generic.
- Basic Data Functionality: While charts are supported, Piktochart doesn’t offer live data linking or dynamic visual updates, requiring manual data input for each infographic.
- Limited Collaboration Features on Free Plan: Team-based sharing and feedback functionality is locked behind paid plans
Best For: Creating infographics for case studies, hiring docs, newsletters, and team updates.
2. Canva + Magic Design AI
Overview:
With Magic Write (text) + Magic Design (layout), Canva offers rapid infographic mockups driven by topic inputs. You enter a topic, and Canva suggests design templates filled with relevant visuals and layouts.
Pros:
- Rapid layout drafts with Magic Design
- Brand Kit + Resize tools for multi-channel use
- Firefly-backed AI image generator (commercial-use safe)
- Strong for social and internal marketing visuals
Limitations:
- Not Truly “Generative”: Magic Design doesn’t create infographics from scratch based on data or text prompts. It mostly surfaces and repurposes existing templates with placeholders.
- Manual Content Placement: Users must still input actual data, adjust layout logic, and decide how to visualize stats or text. The AI does not understand content hierarchy or data relationships.
- Inconsistent Context Matching: AI can misinterpret topics and generate irrelevant or generic templates (e.g., suggesting bar charts for qualitative content).
- No Live Data Integration: Unlike Visme or Piktochart, Canva doesn’t currently support spreadsheet-to-chart functionality or automated data visualization.
Best for: Marketing teams needing quick-turn infographics for social, presentations, internal decks, or lead magnets.
3. Venngage Infographic Builder
Overview:
Venngage is a long-standing infographic platform with a focus on professional templates, brand consistency, and team collaboration.
While its AI features are relatively light compared to others, it offers Smart Templates that auto-adapt layouts and some copy-generation features. It shines in industries that need polished, static infographics fast, especially in education, health, and corporate training.
Pros:
- Templates sorted by industry use
- Teams can co-edit and comment in real-time (for workflow and approvals)
- Chart/map builders that make it easy to plug in numerical data for clean graphs
- Solid visual library built for business use (not just stock images)
Limitations:
- Limited AI: No AI layout generation or full visual automation. Users must manually input structure and content.
- Static Only: Infographics are fixed; no interactive elements like animation, tooltips, or embedding.
- Export Restrictions: On free and low-tier plans, exports are limited to low-res files with watermarks.
- Requires Manual Visual Planning: Layout logic is up to the user. There’s no “suggested flow” based on content length or structure.
Best For: Nonprofits, educational institutions, HR/ops teams, or regulated industries needing repeatable design outputs.
4. Napkin AI
Overview:
Napkin is minimal by design: paste in a quote, list, or insight, and the tool auto-styles a social-ready infographic card—ideal for solopreneurs or B2B marketing.
Pros:
- Zero design skills required
- Great for daily posts or social growth
- Insight-style content styling
Limitations:
- Very Basic Visuals: Outputs are minimal and often repetitive (no complex layouts, charts, or data visualizations).
- No Interactivity or Branding: No brand kit, logos, or charting, just static visuals with AI typography.
- No Manual Editing: You cannot refine the layout directly; all edits must happen in text format.
- Niche Use Case: Not suitable for multi-section or data-heavy infographics, better for insight-based micro-content.
Best For: Solopreneurs, creators, or marketing leads publishing insight-based visuals for social. Not designed for full reports or infographics with multiple data points.
5. Gamma AI
Overview:
Gamma AI blends text-to-slide generation with infographic logic to produce deck-like visuals based on written prompts.
While not a traditional infographic editor, it excels at transforming structured ideas into clean, scrollable presentations with infographics embedded in context (e.g., charts, lists, timelines). Gamma uses GPT for copy, coupled with built-in design templates and data visual tools.
Pros:
- Structured slide logic via prompt
- Gamma decks are hosted and scrollable, allowing link sharing
- Brand theme builder for reuse
- FAST. Near-instant output from raw prompts
Limitations:
- Deck-Oriented Format: It’s better for slide-like storytelling than one-page static infographics.
- Basic Visual Elements: Lacks the rich icon, illustration, and chart depth of tools like Canva or Visme.
- No Chart Animations or Hover States: While clean, visuals are static, no interactivity or animation support.
- Requires Prompt Tuning: Output quality heavily depends on how well the input is structured; poor prompts lead to generic decks.
- No Spreadsheet Sync: Manual data entry is required, no CSV/Excel auto-import.
Best For: Consulting firms, strategy teams, or agencies producing pitch decks, data explainers, or training content that benefits from infographic-style slides.
6. Adobe Express (with Firefly AI)
Overview:
Adobe Express is a cloud-based visual builder for infographics, social posts, web pages, and videos. Its latest integration with Firefly brings powerful generative AI: Text-to-Image, Generative Fill, Text Effects, and enhancements tailored for fast, visually compelling creation.
Here's how you can improve on your infographics with Adobe's Firefly AI:
Pros:
- Fast asset creation from templates
- Firefly-generated images and text effects
- Scheduling tools for social media
- Commercially safe, trained on licensed/public domain assets
Limitations:
- No AI Layout Generator: Firefly focuses on asset generation, not automated infographic layouts.
- Limited Chart Capability: Basic charts and icons are available, but no auto-chart suggestions.
- Post-Gen Editing Required: You must manually design infographics starting from templates, no instant data storytelling.
- Premium Features Behind Paywall: Full AI and asset libraries require a $9.99/month Premium plan.
Best For: Campaign visuals, carousel headers, and social-ready content for branded promotions.
7. Visme AI Designer
Overview:
Visme’s AI Designer allows users to generate full infographic drafts (text, layout, visuals) directly from prompts. Supported by tools like Brand Wizard, AI Writer, and Stable Diffusion–based image generation, it aims for a top-to-bottom rapid visual builder.
Pros:
- True prompt-to-visual generation
- Built-in brand wizard for fonts, colors, logos
- Animation and interactivity supported
- Fast content repurposing at scale
Limitations:
- AI Drafts Still Need Polish: Generated drafts may need styling tweaks to align with tone or data nuance.
- Credit-Based Usage: Design generation and AI features consume credits, limited in lower tiers.
- Learning Curve: Fully mastering layout tweaks, animation, brand application takes time.
- Higher Pricing for Full Feature Access: Advanced AI and brand tools require Pro or Business plans.
Best For: Agencies, marketers, and enterprises needing branded, interactive infographics created quickly from briefs or blog content.
8. Infogram’s AI Infographic Generator
Overview:
Infogram's AI tool lets you input your topic or paste slides of copy (whether data, narrative, or a brief) and the AI suggests structured layouts, ideal chart types, bullet formatting, and visual elements.
It’s a data-focused assistant designed to surface clarity by recommending the most effective visual storytelling components. You can then edit and customize within Infogram’s WYSIWYG editor.
Pros:
- Smart chart selection based on content
- Helps break long paragraphs into bullets or simplified key points
- Supports animations, tooltips, and embeddable interactive infographics
Limitations:
- AI Generates Guidance, Not Completed Designs: You still need to manually adjust layout details and visuals.
- Chart Data Must Be Entered Manually: No spreadsheet syncing; all data needs manual input.
- Limited Design Flair: Visual style is polished but lacks depth and customization compared to Canva or Visme.
- Free Plan Restrictions: Interactive exports and AI capabilities may require premium plans.
Best For: Dashboards, email visuals, quarterly reports, investor-ready content.
9. Genially
Overview:
Genially focuses on engagement through interactive infographics, supporting pop-up tooltips, animated sequences, embedded videos, and click-driven storytelling.
Its maker is designed for explorative visuals that guide the viewer through information in an engaging sequence.
Pros:
- Thousands of icons, charts, diagrams, and templates optimized for data story flows
- Easy drag-and-drop interface (no learning curve)
- Add animations, pop-ups, clickable zones, and timelines without code
Limitations:
- No AI Layout Assistant: Design remains manual, no AI prompts or auto infographic generation.
- Limited Data Automation: You must manually input data into charts; no AI-powered suggestion.
- Potential Performance Issues: Infographics with heavy animations may lag on some devices or browsers.
- Branding Constraints: Branding control exists but isn’t as robust as the other tools on this list.
Best For: Creating interactive reports, storytelling assets, or visual onboarding that mimics microsite behavior.
Why AI Infographic Tools Are a Strategic Advantage, Not a Design Threat
Visual content is essential to today’s marketing performance, driving 94% of first impressions and directly influencing purchase behavior. But traditional graphic workflows aren’t built for speed or scale.
Before we get ahead of ourselves, let’s clarify one thing: AI-generated infographics aren’t here to replace designers. They’re designed to automate layout logic, extract insights from text, and generate first-draft visuals that significantly shorten production timelines.
The best agencies aren’t choosing between AI or human, they’re blending both for maximum efficiency and scale.
Traditional vs. AI-Generated Infographics
.gif)
Verdict: There’s No War, Only Workflow Evolution
AI infographic tools don’t diminish the role of design. Instead, these AI tools allow strategists and creatives to shift focus from production to concept, iteration, and brand clarity.
For agencies and CMOs, the ROI is clear:
- Cut design time by up to 80%
- Produce more content in less time
- Empower teams to self-serve visuals within brand systems
Tip for brands: When hiring agencies, ask which platforms they use and how they build strategic workflows around them. Tool choice without process is a red flag.
The Business Case: Who Gains the Most from Infographic AI?
CMOs: Fast Visual Strategy Execution
- Use text-to-graphic tools to visualize campaign results, reports, or internal comms
- Create leadership decks from briefs in hours, not days
- Delegate visual production to comms/marketing team with brand-safe templates
Agencies: Scale Offers & Speed to Market
- Productize infographic design with AI-assisted workflows
- Use tools like Visme or Infogram to power client content pipelines
- Bundle visuals with strategic storytelling and data clarity
Marketers & Brand Teams: Consistency + Speed
- Repurpose blog content into snackable visuals
- Build SEO-optimized infographics for web, email, and social
- Launch data storytelling at scale without straining internal design resources
Big Brand Case Study: Nike’s “Never Done Evolving”
This standout example of AI-powered storytelling from Nike and AKQA’s award-winning “Never Done Evolving” campaign, celebrates Serena Williams and Nike’s 50th anniversary.
While Nike and AKQA’s “Never Done Evolving” campaign did not use a commercial AI-infographic generator tool, this example demonstrates how advanced AI, original creative vision, and data storytelling can converge to deliver breakthrough visual experiences. It serves as a big-picture illustration of what's possible when agencies blend conceptual storytelling with AI-powered innovation.
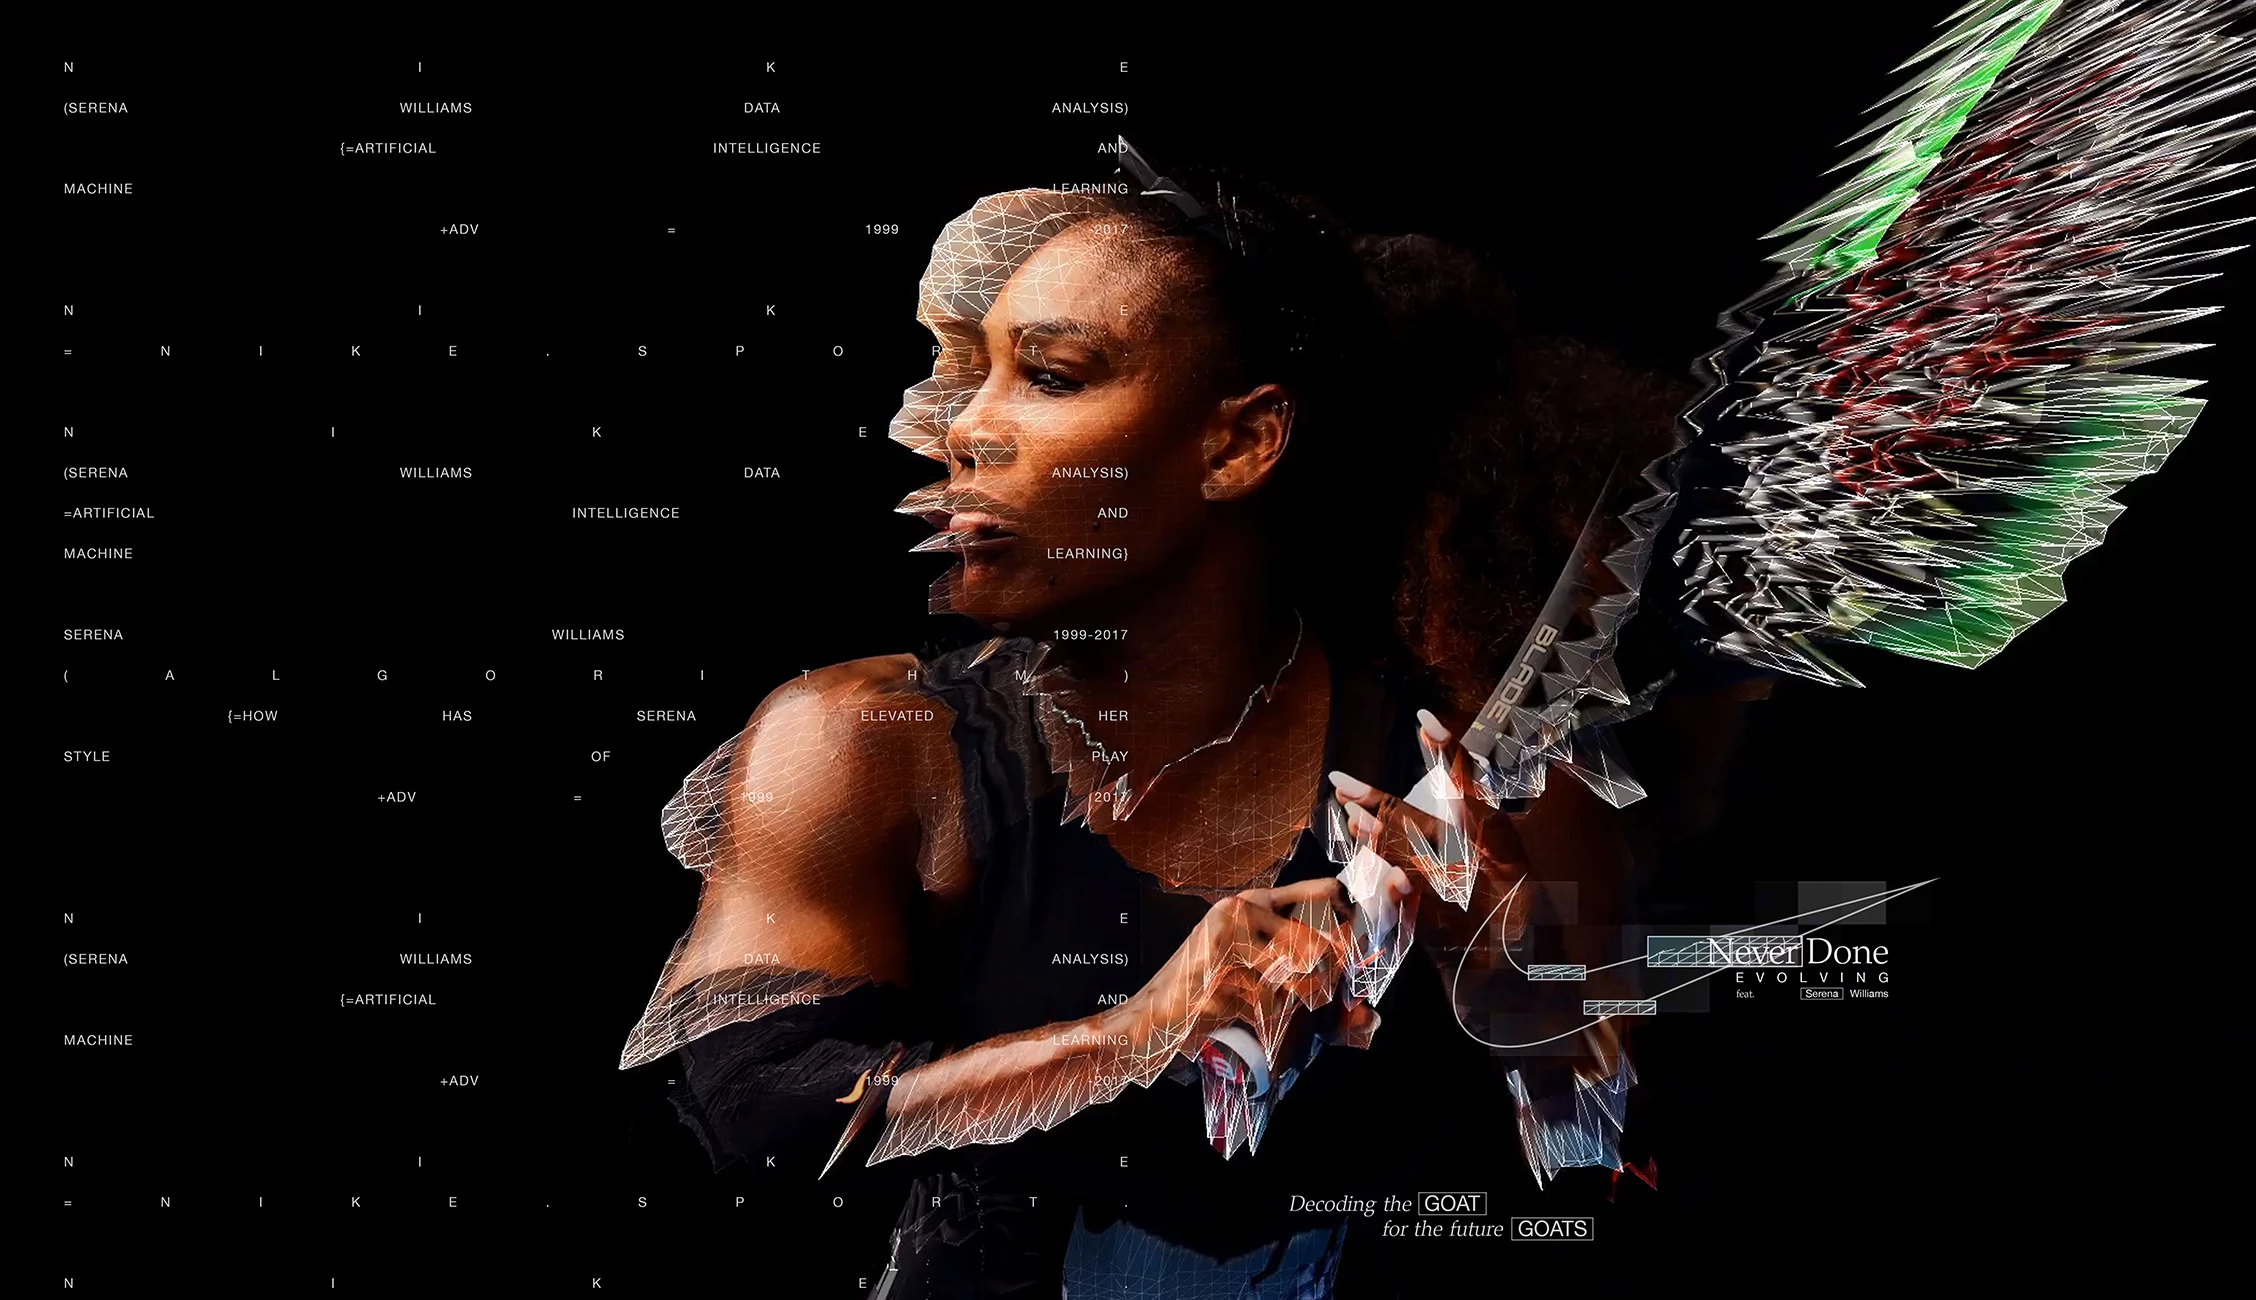
- Data Meets Drama: Within two days of Serena’s retirement announcement in August 2022, AKQA produced a year-long, AI-driven visualization. Using archival footage and the Stanford-inspired vid2player technique, they created virtual avatars of 1999 Serena and 2017 Serena, modeling decision-making, shot selection, agility, and recovery, even generating over 130,000 simulated games to analyze performance evolution.
- Execution & Impact: The simulated match was presented as a live virtual tennis event, complete with commentary, sound effects, and technical insight. The result? A record-breaking YouTube livestream that reached 1.69 million subscribers, boosted organic views by a staggering 1,082%, and secured over 12 million media impressions in publications like AdAge, Fast Company, and People.
- Recognition & Innovation: Touted as one of the “most accurate virtualizations of an athlete ever developed,” the experience blurred the lines between sport, tech, and design. It earned top honors in Victoria’s Premier Design Awards for Digital Design and multiple Clio and Cannes Grand Prix accolades.
What It Means for Agencies & Brands Hiring Them
- Narrative Scalability: This project illustrates how AI-infused storytelling can transform static data into emotionally resonant narratives, positioning agencies to deliver extraordinary, brand-defining content at scale.
- Market-Leading Credibility: Agencies that can articulate strategic workflows from data intake to immersive AI visualization demonstrate a higher tier of service, a valuable differentiator when brands evaluate agency partners.
- Strategic Storytelling Fuel: Beyond its visual spectacle, the campaign creates enduring value in repurposable visuals, media attention, and a blueprint for future investor or consumer engagement.
Quick Case Studies: What Leading Agencies Are Doing
- Visual Capitalist built a media empire around infographics, monetizing through sponsorships and licensed data content.
- Column Five Media turned visual content into a repeatable offer, now powering brand pipelines at scale.
- Statista Design Services uses AI to transform complex datasets into high-impact editorial and enterprise visuals.
In each case, the lesson is the same: infographics aren’t filler, they’re front-end tools for thought leadership, monetization, and visibility.
For agencies, this means:
- Treat infographic design as a standalone offer
- Use AI to pitch more often and deliver faster
- Combine automation with strategic oversight to preserve margin and elevate quality
AI Infographics is a Growth Lever: The Bottom Line
For agencies and brands, AI-generated infographics are more than a novelty. They’re a way to multiply output, deepen storytelling, and position services for higher-margin, faster-turnaround work.
That said, success lies in how they’re used, not just that they’re used. The most effective teams don’t hand the wheel to AI. They build a system around it: one that blends automation, branding, and strategic thinking into a repeatable, monetizable engine.
For CMOs, agencies, and brand teams alike, infographic AI is not just a creative trend, it’s infrastructure for faster, more strategic visual communication.
Brands that integrate these tools into their content workflows are:
- Reducing production bottlenecks
- Increasing testable content volume
- Building more personalized, high-performing visuals across every channel
And agencies that know how to pair automation with strategic storytelling aren’t just pitching faster, they’re winning more often.
![]()
Infographic AI isn’t just speeding up design. But it is redefining how agencies pitch, scale, and monetize visual content.
For agencies and ambitious brands, the edge belongs to partners who know how to combine automation with strategic storytelling.
Need a Design Partner Who Can Blend Strategy with AI Execution?
Our team ranks agencies worldwide to help you find partners who get the business side of design.
Visit our Agency Directory to connect with top firms in:
You can also check out our Awards section to see how visual strategy is driving real results.
AI Infographics: FAQs
1. What are AI infographics, and how do they work?
AI infographics are visual content generated or assisted by artificial intelligence. These tools transform text, data, or prompts into infographic layouts using pre-trained models and design logic. While some platforms auto-generate visuals from content, others assist with layout suggestions, brand styling, and copywriting, reducing manual design work and accelerating production.
2. When should you use AI infographic tools instead of traditional design workflows?
AI infographic tools are ideal for fast-turnaround content, data summaries, social visuals, and internal reports. They’re especially useful when teams need to create large volumes of visuals quickly and consistently, without overloading design staff or sacrificing brand alignment.
3. What’s the best AI infographic generator for marketers or agencies?
The best tool depends on your goals. For full infographic generation, Visme AI and Gamma are strong choices. Canva Magic Design is great for quick visuals, while Infogram and Genially offer interactive and data-focused outputs. Agencies often use a combination to serve different client needs efficiently.