Discover leading graphic design agencies in the USA delivering brand identity, digital assets, packaging, and marketing collateral built to scale with your business. Filter agencies by location, rates, reviews, team size, and more.
Organic rankings are determined by five factors: top services, reviews, portfolio, awards/press, and team expertise. Sponsored listings pay for a placement that appears above organic positions. Sponsorship does not affect star ratings or review content - read more on our methodology page.
For People. For Progress.
Pastilla is a full-service agency based in Los Angeles. We partner with public agencies, nonprofits, and global brands to turn complex missions into clear brand and digital experiences that build trust and move communities to action...
Top Services:
- Branding
- Design Services
- Graphic Design
- Web Design
- Web Development
- Show more
- Location
- Los Angeles, California
- Number of Employees
- Under 49
- Average Hourly Rate
- $185/hr
- Minimal Budget
- $50,000 & Up
- Portfolios Count
- 18 Projects Listed
Data sourced from the agency's DesignRush profile, its website, and other relevant accountsPastilla Services
Data sourced from the agency's DesignRush profileCity of LA Recreation & Parks Black Girls Code Sacramento Public Library Consumer Technology Association Clean Power Alliance Microsoft Metrolink Hollywood Foreign Press Associations (HFPA) Disney Lossan
Make Change. Not Noise.
InVision Communications is a full-service engagement solutions agency that drives action through strategic and creative experiential, design, digital, and communication campaigns. By focusing on what truly matters, they deliver impactful stories that capture limited audience attention effectively...
Top Services:
- VR/AR
- UI/UX Design
- Mobile App Development
- Graphic Design
- Web Development
- Show more
- Location
- Walnut Creek, California
- Number of Employees
- 100 - 249
- Minimal Budget
- $50,000 & Up
Data sourced from the agency's DesignRush profile, its website, and other relevant accountsInVision Communications Services
Data sourced from the agency's DesignRush profileCatepillar Simens Atlassian
InVision Communications Reviews & Testimonials
Lew's Review Sourced from Google
The people at InVision Communications are some of the nicest people I’ve met. Everyone works hard and they welcome everyone in as family.
Reviews verified by DesignRush and sourced from the agency's profile View All Reviews



Graphic Design Companies by City
Graphic Design Companies by State
Graphic Design Specializations in the US
Popular Services
Hiring Guide: How to Choose the Best Graphic Design Companies in the US
What can a US graphic design company do for a business?
When working with top graphic design companies in the US, you can expect visual systems that shape brand identity, customer perception, and marketing performance across every channel.
They'll create logos, brand guidelines, digital assets, packaging, marketing collateral, and UI visuals to support clear and effective business communication.
Design companies help businesses:
- Establish a recognizable and consistent brand identity
- Improve engagement and conversions across digital channels
- Support product launches with packaging and visual storytelling
- Strengthen credibility through cohesive design systems
- Produce ongoing marketing assets at scale
According to Forbes Advisor's content marketing survey, graphic design is the most outsourced content service, with 47% of marketers outsourcing design work.
Consistent brand presentation can increase revenue by up to 23%.
Brands that maintain consistent visuals and clear messaging are 3-4 times more likely to stand out and be recognized.
Partnering with a professional graphic design agency gives businesses access to standardized workflows, reusable visual systems, and design expertise that scales across channels.
How much does graphic design cost in the United States?
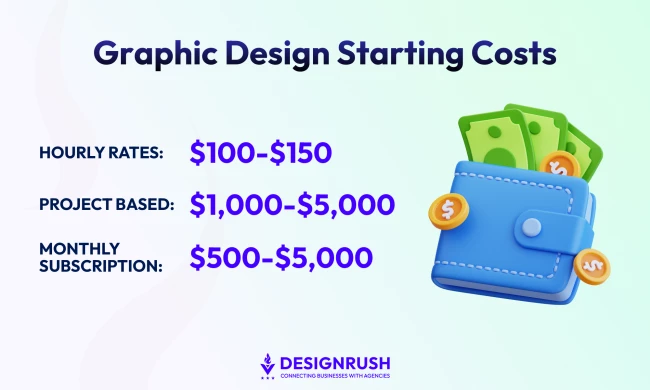
The cost of graphic design services in the United States starts at around $100-$150+ per hour or $1,000-$5,000 per project, depending on service scope, complexity, turnaround time, and designer experience level.
For instance, a basic branding package will cost approximately $5,000 to $25,000 and includes logos, colors, typography, and guidelines.
Conversely, a full branding package can range from $20,000 to $100,000+, including logo, visual identity, market research, brand strategy, and brand campaign materials.
Web design, on the other hand, can cost between $5,000 and $30,000 for a custom design and $50,000 to $200,000 for an enterprise build.
Additionally, graphic design companies charge an hourly rate of $100-$150 for package design and a project rate of $1,000-$50,000, depending on design complexity.
Beyond hourly and project-based pricing, some US graphic companies offer a subscription-based pricing model, where they charge a regular monthly retainer rate for a set of graphic design services.
Typical subscriber-based design services cost $500-$5,000+ per month, depending on service tier and agency expertise.
How long does it take a design agency to complete a project?
Graphic design timelines depend on project scope, deliverables, and feedback speed. Our research shows that most US projects follow clear, predictable time ranges based on standard process phases.
Average timeline ranges
- Simple assets (logos, social graphics): 2-5 days
- Branding packages and multi-page collateral: 2-6 weeks
- Large or complex projects: 6+ weeks, especially if multiple deliverables, strategic discovery, or extensive review cycles are required.
Breakdown of phase durations
Here are the approximate timelines you can expect for each phase of a standard design workflow:
- Research and discovery: ~2-7 days
- Ideation and concept development: ~2-5 days
- Design and refinement: ~5-10 days
- Feedback and revisions: ~2-7 days, depending on stakeholder speed
- Final delivery: ~1-3 days
How to choose the best US graphic design agency for your brand?
Making the right choice involves evaluating each company's process, expertise, communication style, and ability to deliver work that aligns with your brand's goals.
1. Define your goals and requirements
Clarify deliverables, timelines, and budget upfront, as clear scopes greatly reduce revisions and speed up delivery.
2. Shortlist agencies with relevant expertise
Use service categories and portfolios to identify agencies that specialize in the kind of design work your project requires.
3. Evaluate portfolios strategically
Look for scalable identity systems and consistent multi-channel execution, as recommended in industry best-practice agency selection frameworks.
4. Examine verified client reviews and credibility signals
Check verified reviews to evaluate an agency's reliability and communication.
5. Send a detailed RFP to avoid scope creep
Minimize scope creep by defining deliverables, acceptance criteria, target users, and workflows clearly in your RFP.
6. Assess each agency's onboarding and workflow
Prioritize teams with structured onboarding, which improves alignment and reduces delays.
7. Schedule discovery calls to test compatibility
Use discovery meetings to confirm strategic alignment, communication fit, and the experience level of the team you will work with.
8. Choose the partner that balances expertise, process, and value
Pick an agency with proven creative quality, efficient workflows, and reliable delivery. Those traits are critical for a successful design partnership.
How to find a US graphic design studio on DesignRush that fits your budget?
We've curated examples of top B2C and B2B graphic design agencies across different budget ranges so you can identify creative partners that align with your spending expectations.
| High budget: $50,000+ |
|
| Low budget: $25,000-$50,000 |
|
Beyond budget, the DesignRush agency directory lets you filter agencies by location, expertise, reviews, client types, team size, and hourly rates.
What questions should you ask before hiring a graphic design agency in the US?
To be sure you're aligned when evaluating a professional graphic design studio, you need to ask the right questions. Consider the asking following:
Relevant Background
- What recent design projects or case studies best reflect your capabilities? Can you walk us through the brief, approach, and final results?
- Which areas of graphic design do you specialize in: branding, digital design, packaging, or multi-channel campaigns?
- Do you have experience working with brands in our industry or with similar audiences? How does that experience translate to our needs?
Services and Processes
- How do you structure pricing: per project, hourly, or through monthly retainers?
- What is included in a typical design package, and how many revision rounds are standard?
- Can your workflows integrate smoothly with our existing brand guidelines, digital tools, or internal teams?
- What does your design and onboarding process look like from discovery to final delivery?
Related to Your Project
- How will you evaluate our brand goals and translate them into a clear design direction?
- What limitations, dependencies, or risks should we be aware of before starting the project?
- Who will be working on our project, and do they have experience with similar design work or brand categories?
- What is the estimated timeline based on our scope, and how do you manage deadlines or feedback cycles?
Sources
DesignRush sustains a directory of over 40,000 agencies categorized by service category, location, expertise, and reviews. We build our database in two ways:
- Our dedicated team of agency experts actively searches the web for top-performing companies. We then pull information from their websites, online presence, and client testimonials to verify their status and qualifications prior to listing.
- The agencies listed get notified of their profiles on the website and they can choose to claim it or not, which suggests their availability for more collaborations.
Agencies can also reach out to DesignRush and must go through the verification process prior to being listed.

Why companies trust DesignRush
Every agency is independently vetted before it can be listed or ranked
 4.8
 4.8
Some agencies pay for sponsored placement, clearly labeled and held to the same vetting standards.
Graphic Design Agency FAQs
What services do graphic design firms in the USA provide?
Analysis of service specializations most frequently tagged and searched within our US graphic design directory shows that agencies typically fall into four dominant service categories.
Many firms offer multiple capabilities but the distribution of service focus areas generally aligns with the following ranges:
- Brand identity and logo systems (~40-50%): This is the largest specialization segment and covers branding, logo design, visual identity systems, and brand guidelines.
- Digital and web design (~25-35%): This covers digital assets such as UI design, website visuals, digital ads, and social graphics.
- Print and marketing collaterals (~10-20%): These include brochures, pitch decks, posters, and other print or marketing materials, often as extensions of brand identity work.
- Packaging and product-related sesign (~5-10%): This includes packaging and product visuals for sectors such as retail, eCommerce, beauty, and food and beverage.
What kind of budgets do companies typically allocate for graphic design?
According to PiktoChart's survey, here's how much companies typically allocate for graphic design:
- 51% of companies allocate between $5,000 and over $10,000 annually, with the software industry having one of the highest budgets.
- 32% are budgeting $1,000-$5,000 annually for graphic design projects and tools.
- 17% spend below $1,000 annually on graphic design.
How long does it take to see ROI from a graphic design project?
ROI from graphic design usually unfolds in stages depending on the project's scope:
- Short term (1-3 months): Measurable improvements in engagement and visibility with refreshed logos, campaign graphics, or social creatives boosting click-throughs and impressions,
- Mid term (3-9 months): Updated brand visuals used across campaigns and channels with gains in conversion rates, lead quality, and audience recall.
- Long term (9-18+ months): Strategic design investments for sustained revenue growth, customer loyalty, and competitive differentiation.
What is the typical project timeline for US graphic design services?
Project timelines vary by scope, but most US graphic design work falls within these standard ranges:
- Simple assets (logos, social graphics): 2-5 days
- Mid-range projects (branding packages, multi-page collateral): 2-6 weeks
- Large or complex projects: 6+ weeks, especially when strategy, multiple deliverables, or extensive reviews are required
You can think of timelines in phases, with approximate durations for each stage of a standard graphic design project:
- Research and discovery: ~2-7 days
- Ideation and concept development: ~2-5 days
- Design and refinement: ~5-10 days, depending on complexity
- Feedback and revisions: ~2-7 days, affected by stakeholder speed
- Final delivery: ~1-3 days for packaging and exporting files
What industries employ graphic designers in the US?
Below are the top industries that employ graphic designers in the US based on industry research:
- Specialized design services: 23.6%
- Advertising, public relations, and related services: 8.86%
- Printing and related support activities: 7.89%
- Education: 5.48%
- Management, scientific, and technical consulting services: 4.13%
- Computer systems design: 4%
- Manufacturing: 2.52%
- Religious organizations: 1.93%
- Architectural, engineering, and related services: 1.86%
- Civic, social, and advocacy organizations: 1.6%
The data indicates demand for graphic designers spans many industries across the US economy.
Latest Trends Related to Graphic Design