Streams, swipes, transactions, and sensor logs are now generating data nonstop. That volume is big enough to shape budgets, infrastructure decisions, and competitive advantage.
How Much Data Is Created Every Day: Key Findings
- Video dominates the consumer datasphere, accounting for ~76% of mobile traffic, with social and gaming increasingly behaving like video workloads.
- IoT and enterprise systems may look small in public traffic charts, but they generate TB/day at sites.
- Keeping, governing, and securing data is a growing challenge as storage lags creation and exposure to breaches grows through third parties.
Quantifying The Amount of Data Created Daily
As we reveal how much data is being generated each day in 2026, we also look at the far-reaching implications for industries, infrastructure, and the future of information management.
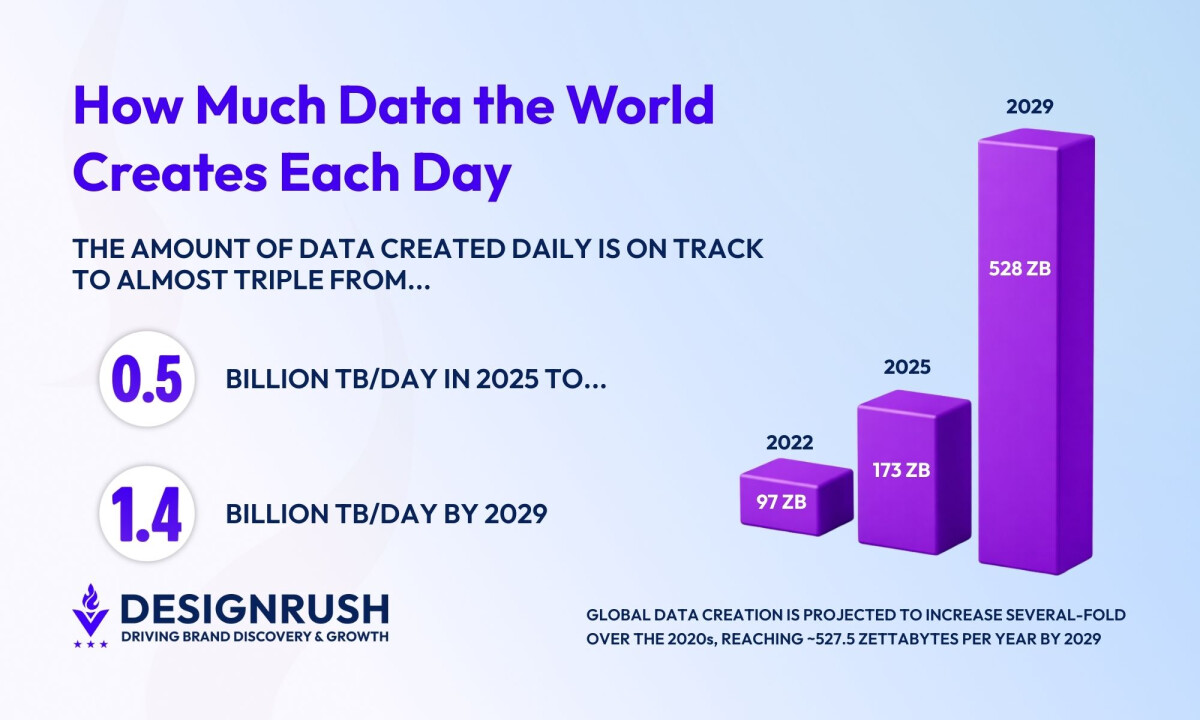
It's estimated that 173.4 ZB (zettabytes) of data (that’s one billion terabytes) were created in 2025, and we're on track for 230–240 ZB in 2026.
By 2029, that number is expected to reach 527.5 ZB, about a 3.0× increase.
Using those figures, you can translate the scale into daily averages:
- 2025: 173 ZB/year ≈ 0.474 ZB/day ≈ ~474 million TB/day
- 2028: 394 ZB/year ≈ 1.08 ZB/day ≈ ~1.08 billion TB/day
- 2029: 527 ZB/year ≈ 1.44 ZB/day ≈ ~1.44 billion TB/day
The world is already operating at “hundreds of millions of terabytes per day,” and the next few years push that into “over a billion terabytes per day.”
The rise of the “zettabyte era” has been rapid, and the pace is accelerating exponentially. Consider that the world generated less than one ZB per year roughly 20 years ago, reaching 2 ZB per year only in 2010.
Types of Data Driving This Growth
Data doesn’t grow in one uniform curve. Consumer activity is dominated by a few heavy file types (especially video) while enterprise and industrial systems produce a wider mix of continuous streams.
That’s why we separate consumer and non-consumer data below, since they scale differently and require different storage, governance, and analytics choices.
Consumer Data: Streaming, Sharing, and Play at Scale
The average user consumes more data every year. Yet only about 10% of this data is “new” information, i.e. unique data that’s newly created or captured, as former IDC senior vice president, David Reinsel, explains.
The growth of the datasphere is driven mostly by the “data we consume and analyze”, he says, with the recursion rate (the rate at which the same data is reprocessed) growing exponentially.
Note that consumer data growth isn’t uniform globally. Mobile is a useful lens because it captures always-on usage at the per-device level, and Ericsson’s latest Mobility Report puts average smartphone traffic at 21 GB/month (2025), ranging from the low-20s to mid-30s GB/month depending on region:
The formats that account for the heaviest amount of consumer data usage include:
1. Video: ~76% of Mobile Traffic
Video is unsurprisingly the largest application category by volume, with video traffic now making up about 76% of mobile traffic.
AppLogic Networks’ 2025 Global Internet Phenomena Report found that:
- Users download an average of 5.6GB of video content per day
- YouTube alone accounts for more than 10% of global internet bandwidth.
- Days with the heaviest traffic coincided with a live streaming sporting events, with peaks 30-40% above normal usage.
2. Social: ~18% of Fixed Downstream
Social platforms now behave like streaming platforms, dominated by short‑form video, live video, and richer creative formats.
Sandvine (now AppLogic Networks) reported in 2024 that:
- Social media accounts for ~18% of downstream traffic (≈2.6 GB per subscriber per day)
- Messaging accounts for ~0.6% of downstream traffic (≈81 MB per subscriber per day)
- Messaging contributes a further ~1% upstream traffic (≈17 MB per subscriber per day)
3. Gaming: 3% of Fixed Downstream
Gaming data growth isn’t only gameplay telemetry. It’s also massive downloads, frequent patches, live service events, and cloud/remote play trends.
Sandvine put gameplay at 3% (398 MB per day) of fixed downstream volume and 6% (157 MB per day) of mobile downstream volume.
However, cloud/remote play gets heavy fast. Sandvine’s report notes that “high-end” cloud-gaming session at 50 Mbps can hit ~22 GB per hour (and Xbox Cloud Gaming users can reportedly average 4.1 GB a day).
Enterprise and Industrial Data: Systems, Sensors, and Operations
Unlike consumer traffic, enterprise and industrial data mixes high-frequency telemetry and transactions with heavy modalities (machine vision, medical/scientific files).
Much of it is generated and processed inside private networks or at the edge (filtering, replication, analytics), so public-Internet traffic shares can understate its storage/compute footprint.
@levi.dev__ Edge Computing Explained 💯 #edgecomputing#softwaredeveloper#levidev♬ original sound - Levi Okoye
Data-heavy commercial sectors include:
- Industrial operations: ~80 TB/Day Factories
- Healthcare: MRI Is ~500 MB to 1 GB
- Retail: ~2.5 PB/Hour (~60 PB/Day) at Walmart-Scale
1. Industrial Operations: ~80 TB/Day Factories
Industrial operations are data‑heavy because the work itself generates data nonstop. Sensors and control systems stream telemetry 24/7, and automation and robotics add logs, system states, and performance metrics that need near‑real‑time analysis.
The proliferation of data from IoT devices alone is extraordinary:
- IoT Analytics predicted 21.1 billion connected IoT devices by end of 2025 (+14% YoY), trending toward 39 billion by 2030.
- The sensors on a single offshore oil and gas platform, for example, can generate between 1TB and 2TB of data per day.
At a modern factory scale, data volumes can reach tens of petabytes over just a couple of years. Seagate says its factories generated 50.5 PB of data from July 2023 to March 2025, which is about 80 TB per day on average.
A major driver is machine vision, as in this case Seagate reports inspecting up to 3 million images daily for defect detection.
2. Healthcare: MRI Is ~500 MB to 1 GB
Healthcare generates heavy data per patient because core modalities are inherently file-intensive. For example, a 2024 review notes that a single MRI study normally produces ~500 MB to 1 GB of data.
Over time, those file sizes compound quickly. Most providers aren’t storing one scan, but a patient’s full history across multiple imaging types, repeat studies, and related records that often need to be retained (securely) for years.
3. Retail: ~2.5 PB/Hour (~60 PB/Day) at Walmart-Scale
At a mega-retailer scale, data volumes can reach tens of petabytes per day. Walmart collects about 2.5 PB of unstructured data per hour from roughly 1 million customers (about ~60 PB per day).
This illustrates how quickly omnichannel signals (purchases, web/app activity, and related customer interactions) can compound into very large data pipelines.
Building a Practical Data Readiness Plan
A huge volume of data is only useful if you can turn it into better decisions, faster execution, and safer operations. That requires planning for:
- Cost
- Retention
- Governance
- Risk
John Rydning, research VP, IDC‘s Global DataSphere, notes that the Global StorageSphere is steadily growing, but at a slower annual growth rate than that of the global datasphere, meaning we are saving less of the data we create each year.
He says organizations should be preparing now to store more data in the future and exploring innovative analytics initiatives to achieve digital transformation milestones and improve metrics.
Here’s a practical playbook business owners and agency leaders can use:
- Forecast your data bill the way you forecast payroll: Model growth in storage, compute, and bandwidth (especially if you operate media-rich experiences, AI workflows, or high-traffic SaaS products).
- Design lifecycle rules before you buy more storage: Define what’s hot, warm, cold, and disposable. Most orgs wouldn’t have a storage problem if they resolved their data retention discipline first.
- Make AI-ready data a governance project, not a side quest: AI-related incidents often occur because of a lack of proper AI controls. If teams are experimenting with copilots, agents, or “shadow AI,” lock down access, logging, and policy now.
- Treat third parties as part of your attack surface: Vendors, plugins, and integrations expand risk as quickly as they expand capability. Verizon reports third-party involvement in breaches doubled to 30%, and exploitation of vulnerabilities surged by 34%.
- Invest in what makes analytics work: Data quality, observability, and clear ownership are what keep dashboards, attribution models, and AI outputs credible.
- Build your data setup around how you actually use it: Decide between real-time vs. scheduled processing, centralized vs. edge, warehouse vs. lakehouse, and choose the option that best fits your speed needs, compliance requirements, and budget.
How Much Data Is Created Every Day: Final Words
The headline numbers are staggering, but the real business edge comes from focus: knowing which data creates value, governing it well, and building pipelines that let teams act on it quickly and safely, even as global volumes push toward a billion‑terabyte‑per‑day world.

Why not get the support you need from experts in big data analytics and future-proof your business?
Alternatively, look into our Agency Directory for the top partners in different categories to usher in significant growth:
- Top BPO Companies
- Top IT Services Companies
- Top Data Science Companies
- Top AI Companies
- Top Cloud Consulting Companies
How Much Data Is Created Every Day FAQs
1. How does AI impact global data creation?
AI plays a dual role in the data surge: it both consumes massive datasets for training and inference, and generates new data in the form of logs, predictions, model outputs, and increasingly, synthetic content (text, images, video).
This creates a feedback loop where AI accelerates the volume and complexity of data being generated.
2. What role does edge computing play in managing daily data generation?
Edge computing allows data to be processed closer to its source (on devices or local nodes) reducing latency, minimizing bandwidth strain, and enabling real-time analytics.
As IoT and streaming sensors proliferate, edge computing becomes essential for handling time-sensitive data and preventing bottlenecks in centralized systems.