We’ll break down the latest product design statistics that agencies and design leaders can use to increase conversions and tie UX improvements directly to revenue outcomes.
Product Design Statistics: Key Findings
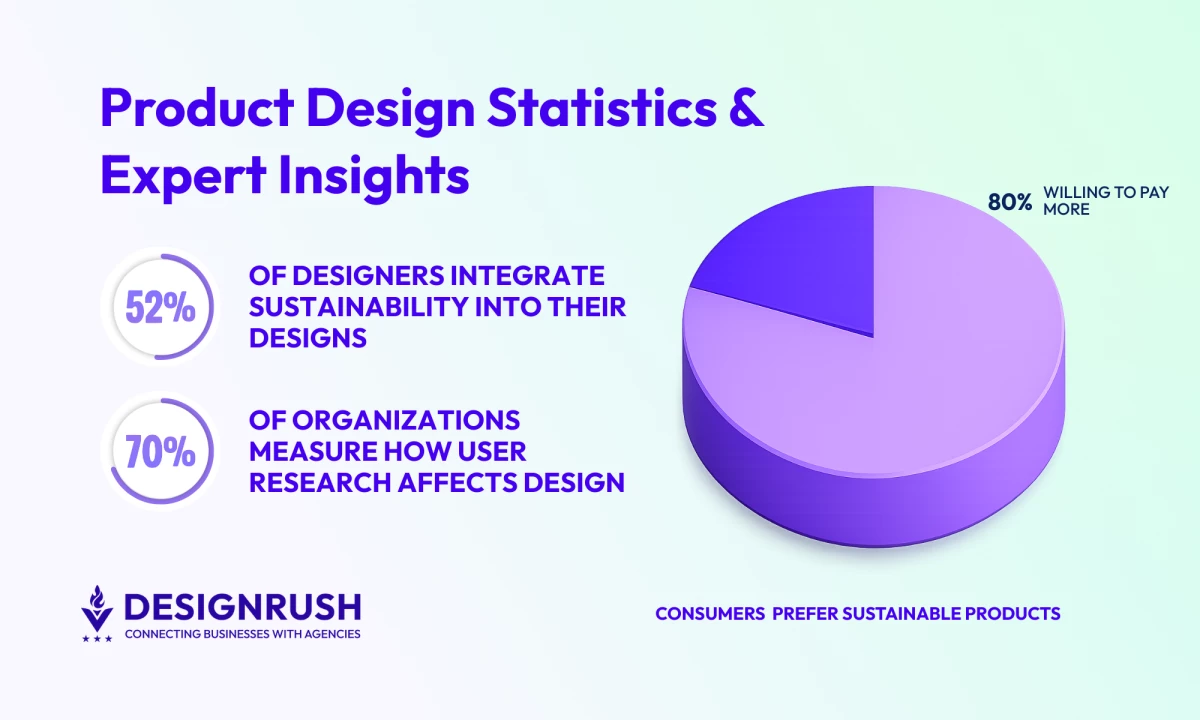
- Over half of designers integrate sustainability (52%), while inclusive design boosts usability by up to 30%.
- 80% of consumers would pay more for sustainable products.
- Duolingo’s gamification drove a 40% increase in seven-day retention.
Product Design Stats: An Overview
Business leaders expect data to justify every UX investment. For agencies and product teams, that means proving design decisions with hard metrics and strategic benchmarks.
Business Impact of Product Design
Today’s business leaders don’t invest in design for aesthetics alone; they expect clear proof of business impact.
Product design has become a revenue driver, retention tool, and competitive advantage. These stats show how top-performing companies use design to win:
- Design-led companies grow faster and perform better
- Poor UX costs you customers
- UX improvements deliver huge conversion gains
Design-Led Companies Grow Faster and Perform Better
Multiple studies confirm what product leaders already know: companies that lead with design consistently outperform the market.
Here are some key stats that prove this:
- McKinsey tracked 300 companies and found that those with top design scores achieved 32% faster revenue growth and 56% higher total returns to shareholders compared to typical companies.
- Design-centered companies outperformed the S&P 500 by 228% over 10 years, as per Baymard Institute.
- 84% percent of companies that improve customer experience see an increase in revenue (Forbes).
- Netflix’s focus on personalized UX keeps its user churn as low as 2.4% — an enviable retention metric in the SaaS world (AlmaBetter).
- Duolingo famously gamified their app and saw a 40% increase in seven-day retention for new learners.
What these stats mean for your business:
- Build design-led roadmaps: Align design goals with business KPIs like revenue, churn reduction, and customer lifetime value.
- Consult organizational change: Help clients integrate design into product, marketing, and leadership workflows (e.g., design ops, design thinking workshops).
Poor UX Costs You Customers
@joelledesigner The easiest way to improve your UX thinking is to start noticing the little details in digital (and non digital) experiences ✨ New seriess ✨ From the convos I have with junior designers and portfolios I look at, it's clear that a HUGE thing is missing 😮💨 The **rationale** behind your design decisions It's key to influencing stakeholders, designing a finally impactful products for your users When you know WHY you're doing it. The more you start thinking critically about product design, the more it becomes second nature. So that's why I started Good UX, Bad UX. The series where I break down designs and what makes them good and bad to help you understand design DEEPER than what Instagram UI posts make it out to be 🔦 Today we're spotlighting Yonder @Lyft I'm here to help you thrive as a designer, not just survive ~~ 😉✨ Was this helpful? Let me know if there are any apps / products I should feature! 🔖 Save for later! #uxui#uxdesigner#productdesigner#productdesign#uxdesign♬ Trust issues the weekend - 🗿
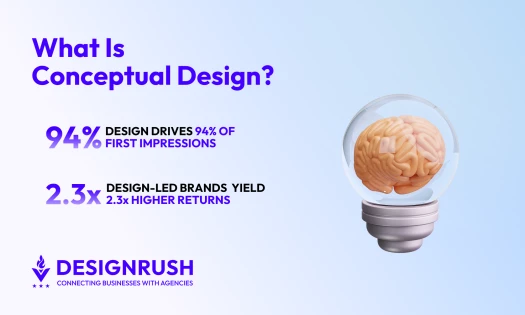
94% of first impressions are shaped by design, meaning poor UX drives users away before your product gets a chance. From weak first impressions to failed conversions, bad design quickly erodes customer trust and engagement.
Here are some numbers that show why product design really matters:
- Bad design is expensive — 88% of online consumers won’t return to a site after a bad UX (Sweor).
- Industry data shows that 52% might not return due to ugly aesthetics (UXCam).
- 25% of mobile apps are used only once and then abandoned, often due to poor first-time UX (Statista).
Put these into action with the following strategies:
- Run first impressions audits: Assess visual design, messaging clarity, and trust signals.
- Optimize mobile UX: Simplify navigation, optimize tap targets, and improve mobile page load speeds.
- Fix conversion blockers: Prioritize common UX friction points like form complexity, unclear CTAs, and broken interactions.
UX Improvements Deliver Huge Conversion Gains
Better UX directly improves conversions and reduces customer churn. The ROI is clear and often exponential.
Here are key stats you should know:
- Forrester reports that well-designed user interfaces can boost conversion rates by up to 400%.
- Boosting UX budgets by 10% drives 83% higher conversions, according to the Interaction Design Foundation.
- Nielsen Norman Group reports that enhancing usability can increase conversion rates by 200%.
- A SaaS product’s app (JobNimbus) rating jumped from 2.5 to 4.8 stars after a UX redesign.
In fact, even just small improvements can yield big results:
- Bain & Company notes that improving UX to increase customer retention by just 5% can lift profits by 25% or more.
- Changing a CTA button’s color or placement yielded a 21% higher click-through in one test (Unbounce).
- Adobe’s research found that consistent, responsive design across devices can increase engagement by 20%.
What these stats mean for your business:
- Implement data-backed A/B testing: Run iterative design experiments on critical conversion flows (e.g., signup, checkout).
- Prioritize high-impact changes first: Focus initial UX efforts on top traffic or revenue-generating pages.
- Build UX-optimized templates: Create scalable, optimized design templates for forms, onboarding flows, and landing pages.
Product Design: Workflows and Processes
Behind every standout product is a rigorous, iterative process. Research, prototyping, and feedback loops separate market leaders from failed launches:
- Research and iteration lead to success
- Brainstorming and balance spark creativity
- Many companies are flying blind without UX testing
- Benchmarks show usability gaps you can fix
Research and Iteration Lead to Success
Successful teams don't guess; they test. Thorough research and iteration drive lower failure rates and higher product-market fit.
Here are supporting statistics:
- 85% of successful design projects start with a thorough research phase (HootSuite).
- Products with 3+ prototype iterations are 50% less likely to fail (HootSuite).
- 77% of designers value the feedback stage most, as per UserTesting’s annual CX Industry Report.
- 73% of organizations track the impact of user research on design decisions, as per Maze’s Future of User Research Report.
What these stats mean for your business:
- Build discovery phases into every project scope: Start with research and stakeholder alignment to define user needs, avoiding costly changes later.
- Use prototypes to validate flows before committing to full builds: Test key user journeys with prototypes early to catch issues before development.
- Prioritize feedback cycles with both users and stakeholders: Gather ongoing input from users and teams to keep designs aligned and catch problems early, reducing rework.
Brainstorming and Balance Spark Creativity
Creativity thrives on structured brainstorming and strong design principles. Teams that prioritize creative exploration produce more original, balanced products.
According to statistics compiled by Linearity:
- 73% of teams spend over 4 hours brainstorming per project.
- Using varied brainstorming methods generates 40% more unique ideas.
- 87% of designers call balance the #1 design principle.
- Repetition and unity in design increase brand recognition by 68% and trust by 55%.
Here’s how to boost your creative design process:
- Use multiple brainstorming formats: Combine individual ideation (e.g., brainwriting) with group sessions (e.g., whiteboarding, mind mapping).
- Facilitate creative workshops: Bring clients into ideation sessions to align on vision early.
- Apply brand systems consistently: Create design systems and brand guides that enforce visual harmony and recognition.
Many Companies Are Flying Blind Without UX Testing
Despite UX’s clear ROI, most companies underinvest in testing and leadership. This creates a major gap — and an opportunity for agencies.
Here are key stats to know:
- 43% lack processes to base design decisions on user feedback (Medium).
- Only 13% of companies have a UX leader at the C-suite level (ZDNET).
- 45% of companies conduct no UX testing at all (Econsultancy).
Tips to strengthen UX maturity:
- Train client teams: Upskill client teams on how to analyze UX data and act on findings.
- Recommend UX ownership: Encourage clients to appoint an internal UX lead or establish a UX task force.
Benchmarks Show Usability Gaps You Can Fix
Agencies fluent in usability data are 69% more likely to exceed their business goals, according to Adobe. When you frame issues with real benchmarks, you build a stronger case for redesigning.
Consider these key usability statistics from Eleken:
- Task success rates average 78%; If a client’s product has a 60% task success rate, you can propose a usability overhaul.
- A high error rate indicates a confusing UI. Research shows that even in user tests, only ~10% of tasks are completed with zero errors, and the average is about 0.7 errors per task.
What this means for agencies:
- Benchmark client UX: Compare your client’s task success rates, error rates, and time on task against industry norms.
- Run gap analyses: Identify where user flows deviate from expected performance and propose specific fixes.
- Visualize the problem: Use heatmaps and journey maps to help clients see exactly where users struggle.
Tiffany Chin, Head of Design at Wayfound, emphasizes:
"Incorporating data-driven insights into the design process is crucial for creating effective user-facing products."
Trends: Sustainability, Inclusivity, & Tech Innovation
Here's a speculative tech stack for 2025:
— UI/UX Savior (@UiSavior) December 17, 2024
**UI Design:**
- **Figma**: Continued dominance for collaborative design, with AI-enhanced features for predictive design elements.
- **Adobe XD**: Enhanced with more AI-driven design tools for user personalization and adaptive…
The future of product design lies in creating solutions that are not only effective but also sustainable, inclusive, and enhanced by intelligent technology.
- Thoughtful design reduces environmental impact
- Accessibility and inclusion lead modern design
- Designers embrace tech to work smarter
Thoughtful Design Reduces Environmental Impact
Design has a massive influence on environmental impact. In fact, decisions made during the design phase influence up to 80% of the product’s total lifecycle emissions (McKinsey & Company).
Here are crucial statistics you should know:
- Modular design extends product life by 50%+ (Cambridge).
- 52% of designers have been integrating sustainability into their work (Zipdo).
- 90% of environmental impact happens before the product is even built (Glimpact).
- 80% of consumers would pay more for sustainable products (PWC).
Key ways to build sustainability into your design:
- Integrate sustainability into your design narrative: Optimize for lightweight design, dark mode energy savings, and product longevity.
- Propose modular features: Recommend design solutions that allow components to be updated or replaced without full rebuilds.
- Audit production waste: Look for redundant features, oversized images, and inefficient parts that increase manufacturing demand or server loads.
Accessibility and Inclusion Lead Modern Design
In 2024, U.S. companies experienced a rise in ADA-related digital lawsuits, prompting brands to invest in UX that is accessible to everyone. Today, accessibility is required by law and expected by users alike.
Key stats highlight this shift:
- In North America, 62% of companies report a top-down commitment to digital accessibility initiatives (Forrester).
- Inclusive design can increase overall usability by up to 30% for all users (Microsoft).
Here’s how to design more inclusively:
- Co-design with real users: Include people with disabilities in your design feedback loops.
- Create inclusive content guidelines: Ensure that text, images, and interactions are inclusive of diverse users and languages.
Jake Davis, Design Director at Pocket App Ltd, highlights the importance of this approach:
"To effectively incorporate these trends, brands should adopt a user-centric design approach. Prioritizing user needs and preferences is crucial, as is regular user testing and feedback integration to refine and optimize the app."
Designers Embrace Tech to Work Smarter
The modern design stack is collaborative, AI-driven, and optimized for speed. Agencies that fail to embrace these innovations risk falling behind the competition.
Consider these insights:
- 90% of designers say tech influences trends (HootSuite).
- AI tools saw 78% adoption in large firms (McKinsey & Company).
- Contrary Research notes that Figma is the primary UI design tool for 75% of product designers.
- Software firms typically invest ~20% of their development budget in UX design as a rule of thumb (Creative Online)
What these stats mean for your business:
- Integrate AI-powered tools: Use AI for content generation (e.g., UI copy), asset generation, and layout suggestions.
- Position tech adoption as a value add: Show clients how your tech-enabled workflows save them time and money.
Product Design Statistics: Final Words
Product design is where strategy meets execution, and data bridges the gap. The difference between a good design and a great one could be a single statistic informing a creative tweak.
Use these data points to shift the conversation. Move beyond color palettes and layouts— focus on conversion rates and business impact.
It’s time to put these insights into action.
![]()
Our team ranks agencies worldwide to help you find a qualified partner. Visit our Agency Directory for the Top Product Design Companies, as well as:
- Top Product Prototype Companies
- Top UI/UX Design Agencies
- Top Design Agencies
- Top Digital Design Agencies
- Top Packaging Design Companies
And don’t miss our Awards section, where we celebrate the most innovative projects in design — from logo and app design to print and packaging.
Product Design Stats FAQs
1. What is a good task success rate in product design?
Aim for 70–90% task success. Usability studies show ~78% is typical. Well-optimized products can hit >90%, while complex beta products may start at 60–70%.
If you're below 70%, there’s likely major friction, so keep testing and improving. Simplify steps and clarify the UI to drive success rates higher.
2. Which industries invest the most in product design?
Tech (especially SaaS and Fintech), DTC/e-commerce, and healthcare lead in UX spending.
- Tech/Fintech: Compete on seamless UX and trust (e.g., one-click payments).
- DTC/eCommerce: Design impacts sales at every step, from discovery to checkout.
- Healthcare: Telehealth and wellness apps focus on making complex info accessible.
Others boosting UX spend include automotive (dashboards/apps), education (edtech), and retail banking.
3. What tools help track product design performance?
Most teams use a combination of these tools to track design performance and drive continuous improvements:
- Behavior analytics: Google Analytics 4, Adobe Analytics, Hotjar, Crazy Egg — track actions, heatmaps, and user behavior.
- Product analytics: Mixpanel, Amplitude, Heap — analyze user flows, retention, and feature use.
- User testing: UserTesting, Maze, Optimal Workshop — run usability tests and collect feedback.
- Monitoring & collaboration: A/B testing (e.g., Google Optimize), dashboards (Tableau, Data Studio), and project tools like Jira.