There’s no shortage of places to advertise, but few offer the volume, intent signals, and data clarity Google Ads provides.
With budgets under pressure and performance under the microscope, these Google Ads statistics reveal where the platform is still pulling its weight this 2026.
Google Ads Statistics: Key Points
- Google Search ads average a 6.66% CTR in 2025, with some verticals like Arts & Entertainment hitting 13.10%.
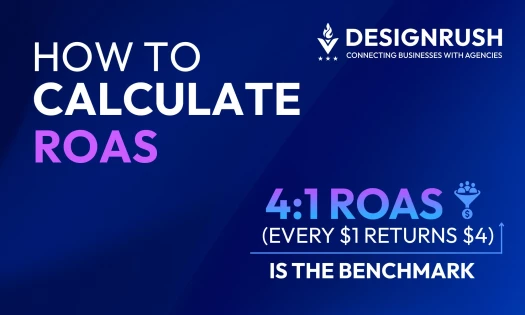
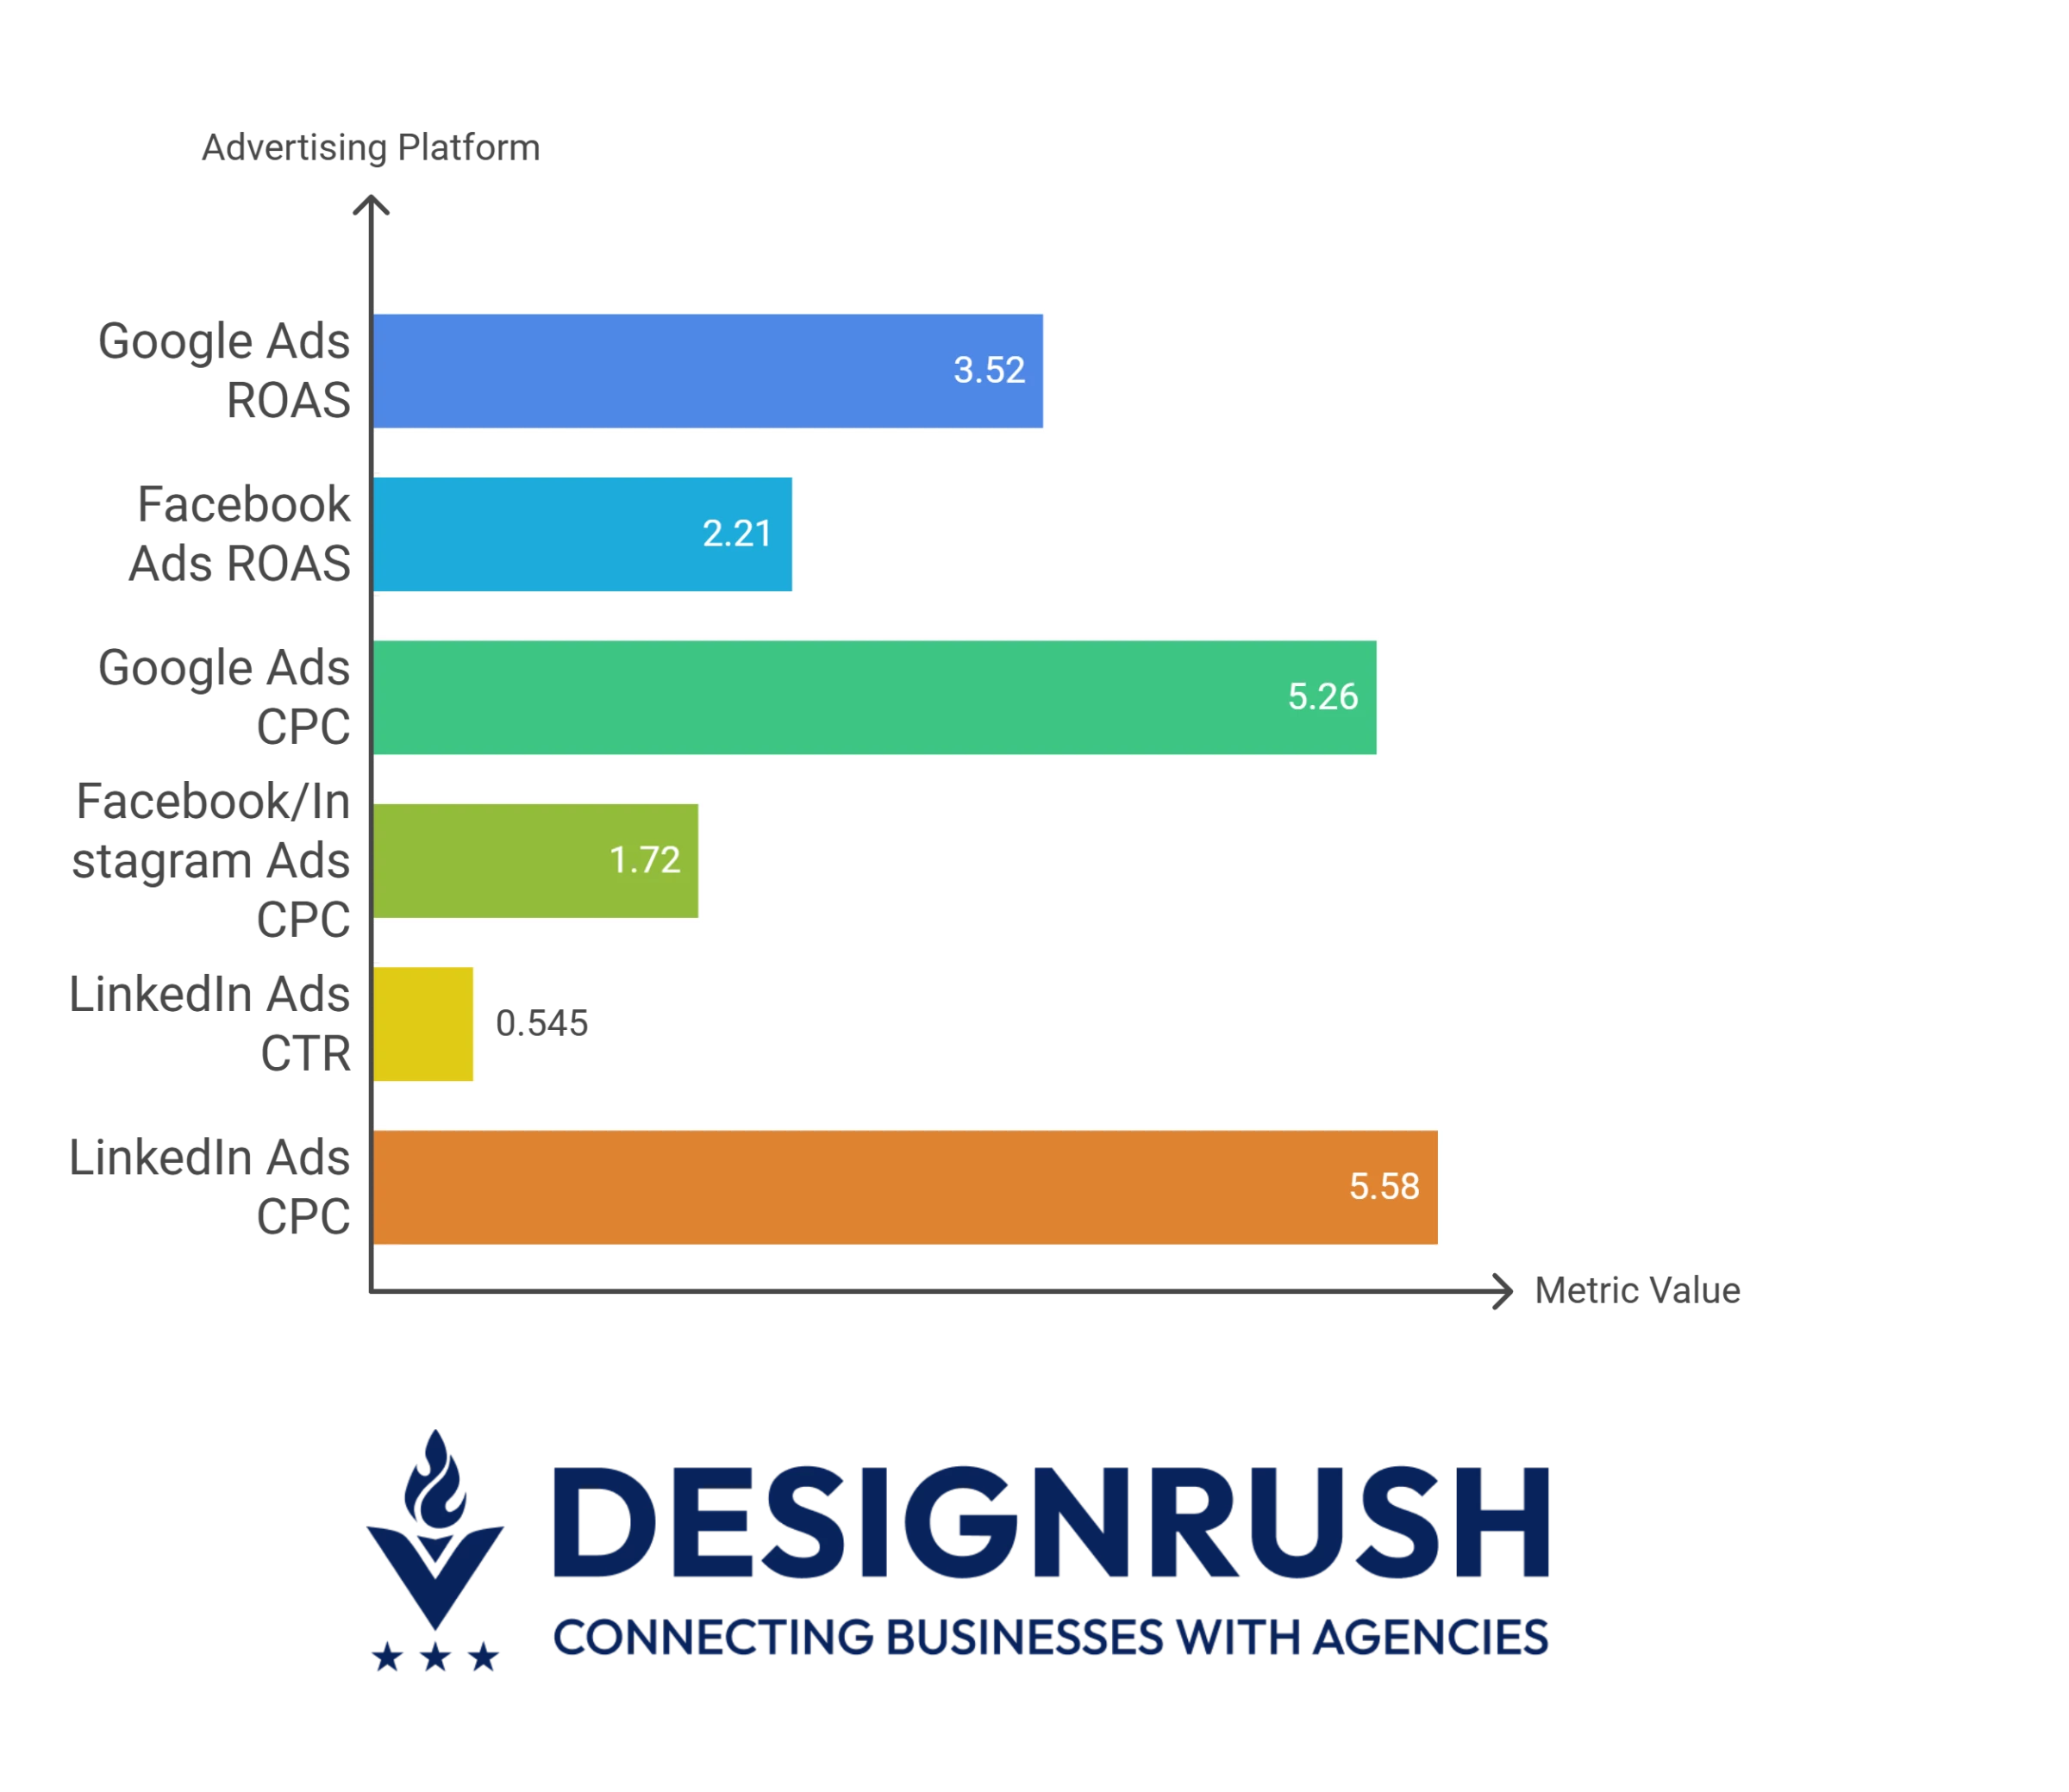
- Google Ads delivers a median ROAS of 3.52, outperforming Facebook (2.21) and justifying its higher CPC in high-intent sectors.
- Industries like Legaland Dental see CPCs above $7.85, but effective funnels can turn those into strong conversion returns.
Google Ads Revenue and Market Share Trends
Google Ads continues to dominate digital advertising, and these Google Ads stats prove just how far the platform has scaled:
- In the first three quarters of 2024, Google pulled in about $192.2 billion from ad sales.
- In Q4 2024, Google Services — which includes Search ads, YouTube ads, and Network ads — generated $84.1 billion, reflecting continued ad revenue momentum.
- In Q1 2025, Google Services revenue reached $77.3 billion, slightly lower than Q4 as expected post-holiday, but still reflecting 10% year-over-year growth.
These numbers confirm a consistent year-over-year growth trend for Google’s advertising arm, even amid seasonal fluctuations. For businesses, it signals two things:
One, the platform remains a key driver of ad performance and reach.
Two, competition and costs will likely keep rising.
If Google Ads is already part of your media mix, now’s the time to revisit bidding strategies, conversion efficiency, and budget pacing to stay competitive without overspending.
Business Spend on Google Ads by Industry
Not all industries spend or perform equally. These 2026 benchmarks will help you align your budget with performance expectations:
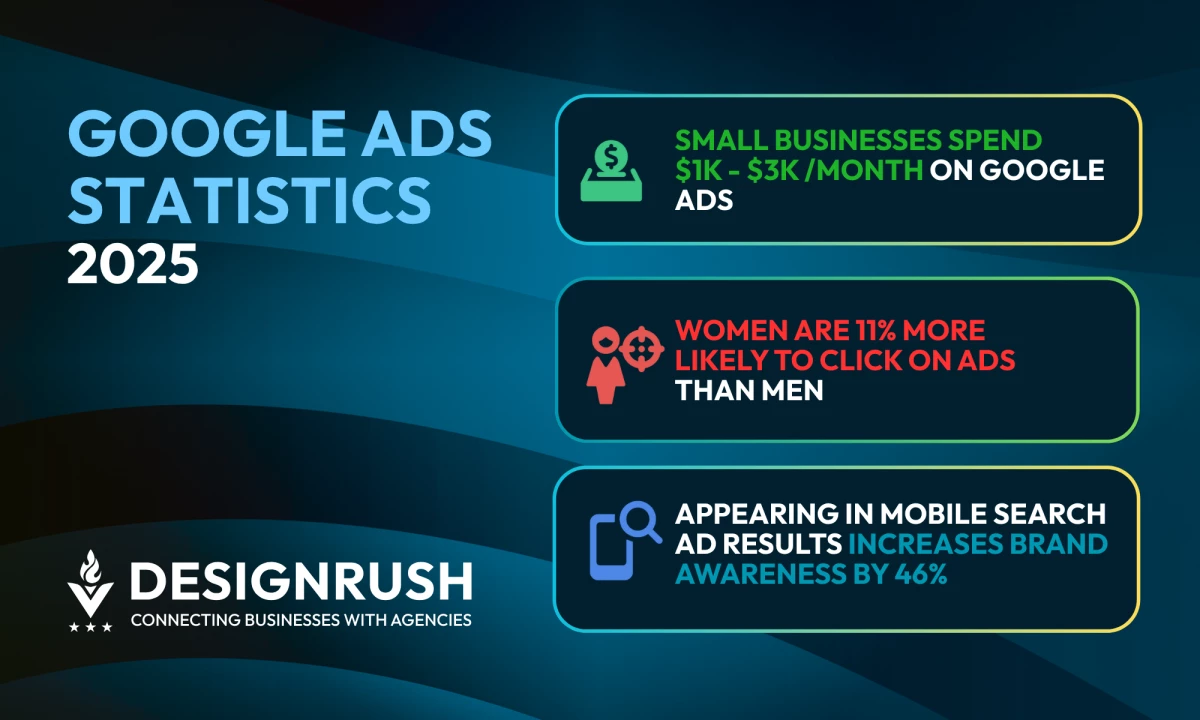
- Small businesses typically spend $1,000 – $3,000 per month on Google Ads.
- On the other hand, mid-sized and larger brands invest between $7,000 – $30,000 per month in it.
- Industry competitiveness is a key driver of Google Ads cost, with verticals like legal, accounting, and real estate paying higher average CPCs and CPLs due to greater demand and lower ad inventory.
Ad budgets tend to follow business size, but competition plays just as big a role. Some industries need more just to stay visible, especially in high-CPC sectors like legal or real estate.
If your space is competitive, expect higher costs. But bigger budgets only work if they’re tied to results. So, use these benchmarks to see if your investment level fits both your market and your objectives.
Google Ads Cost-Per-Click (CPC)
How much are businesses paying to get clicks, and what kind of return are they seeing?
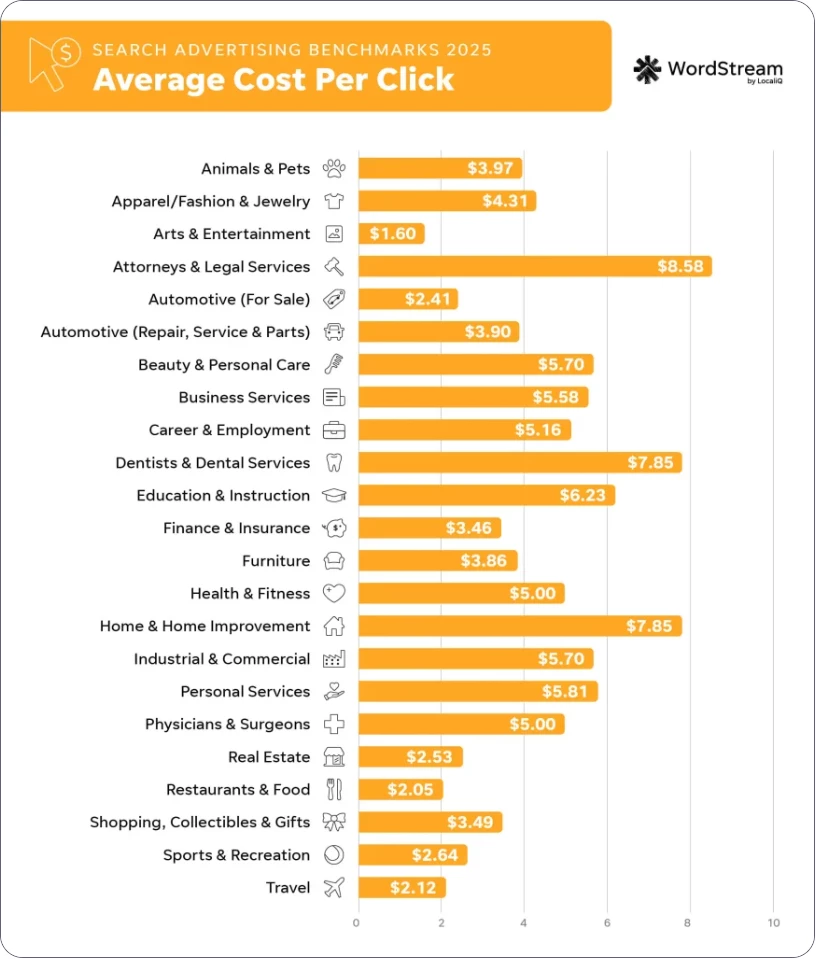
- Attorneys and legal services lead with an average CPC of $8.58, followed closely by dentists and dental services ($7.85) and education ($6.23).
These sectors have limited inventory and high customer value, which
drives up costs.
- Mid-range CPCs include business services ($5.58), SaaS and B2B verticals ($5.00–$5.81), and finance ($3.46).
These spaces are competitive, but strong ROAS can still be achieved
with efficient funnels.
- Arts & entertainment and travel have some of the lowest CPCs at $1.60 and $2.12, but they often need to reach higher volumes to generate the same revenue impact.
CPCs are highest in industries with limited ad space and high customer value. Sectors like travel or entertainment pay less per click but need more volume to see results.
It’s not just about what a click costs. What matters is how well that click converts. Strong funnels and relevant targeting make high CPCs worth it.
Average Click-Through Rate (CTR) Insights
Among the most telling Google advertising statistics, click-through rate reveals how well your ads are capturing attention.
But not all formats or platforms perform the same.
These benchmarks show what CTRs look like in 2026 across ad types, devices, and quality signals, so you can spot where your campaigns might be underperforming or outperforming expectations.
CTR by Ad Type
CTR benchmarks vary not just by industry but also by ad type:
1. Search Ads
The average CTR for Google Search ads is 6.66% across industries in 2025. Some verticals perform significantly higher.
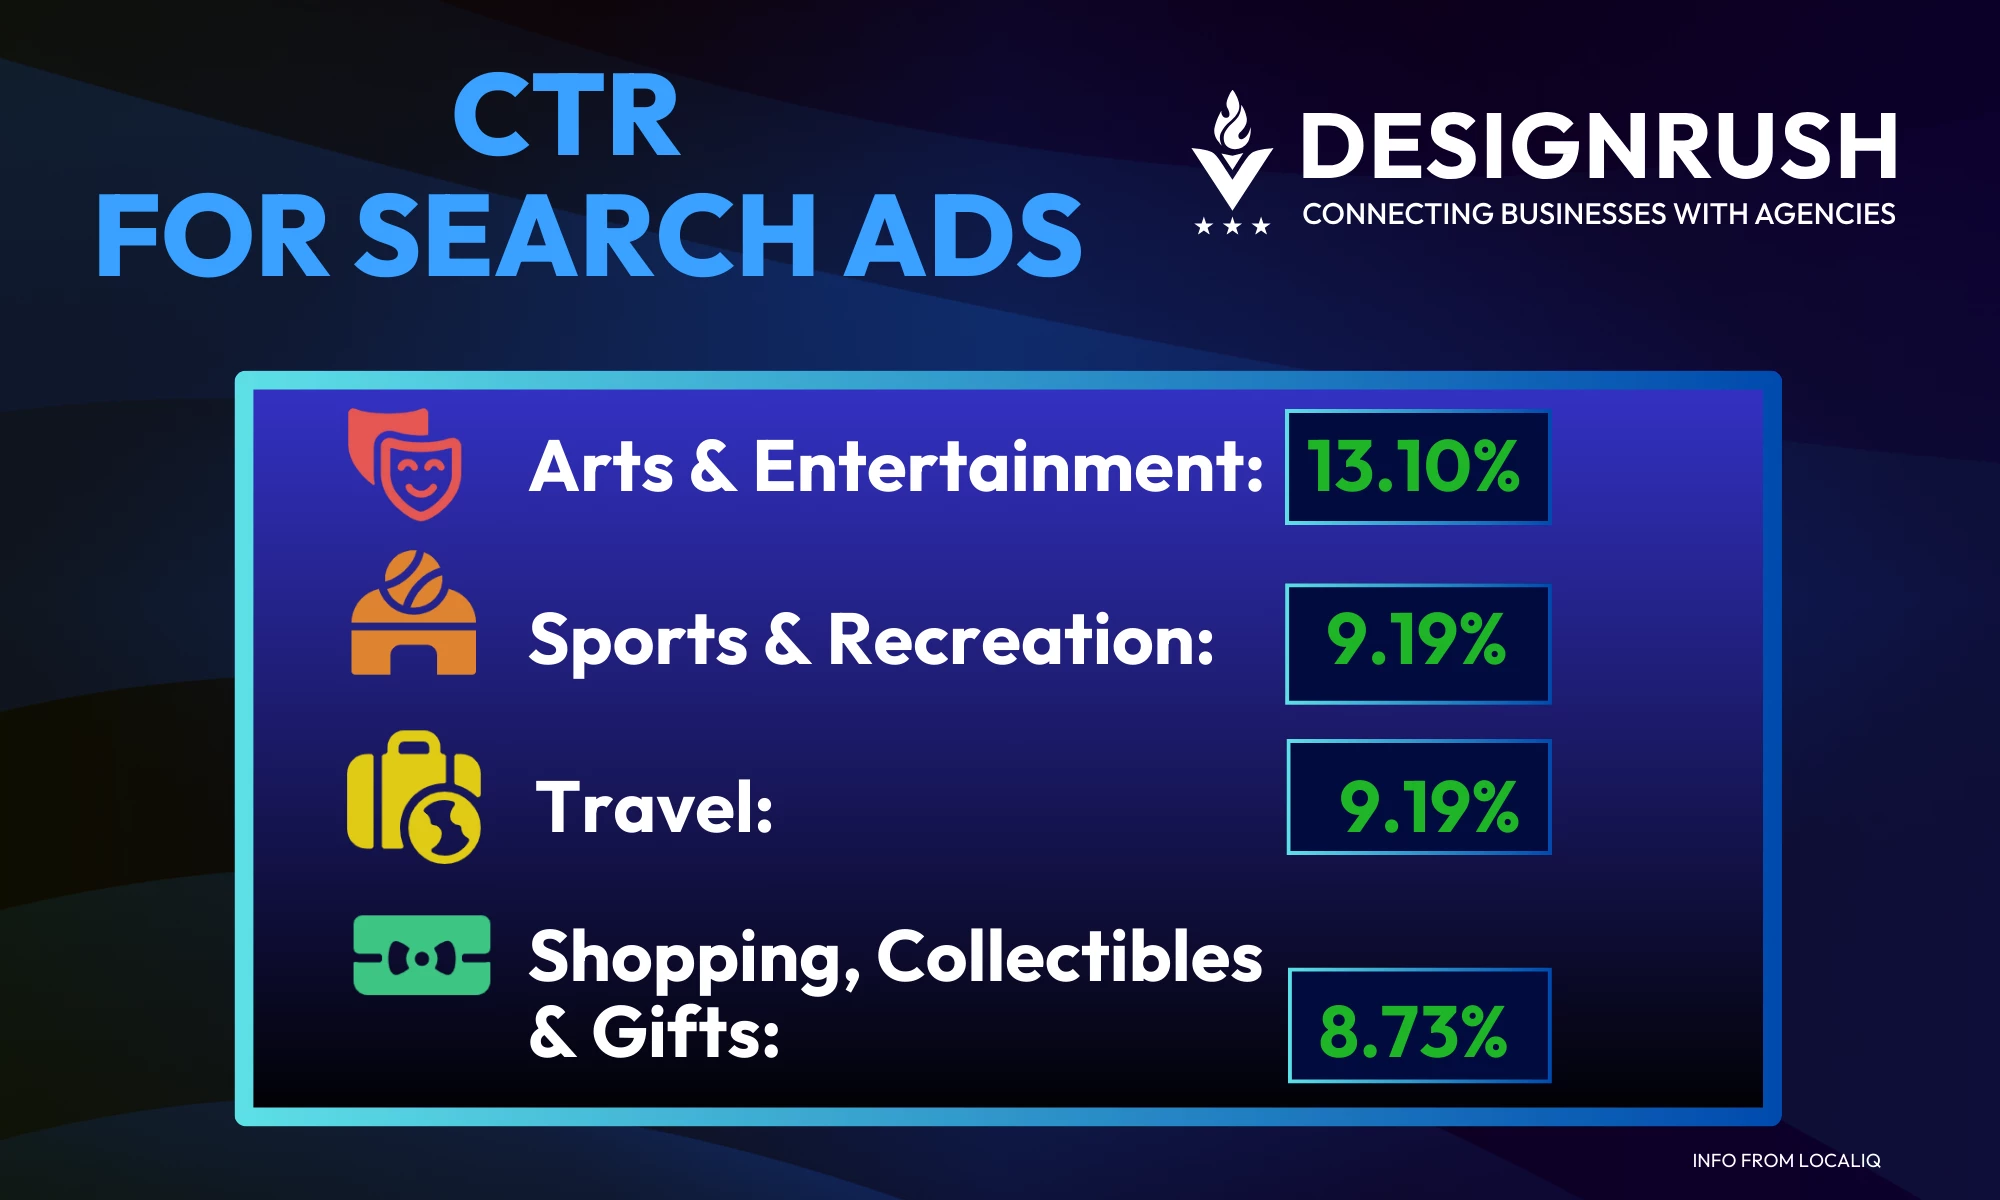
This shows just how much CTR can vary even within search, depending on the sector.
2. Display Ads
The average CTR for Google Display Ads is just 0.46%, underscoring its role as a visibility and reach play rather than a direct response channel.
However, performance varies by category. Real Estate sees up to 1.08%, while industries like Dating & Personals hover around 0.72%.
3. Shopping Ads
Google Shopping ads averaged a 0.86% CTR across industries in 2025.
Top-performing verticals included Automotive Supplies (1.20%), HVAC & Climate Control (1.12%), and Travel & Luggage.
CTR benchmarks show how much format impacts engagement. If your CTRs fall below these averages, it may be time to revisit your ad copy, targeting, or placements.
Aligning ad type with campaign goals is key to maximizing returns.
Behavioral & Demographic Trends Shaping Google Ads Targeting
User behavior is shifting across devices, platforms, and audience segments. To keep campaigns performing, you must align targeting strategies with how users browse, click, and convert today.
1. User Signals and Search Shifts
Long-tail queries, voice input, and consent-based tracking are changing how intent is captured and how ads need to respond.
- In early 2025, 71% of digital publishers said first-party data is now their primary source of positive ad performance.
This shows advertisers need to lean on owned data — Customer Match
lists, GA4 signals, enhanced conversions — to maintain targeting
precision and campaign effectiveness.
- Around 60% of U.S. Google searches now end without a click, with that number jumping to nearly 80% on mobile devices — driven in part by Google’s AI-powered overviews directly in the SERP.
- Approximately 91.8% of all Google search queries are long-tail keywords, meaning they contain specific, multi-word phrases and indicate high intent.
What do these numbers mean?
Buyers are using longer, more specific queries and often finding what they need without clicking. If you're still optimizing for old-school metrics, you’re missing intent signals.
Prioritize data you own, align ad copy to real search behavior, and build campaigns around clear conversion intent, not just impressions.
2. Audience Demographics
 Demographic targeting is a key driver of performance, but it’s most effective when paired with the right format and messaging.
These insights break down how gender, age, and household traits influence engagement and conversion on Google Ads.
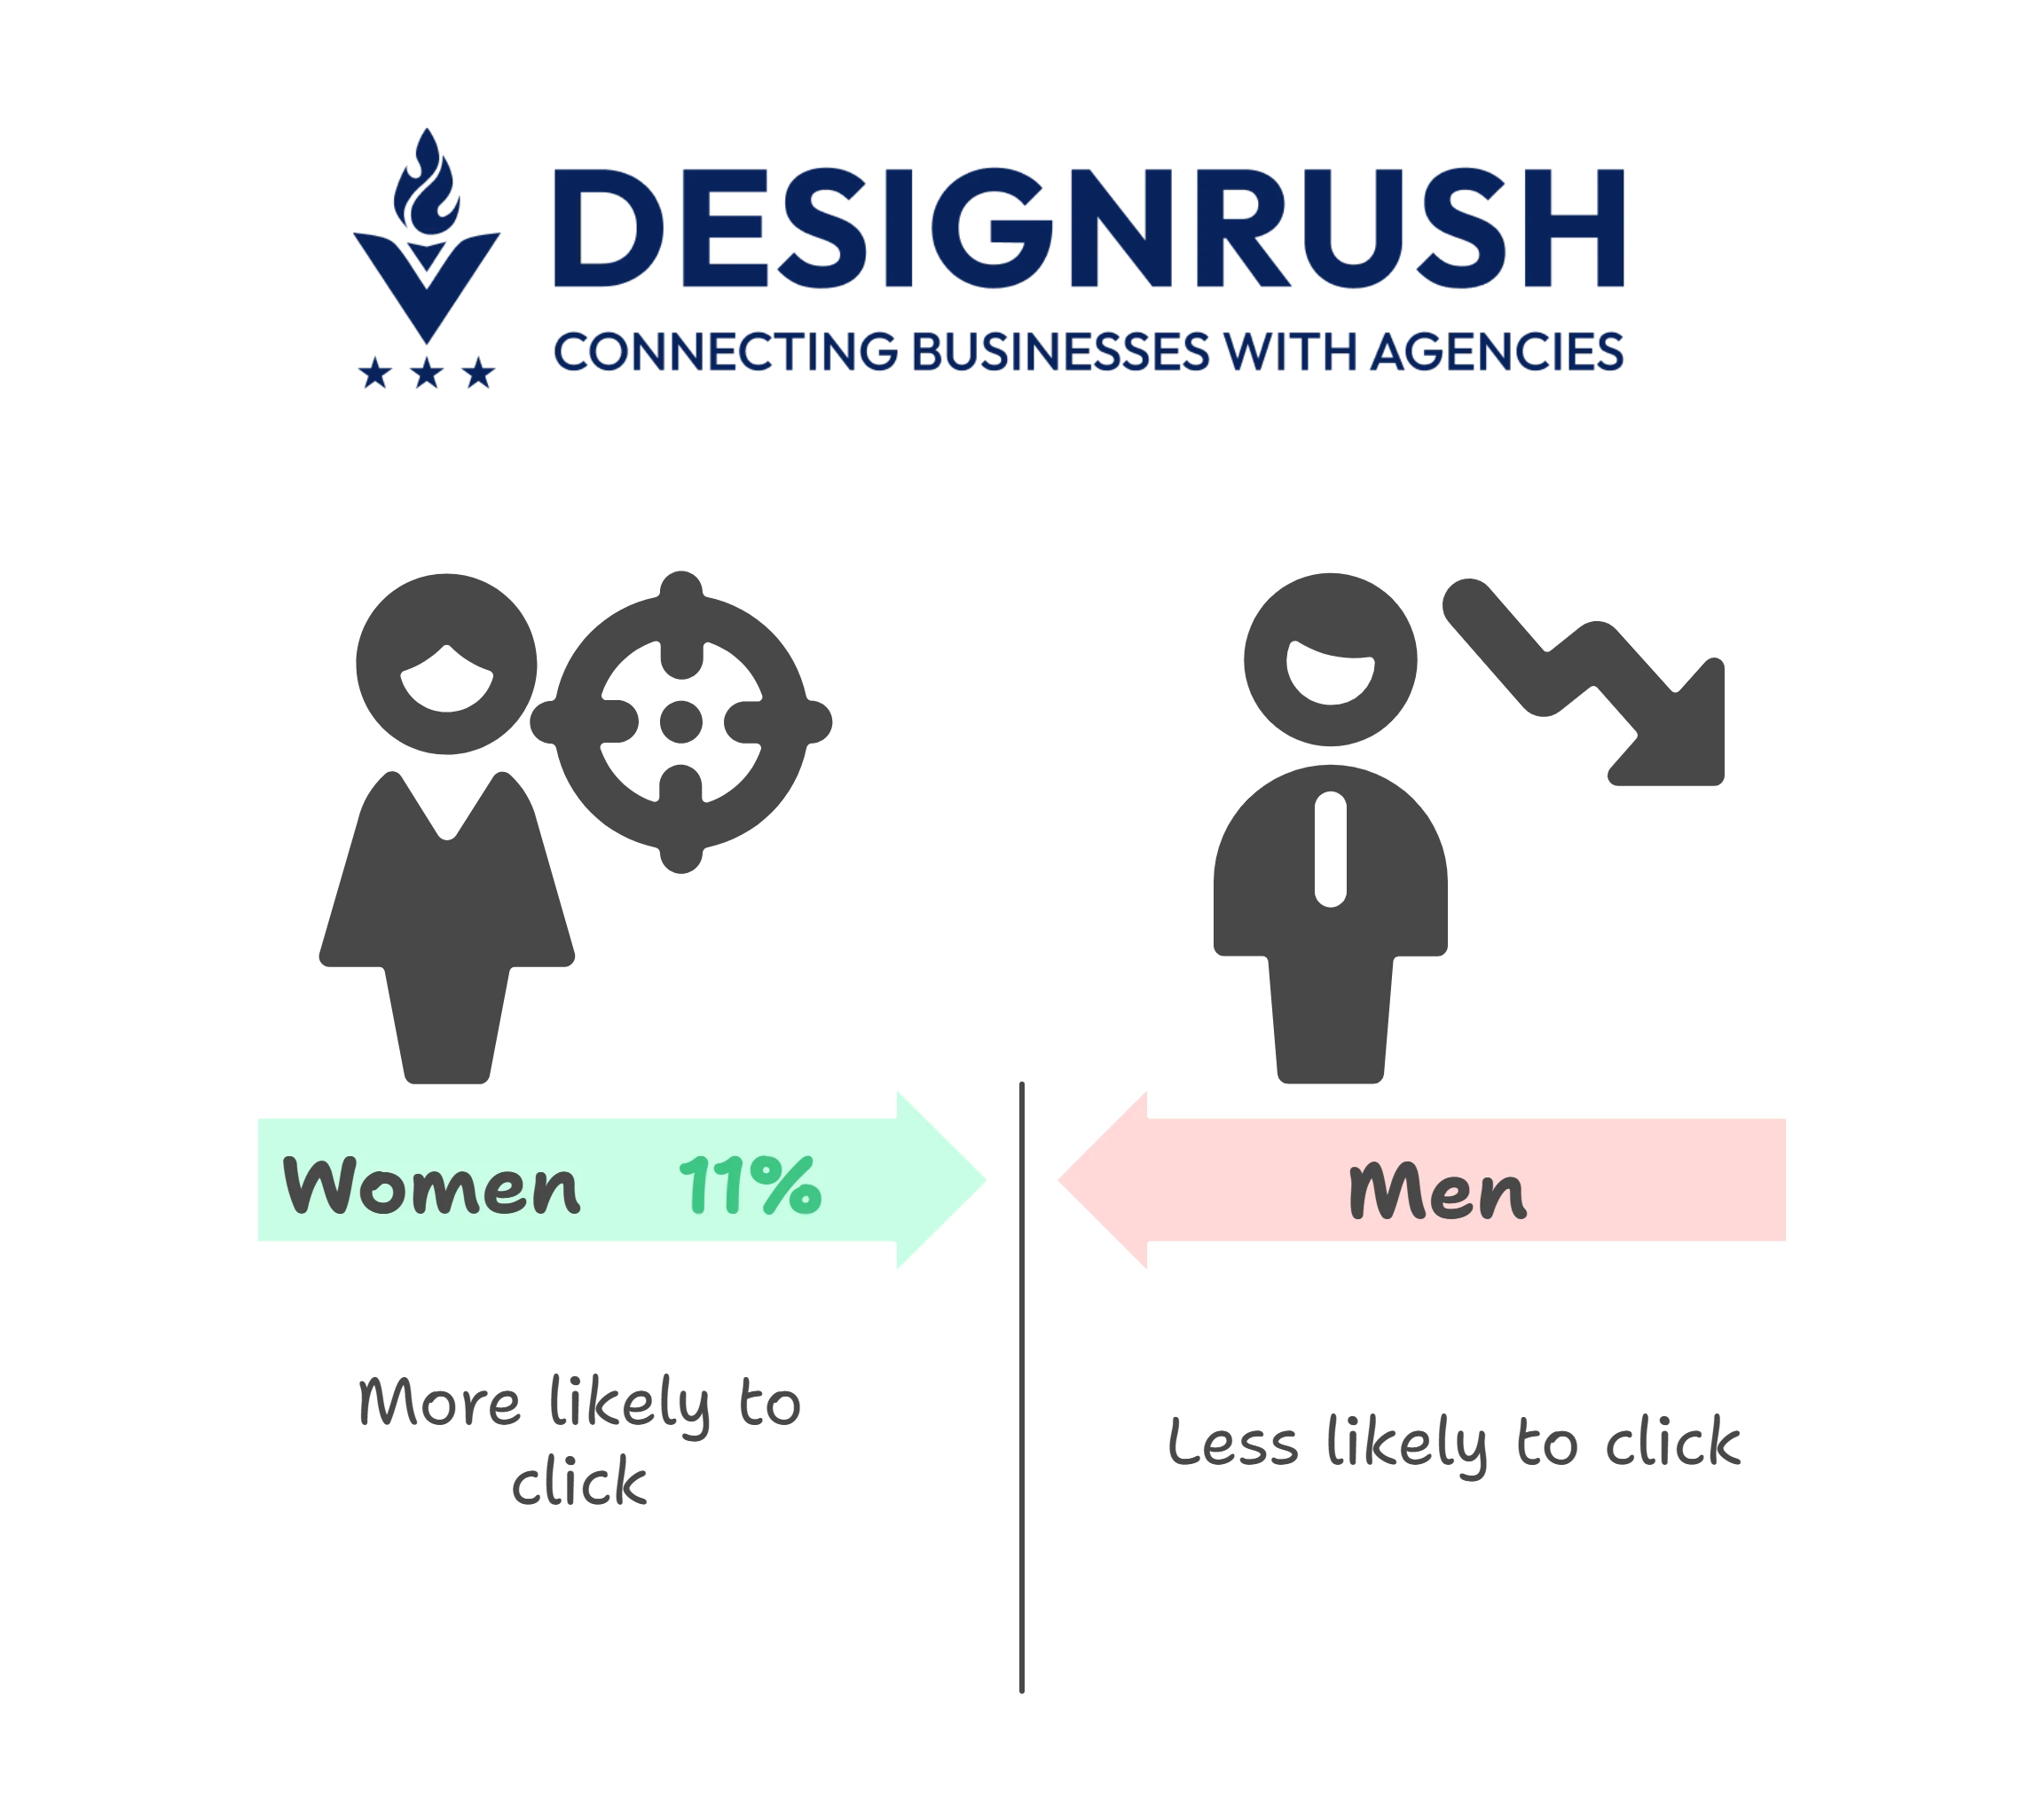
- Women are 11% more likely to click on ads than men, particularly in categories like retail, lifestyle, and healthcare.
- Among women aged 50+, click-through rates are 31.2% higher than younger counterparts.
- 46% of Gen Z (ages 18–24) prefer social media platforms over traditional search engines favoring TikTok, Instagram, and YouTube for discovery.
- These stats show why it's essential to adjust your ads based on who you're targeting. Different age groups and genders engage differently with ads.
Tailoring your messaging and placements to those patterns will give your campaigns a better shot at real results: more clicks, better leads, and stronger returns.
3. Engagement Patterns
How and when users interact with your ads can have a significant impact on campaign efficiency. This section breaks down device behavior and optimal timing to help sharpen your targeting.
- Appearing in mobile search ad results can increase brand awareness by 46%. Even unaided brand recall rises significantly just by showing up in mobile placements.
- 51% of smartphone users say they've discovered a new product or brand through mobile search ads, making mobile visibility critical for upper-funnel success.
- Start broad with time windows like early morning (6AM–12PM) or evening (6PM–9PM). Then, refine your campaign performance data over several weeks.
Mobile is a key driver of visibility and discovery, but timing matters too.
To get the most from your spend, align ad delivery with real usage windows and let performance data guide your scheduling.
Google Ads vs Other Platforms: ROI and Strategic Fit
 Are Google Ads still worth it? When should you use it over other channels?
Let’s compare ROI benchmarks and strategic roles across today’s top ad platforms.
- Google Ads delivers a median return on ad spend (ROAS) of 3.52, compared to Facebook’s 2.21 across industries.
- In verticals like Automotive Parts, Home Appliances, and Travel, Google’s ROAS exceeds 6:1 — signaling strong returns where search intent is high.
- Google Ads clicks cost more — averaging $5.26 per click — but often capture bottom-funnel users with strong purchase intent.
- Facebook and Instagram ads cost around $1.72 per click, making them ideal for broad reach, retargeting, and top- to mid-funnel campaigns.
- Sponsored LinkedIn ads average a CTR between 0.44% and 0.65%. While lower than Google Search ads, this is expected for B2B environments where users take longer to act.
Engagement is more about quality than volume. - The average CPC on LinkedIn is $5.58 globally. Higher than Meta but justified by the ability to target professionals by job title, industry, and decision-making level.
The numbers show there’s no one-size-fits-all winner. Each platform plays a different role in your funnel.
Google Ads dominates for high-intent, bottom-funnel conversions, especially in verticals with urgent needs or high-value purchases and often delivers stronger ROI in those scenarios.
Meta platforms offer efficient reach and retargeting at scale.
LinkedIn justifies its higher costs by delivering qualified B2B leads with stronger downstream value.
The takeaway: don’t just follow cost metrics. Match your channel mix to your audience behavior and campaign goals.
For purchase-ready users, Google is hard to beat.
For awareness, engagement, and nurturing, Meta and LinkedIn can stretch your budget further — as long as the content and offer fit the context.
Google Ads Statistics: Wrap-Up
If you're investing in Google Ads in 2025, remember: precision matters.
Rising costs, evolving user behavior, and tighter targeting signals mean performance hinges on how well you align each campaign with audience intent.
These stats reinforce that Google Ads still delivers when strategy, creative, and spend are tightly aligned.
Don’t just advertise. Optimize every part of your funnel to convert high-intent users where they search, scroll, and act.
![]()
Our team ranks agencies worldwide to help you find a qualified partner. Visit our Agency Directory for the best PPC companies, as well as:
- SEO Agencies
- Social Media Marketing Agencies
- Content Marketing Agencies
- Conversion Rate Optimization Companies
- Email Marketing Agencies
- Google Adwords Agencies
Our design experts also recognize the most innovative design projects across the globe. Given the topic, you'll want to visit our Awards section for the best & latest in advertising website designs.
Google Ads Statistics: FAQs
1. How long does it take to see results from Google Ads?
While some campaigns show early signs of performance, it often takes several weeks of data gathering and optimization to reach consistent, scalable results.
Google’s algorithm needs time to learn which audiences, keywords, and creatives convert best.
2. What’s the biggest mistake advertisers make with Google Ads?
One of the most common mistakes is setting broad targeting without aligning messaging or landing pages to the user’s intent. Without relevance, even a high-traffic campaign can underperform on conversions.
3. How long should I run a campaign before evaluating ROI?
Give your campaigns at least 4–6 weeks to collect meaningful data. This allows enough time for the algorithm to optimize, especially if you're using automated bidding strategies.
But monitor early indicators like CTR and CPC to catch inefficiencies before they scale.