Every dollar spent on advertising needs to generate positive returns. The big question is: are your ad campaigns truly profitable?
Our free ROAS calculator helps you track your advertising performance by comparing advertising costs against generated revenue.
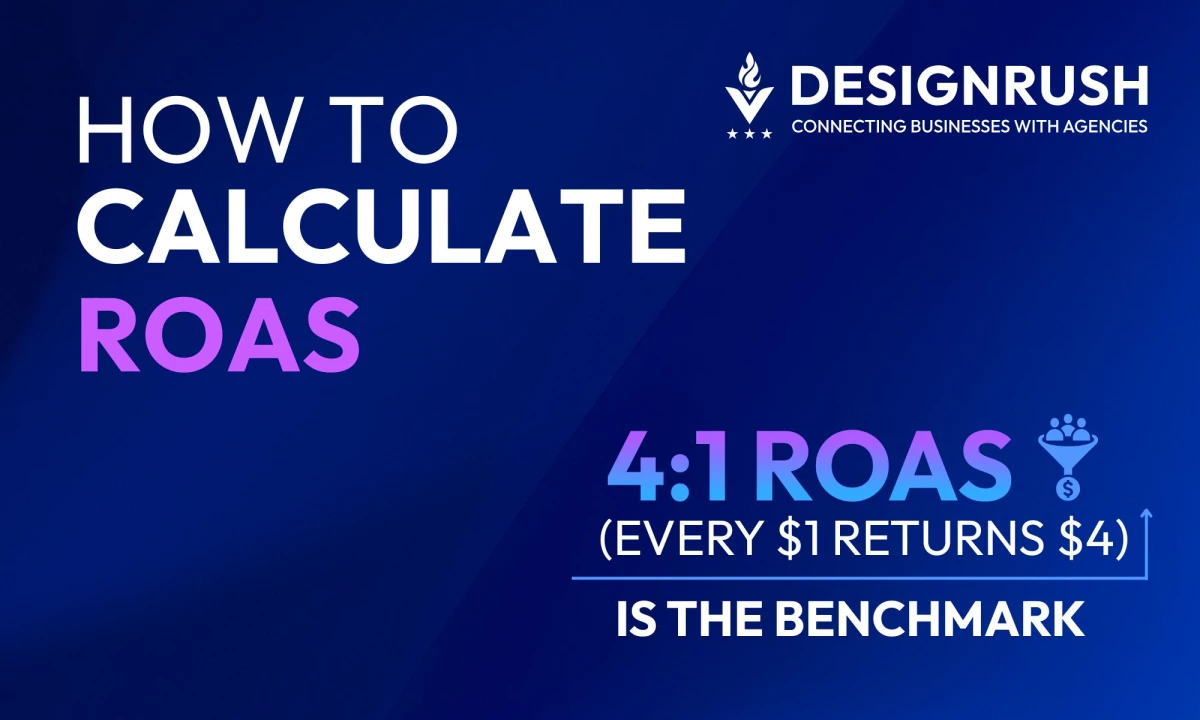
How To Calculate ROAS: Key Points
- A 4:1 ROAS (every $1 returns $4) is a common benchmark, but true profit requires factoring in all ad-related costs.
- High ROAS can be misleading. Manual checks help reveal thin margins hidden by automation.
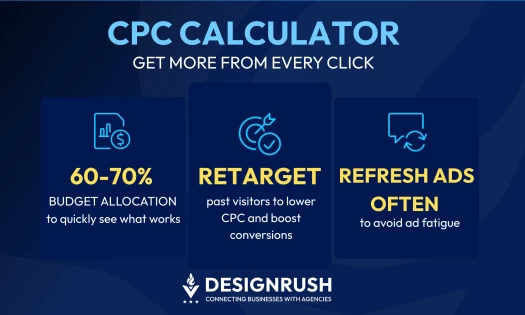
- Optimizing targeting, landing pages, and keywords directly boosts ROAS without extra spend.
What Is ROAS? An Overview
ROAS, or Return on Ad Spend, shows exactly how many dollars in revenue are generated for every dollar invested in ads.
We share how to measure and interpret ROAS effectively, with insights from Ana Aragon.
Who is Ana Aragon?
Ana Aragon is the Marketing Director at White Shark Media, with a Business Administration degree and an MBA. Rising from intern to director over seven years, she now leads marketing strategy, combining inbound and outbound tactics to boost brand visibility and ensure profitability.
ROAS Formula = Revenue ÷ Ad Spend
ROAS helps marketers and business leaders understand not just if ads are working, but how well they’re working.
A higher ROAS means more return per dollar spent.
It is calculated very simply as:
ROAS = Revenue ÷ Ad Spend
For example, earning $5,000 in sales from $1,000 of ads yields a 5:1 ROAS (every $1 spent returns $5).
This metric can be applied overall or to individual campaigns, channels, and ad groups to compare your campaign’s effectiveness.
@maryannedamarzo ROAS - Return on Ad Spend tells you how much revenue you generated for every pound (or dollar or any currency) spent on advertising. 💸 For example, if you spent £100 on advertising and it generated £200 in revenue, then your ROAS is 200/100 = 2. It means for every pound you spent on advertising, you will get £2 in return. #ROAS#returnonadspend#marketingmetric#adsoptimization#marketing#adspend#digitalmarketing#marketingforbeginners#learnmarketing♬ Somewhere Only We Know - Xdx prod
Common Mistakes To Avoid When Calculating ROAS
Aragon points out how relying solely on automated reports can mislead.
She reports frequent discrepancies with ad platform data, so she cross-references with manual tracking:
“I've opted for a more traditional approach, utilizing old-school spreadsheets to meticulously track investments and results. “
She also stresses that gut instinct and creativity still matterin interpreting data:
“While data is undeniably crucial, as marketers, we must recognize the indispensable role played by our gut instinct and creativity in shaping the effectiveness of our strategies.
It's imperative never to overlook the subjective elements that contribute to the success of a marketing approach.”
When calculating ROAS, beware of “shallow” ROAS that ignores real costs. Traditionally, ROAS measures revenue against media spend alone.
However, experts suggest broadening this calculation to include related costs such as labor or agency fees to avoid artificially inflating performance metrics.
In practice, this means a very high ROAS might still yield little profit if product margins are thin.
Interpreting ROAS: What Is a Good ROAS?
A good rule of thumb is 4:1, meaning for every $1 you spend, you should want to generate $4 in revenue.
However, ROAS benchmarks can vary by industry, channel, and business goals. Some general guidelines are:
ROAS Ratio | Percentage | Meaning |
1:1 | 100% | Break-even – ad costs are fully recovered, but no profit. |
< 1:1 | <100% | Losing money – costs exceed revenue. |
3:1 to 4:1 | 300–400% | Strong result – typically covers costs and delivers profit. |
However, always compare ROAS against your profitability metrics like ROI to get a more accurate overview.
Aragon expounds on how businesses should focus less on flawless attribution and more on sustainable spend levels:
“The strength of a blended ROAS strategy lies in the acknowledgment that achieving 100% accuracy in tracking every channel is impractical.
Instead, the focus shifts to establishing a target for marketing costs that your business can afford at specific revenue levels.
Channel-specific ROAS targets become a strategic exercise aimed at maximizing revenue within the overall marketing budget."
Before launching campaigns, set a minimum acceptable ROAS based on profit goals, so you don’t overspend or underperform.
Key Factors That Affect Your ROAS Calculation
Here are some of the variables that affect ROAS: 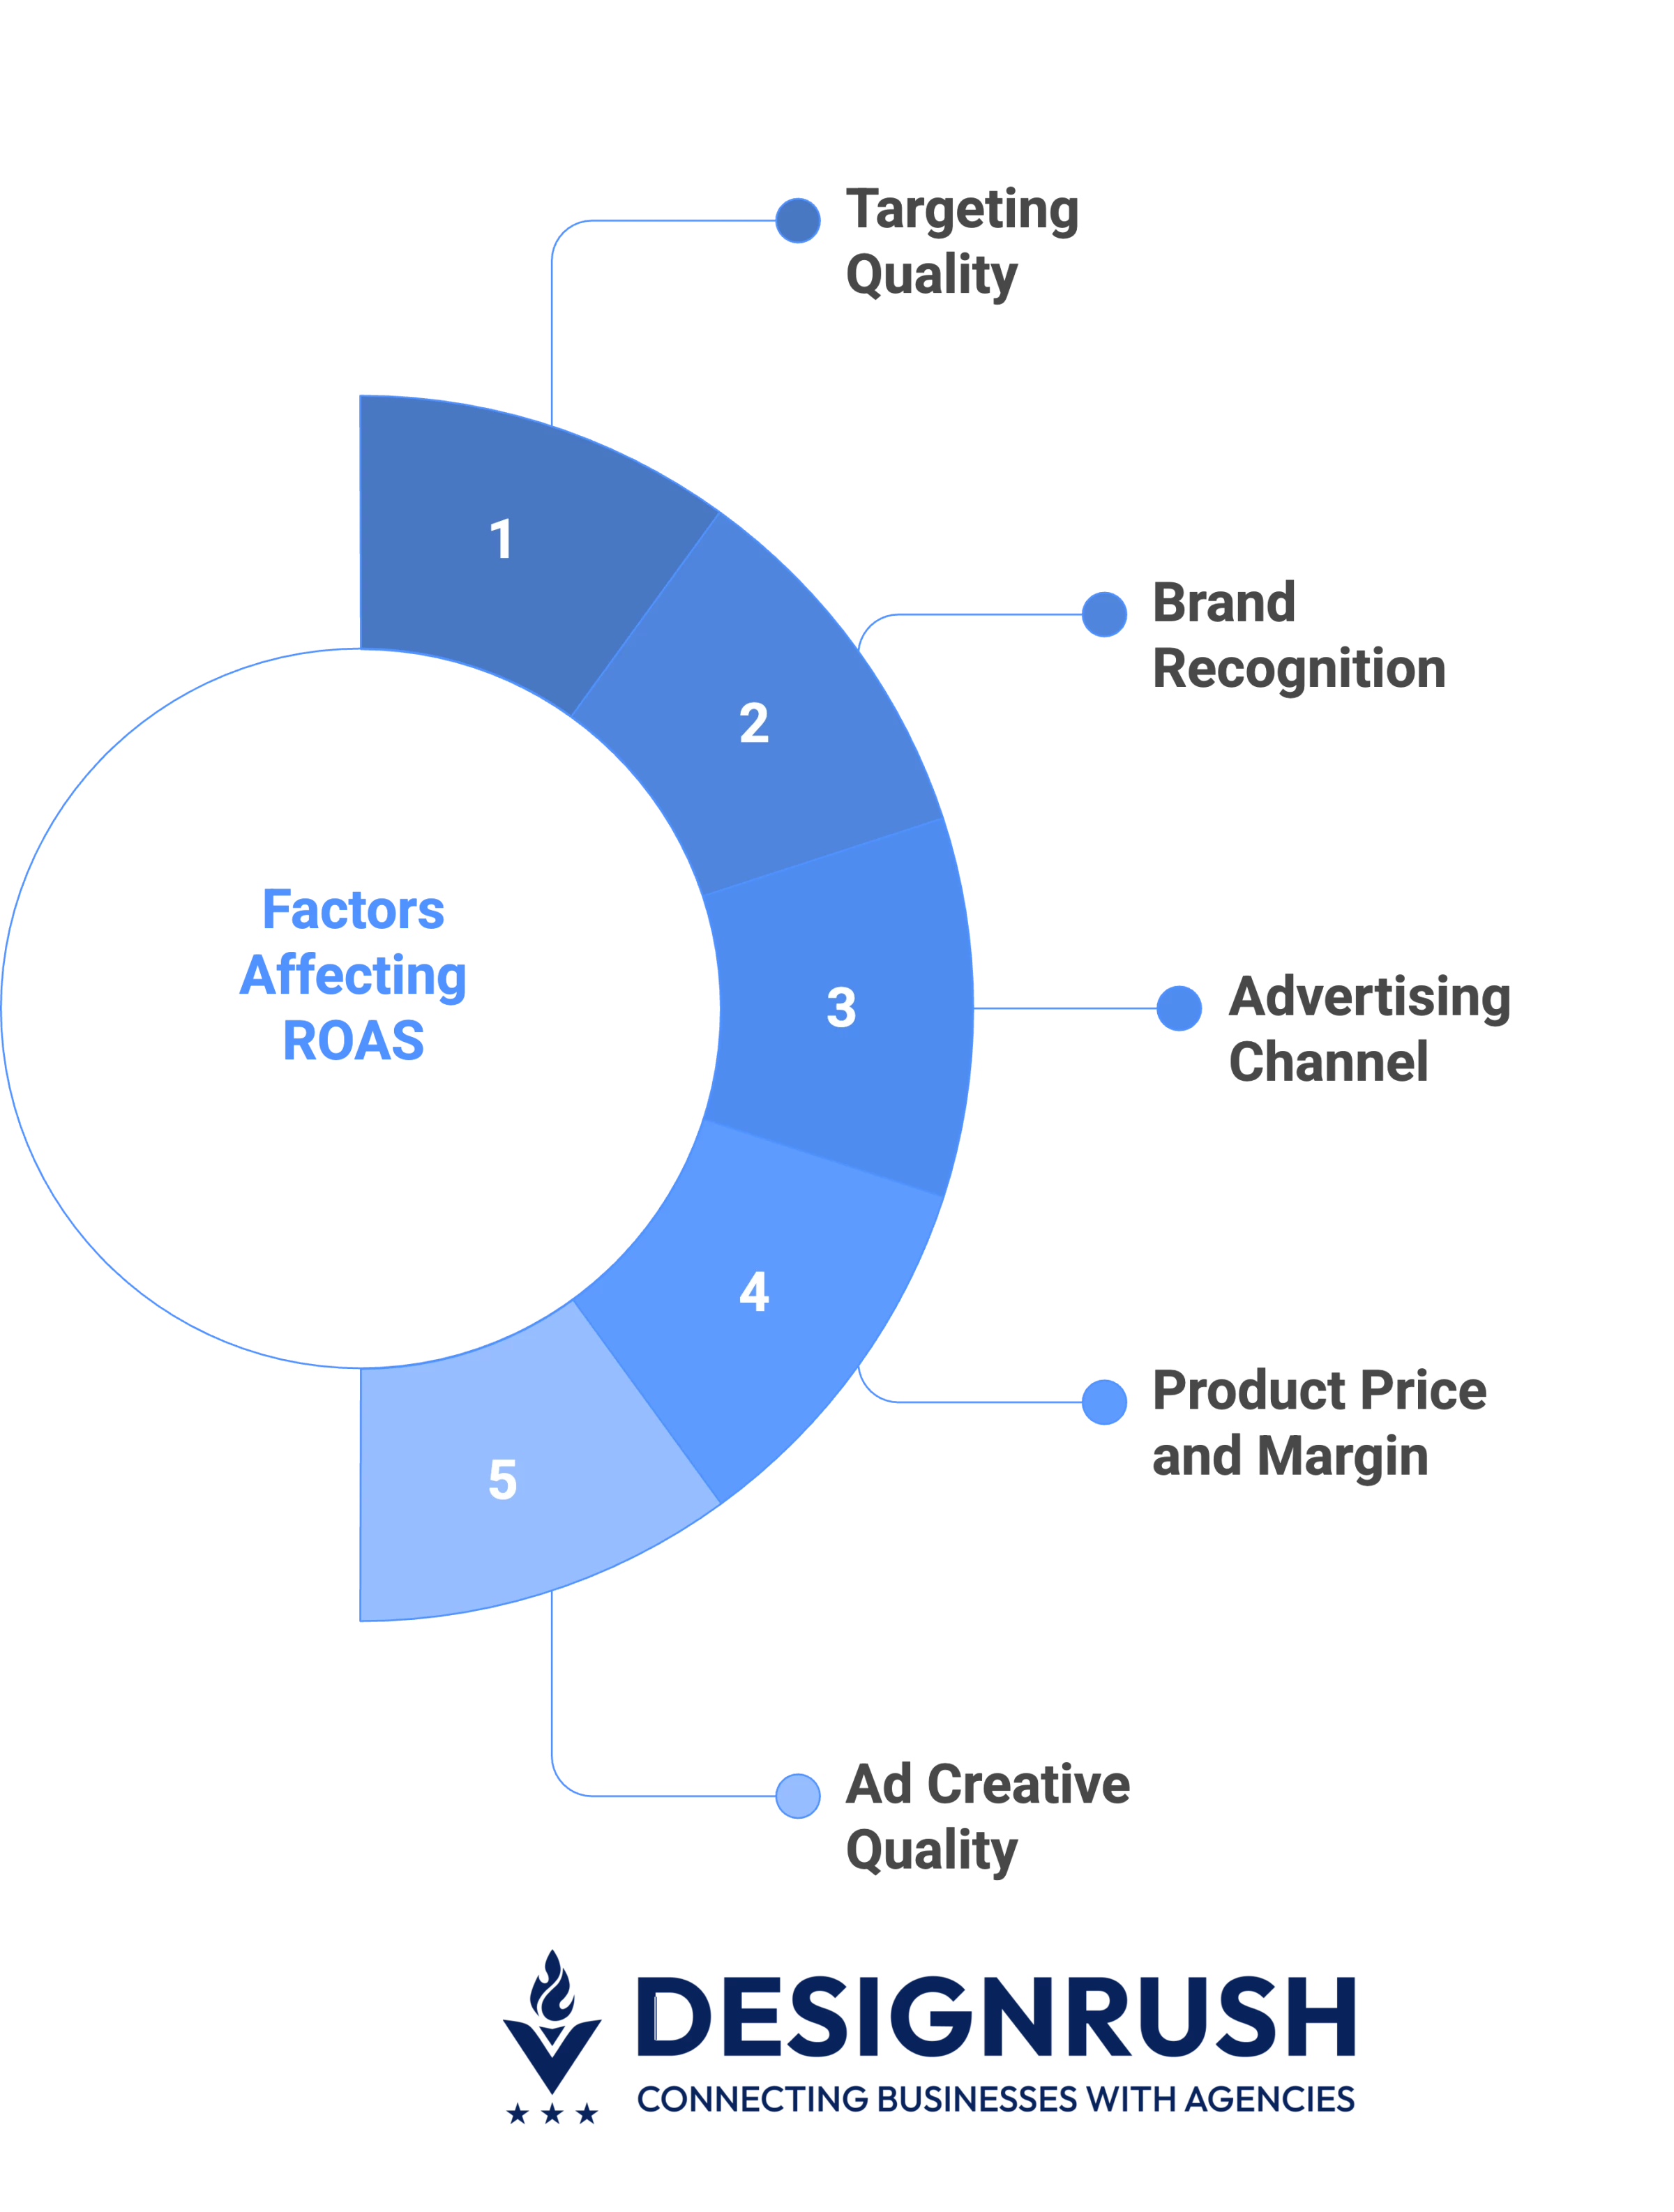
- Ads aimed at the right audience convert at a higher rate. Aragon notes that LinkedIn allows B2B advertisers to “precisely target audiences based on job titles and decision-making roles.”
- Well-known brands generally see higher ROAS, as customers are more likely to click ads and convert.
- ROAS varies by platform: search ads convert best, while display and social build awareness.
- High-margin products can afford lower ROAS targets; low-margin goods require higher ROAS to be profitable.
- Compelling ad copy, images, and offers drive clicks and conversions.
Proven Ways To Improve Your ROAS
To improve your ROAS, here are some aspects you can optimize: 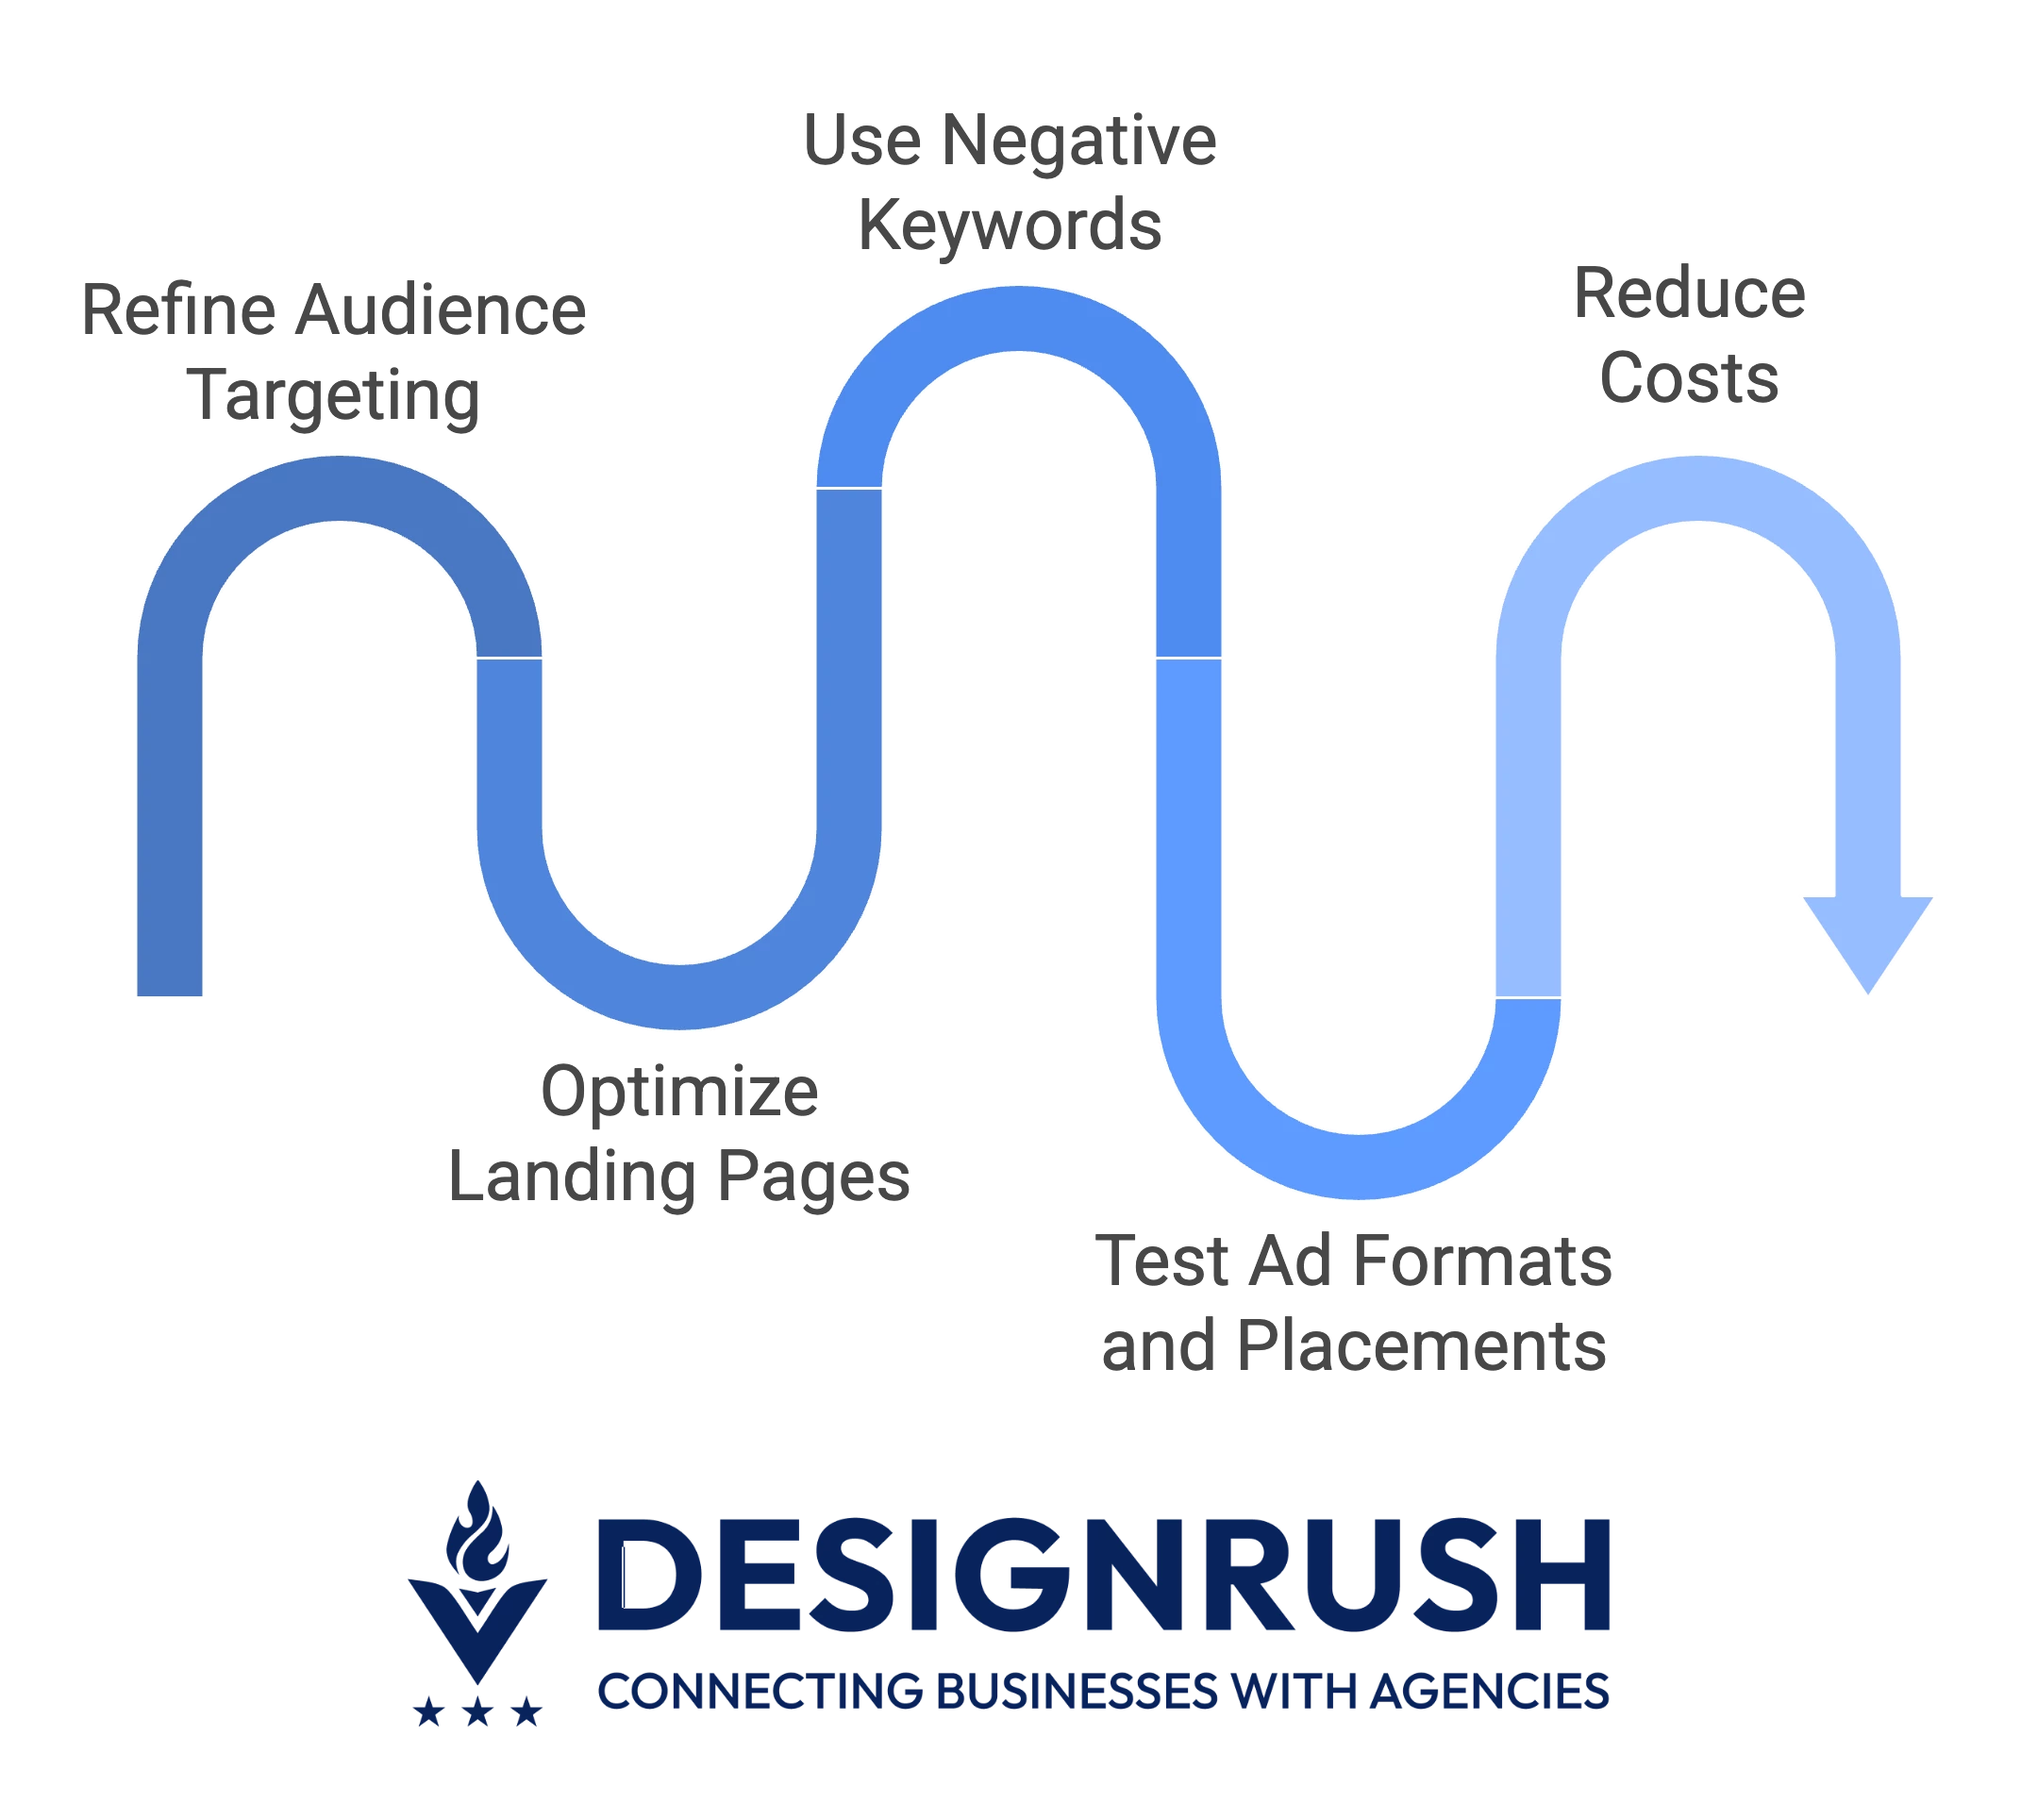
- Narrow down segments with the highest conversion rates using demographics, geotargeting, remarketing, and lookalike audiences.
- Optimize landing pages. Remove unnecessary fields, streamline forms, and load pages quickly.
- Use negative keywords to filter out irrelevant search terms.
- Test ad formats and placements. Aragon notes the prevalence of Instagram and Facebook Reels, and YouTube Shorts in digital consumption.
- Reduce ad-related overhead. Aragon mentions using tools (Optmyzer, DataFeedWatch) to eliminate repetitive work and free team capacity.
Wrap-Up: How To Calculate ROAS
Using a ROAS calculator takes the guesswork out of figuring out how well your ads are performing.
As Ana Aragon points out, looking at blended ROAS (tracking aggregated spend vs. revenue) along with occasional manual checks makes it easier to see what’s really driving profit.
![]()
Our team ranks agencies worldwide to help you find a qualified partner to implement the latest AI solutions. Visit our Agency Directory for the Top PPC Agencies, as well as:
- Top Advertising Agencies
- Top eCommerce PPC Agencies
- Top B2B PPC Agencies
- Best Google Ads Agencies
- Top Conversion Rate Optimization Agencies
Calculating ROAS FAQs
1. What's the difference between ROAS and ROI?
ROAS and ROI might look similar at first glance. ROAS measures revenue for each advertising dollar spent. ROI shows overall profitability with all costs included. ROAS helps you see how well your ads perform, while ROI gives you a complete picture of business performance.
2. How often should I monitor ROAS during a campaign?
It’s recommended to monitor ROAS at least weekly, especially for high-spend campaigns, to identify trends and adjust strategies in real-time.
3. What tools can help with tracking ROAS across multiple platforms?
Popular tools for tracking ROAS include Google Analytics, Facebook Ads Manager, and third-party platforms that offer integrated dashboards for multi-platform performance analysis.