Digital marketing ROI proves whether your online marketing is making money or quietly draining the budget.
In this guide, we're breaking down the formulas, benchmarks, common reporting mistakes, and measurement methods teams use to defend spend and improve returns.
Digital Marketing ROI: Key Findings
- A 5:1 ROI is a common benchmark for strong performance, while 10:1 is exceptional and 2:1 is often too weak once salaries, tools, agency fees, production, and sales support are included.
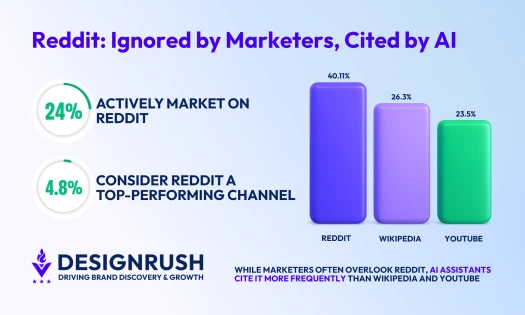
- Platform-reported revenue can over-credit the final channel before conversion, which makes CRM attribution, UTM tracking, and conversion APIs essential for accurate ROI measurement.
- Click-based attribution hides where demand is created, while Silverback finds MMM and incrementality testing reveal what truly drives revenue.
What Is a Good Digital Marketing ROI?
Marketing leaders are under pressure to prove that every extra dollar they request can turn into measurable business value.
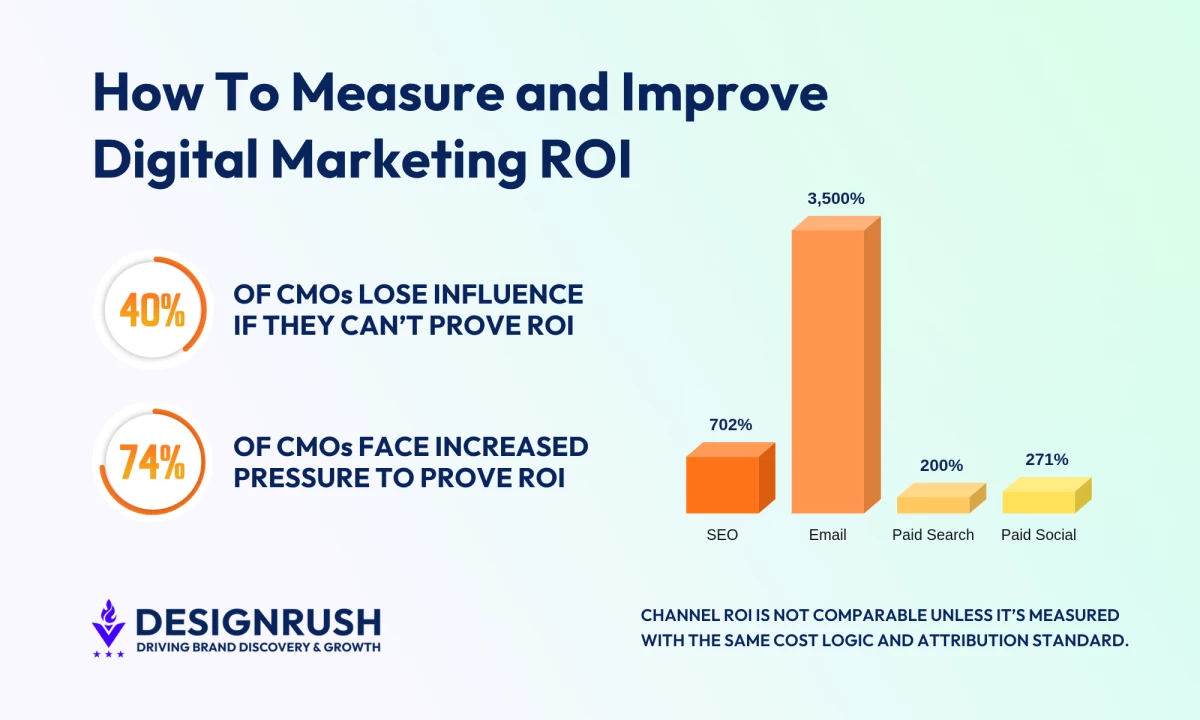
According to a February 2026 Gartner report, over 40% of CMOs who push for larger budgets will lose influence on the C-suite because they will be unable to demonstrate clear return on investment (ROI).
A good digital marketing ROI is a return that proves your campaigns are generating more value than they cost to run.
The common benchmark is a 5:1 ROI, which means the business earns $5 for every $1 spent on digital marketing.
A 2:1 ROI is usually considered weak because it can look profitable on paper while shrinking once you account for expenses outside the campaign itself, such as salaries, software, agency fees, office costs, and sales support.
A 10:1 ROI is considered exceptional. At that level, the campaign is producing a strong return even after external costs and operational variables are factored in.
Still, a good ROI depends on the industry, channel, business model, and campaign goal.
- Startups in competitive markets often run at a lower ROI as they buy market share.
- High-margin businesses can sustain higher ROI thresholds before reallocating.
- Low-margin or commodity businesses may consider 3:1 a strong result.
There is no universal benchmark for ROI in digital marketing because a healthy return for a high-margin SaaS company may be unrealistic for a low-margin eCommerce brand.
Digital Marketing ROI by Channel
Channels also produce very different return profiles.
- SEO ROI: 702% ROI for B2B SaaS SEO
- Email marketing ROI: $36+ for every $1 spent
- Paid search ROI: $2 in profit for every $1 spent on Google Ads
- Paid social ROI: $3.71 in revenue for every $1 spent across US Meta advertisers
- Display advertising ROI: 0.59% average eCommerce conversion rate for Google Display Ads
Don't chase a single industry-average number. Instead, define what good looks like for your margin structure, sales cycle, and stage, and then use the measurement methods below to confirm you're hitting it.
ROI vs. ROAS vs. CLV-Adjusted ROI
ROI shows whether the full marketing investment paid off. It compares revenue against total marketing cost, including spend on ads, salaries, tools, agency fees, creative production, and other resources needed to run the program.
 Return on ad spend (ROAS) shows how efficiently ad spend turns into revenue. It compares ad revenue against ad spend only, which makes it useful for evaluating paid search, paid social, display, and other campaign-level media investments.
 Customer lifetime value (CLV)-adjusted ROI shows whether acquisition spend pays off over the customer’s full value. Instead of judging a campaign only by the first purchase or first contract, it uses customer lifetime value to estimate the longer-term return from new customers.

How To Calculate Digital Marketing ROI in 4 Steps
NIQ’s 2026 CMO Outlook found that 74% of CMOs now face increased pressure to prove marketing ROI.
That pressure exposes the weak spots in most ROI calculations, like incomplete costs, platform-reported revenue that does not match actual sales, and headline percentages with no supporting metrics behind them.
The formula only works when the costs are complete, the revenue is tied to the right campaigns, and the supporting metrics explain what the final percentage actually means.
Use these four steps to move from a surface-level ROI number to a calculation finance, marketing, and leadership can all trust.
- Step 1: Define costs clearly
- Step 2: Attribute revenue accurately
- Step 3: Incorporate supporting metrics
- Step 4: Use attribution modeling
Step 1: Define Costs Clearly
Include every line item that touches the campaign:
- Paid media
- Creative and production
- Platform and tool subscriptions
- Personnel time and agency fees
Campaigns that show positive ROI while ignoring labor and tooling are common, and the ROI usually drops once those are added. Define what's in-scope upfront to avoid that.
When Missing Costs Inflate ROI
A SaaS team’s first pass at quarterly ROI might look like this:
- Media spend: $10,000
- Attributed revenue: $52,000
- First-pass ROI = ($52,000 - $10,000) / $10,000 × 100 = 420%
That creates a clean 4.2x return story. Then finance asks for the full cost breakdown:
- Media spend: $10,000
- Creative and landing-page production: $2,500
- Marketing tooling allocation: $1,500
- Agency retainer for the quarter: $3,000
- Internal team time: $4,000
- True total cost: $21,000
Real ROI = ($52,000 - $21,000) / $21,000 × 100 ≈ 148%
Same revenue, very different story. The campaign is still profitable, but the second number gives the CFO a more accurate view of performance.
Define what belongs in the calculation before the campaign runs so the answer does not change every time someone asks for it.
When Forecasted ROI Helps Defend the Budget
 The same cost discipline applies before the campaign launches. Forecasting ROI gives finance a baseline for whether the planned spend makes sense.
Start with expected leads, historical close rate, average sale price, and planned cost:
1,000 expected leads × 25% close rate × $50 average sale = $12,500 predicted revenue
Against $5,000 in planned spend, the forecasted ROI is:
($12,500 - $5,000) / $5,000 × 100 = 150%
Forecasts will rarely land perfectly, but they give the team a defensible estimate before money is spent and a clear benchmark to compare against after the campaign runs.
Step 2: Attribute Revenue Accurately
Tie revenue to campaigns using:
- UTM parameters for link tagging, so site traffic and conversions trace back to the campaign that drove them.
- CRM attribution to connect closed deals back to lead source.
- Conversion APIs, e.g., Meta's CAPI, to capture server-side conversions, bypassing cookie restrictions and improving data accuracy.
Integrating your CRM with ad platforms makes it possible to confirm that a Google Ads click eventually led to a sale. Without that stitching, you'll over- or under-credit channels and miscalculate ROI.
When Platform Revenue Overstates One Channel’s Impact
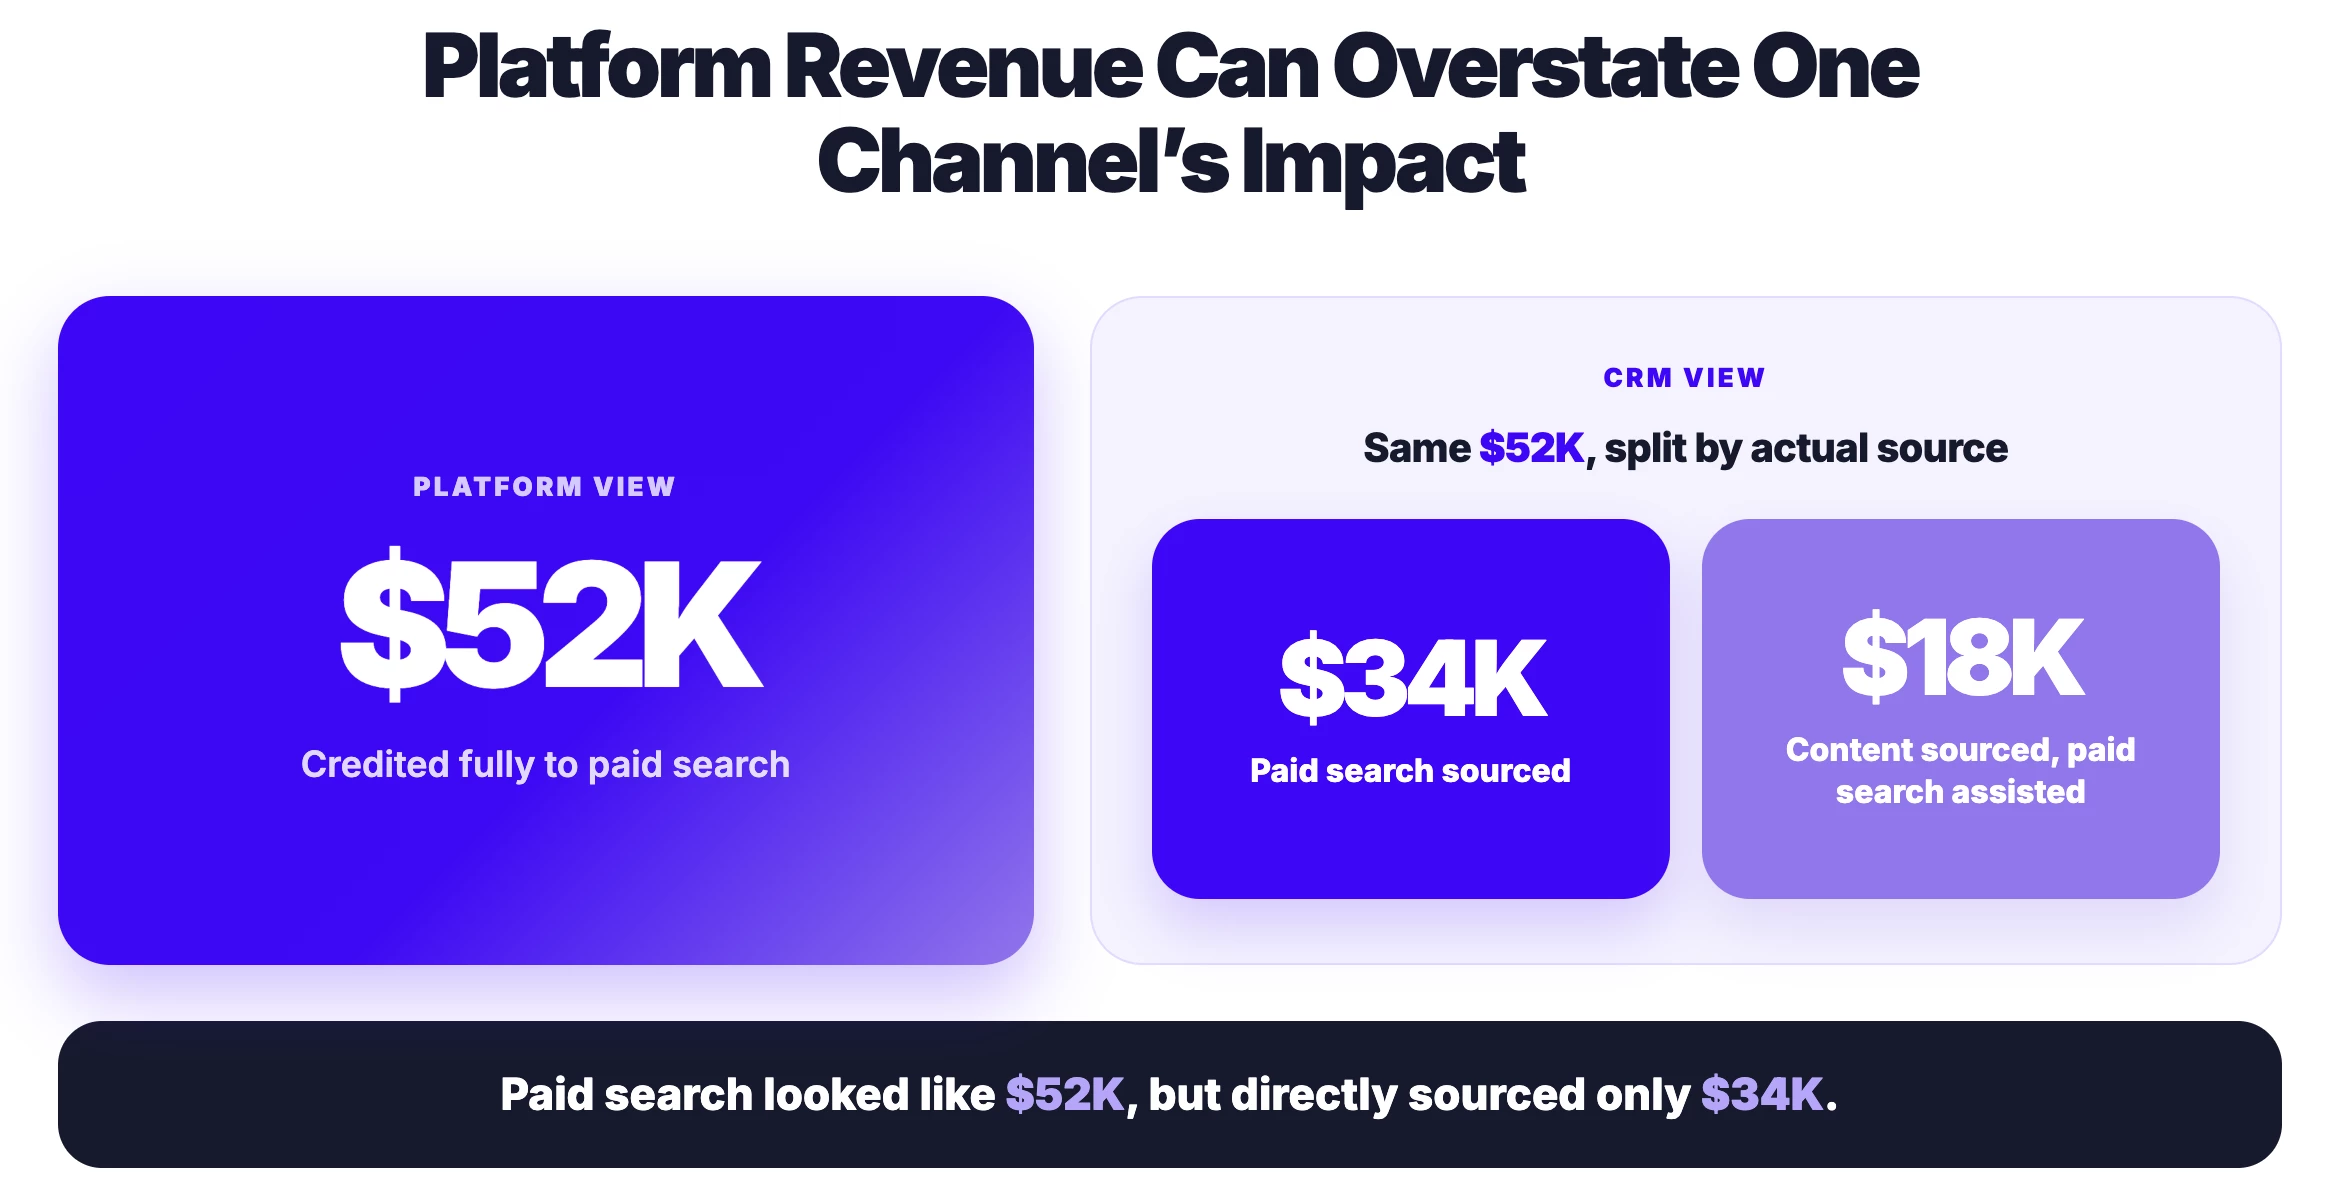
Back to the SaaS team. Their paid search platform reports $52,000 in attributed revenue, which is the number they used in Step 1.
Once they connect UTM tags to the CRM and review actual closed-deal data, the picture changes:
- $34,000 came from deals where paid search was the first touch.
- $18,000 came from deals where organic content was the first touch and paid search was the final click before the demo.
The platform credited paid search with the full $52,000. The CRM shows that paid search directly sourced $34,000 and helped close another $18,000 that content originally created.
Same revenue total, different allocation story.
Without UTM-to-CRM tracking, the team would keep overfunding paid search and underfunding the content that is sourcing part of the pipeline.
Step 3: Incorporate Supporting Metrics
ROI is a top-line number. Pair it with diagnostic metrics that explain why it's high or low:
- Customer acquisition cost (CAC) shows whether the business is paying too much to win each customer. A strong ROI can still hide an acquisition cost problem if growth depends on increasingly expensive leads, ads, or sales effort.
- CLV shows whether the return is strong enough over the full customer relationship. This is especially important when first-purchase revenue looks modest, but repeat purchases, renewals, or upsells make the customer more valuable over time.
- Cost per lead (CPL) shows whether the campaign is producing demand efficiently before sales quality enters the picture. If CPL rises while close rates stay flat, the campaign may be attracting attention without improving pipeline economics.
- Lead-to-close conversion rate shows whether marketing is bringing in leads the sales team can actually convert. A campaign can generate a low CPL and still hurt ROI if most leads never become customers.
- ROAS shows whether paid media is efficient before broader marketing costs are added. It helps isolate ad performance, but it should be read alongside ROI because strong ad revenue can weaken once creative, tools, agency fees, and team time are included.
When CAC Looks Expensive Until CLV Enters the Picture
The SaaS team’s quarterly numbers show a CAC of around $700 per new customer. On its own, that looks high enough for finance to question whether acquisition costs are getting out of control.
The supporting metrics change the read:
- CAC: $700
- Average customer tenure: 28 months
- Monthly contract value: $180
- CLV ≈ $5,040
- CLV ratio ≈ 7.2:1
- CAC payback period ≈ 3.9 months
A $700 CAC is healthy when the average customer is worth more than $5,000 and the acquisition cost is recovered in under four months.
Without the companion metrics, the CFO conversation is simple: CAC looks too high. With them, the team can show that it is acquiring customers worth more than seven times what it costs to win them, with payback inside the same quarter.
Step 4: Use Attribution Modeling
Single-touch attribution often misrepresents channel impact in multi-step journeys because it gives all conversion credit to one interaction, even when several channels helped move the buyer from awareness to decision.
- Multi-touch and modeled approaches distribute credit across interactions.
- First-touch attribution helps you see which channels introduce people to the brand, but it leaves out everything that happens after that first interaction.
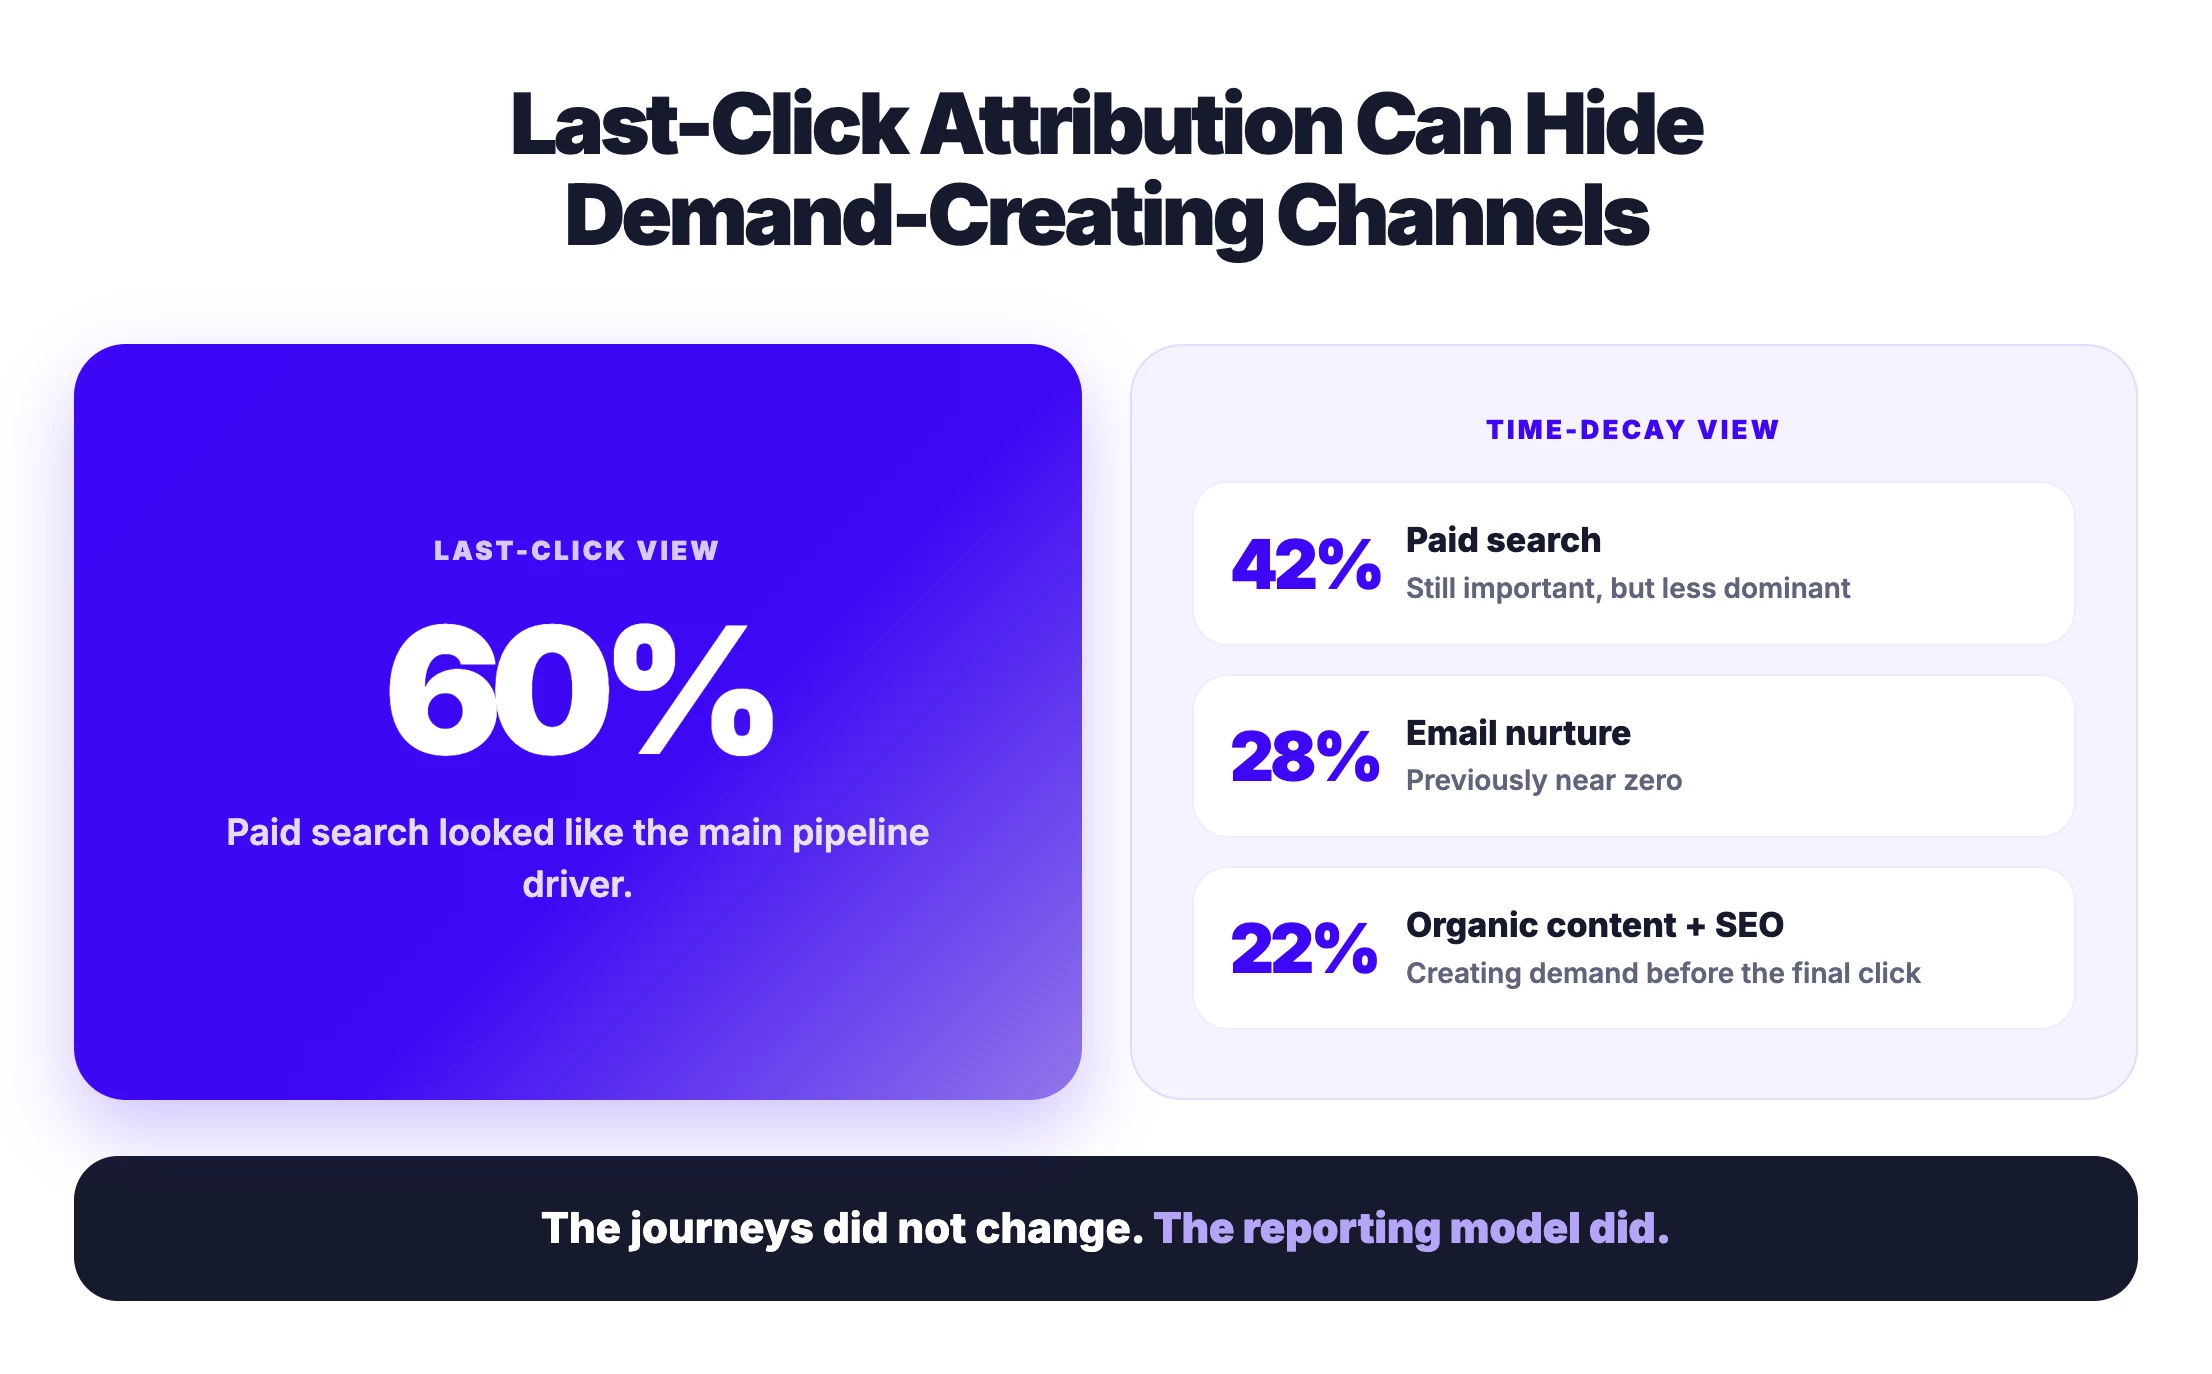
- Last-click attribution is simple enough for short B2C journeys, but it gives too much credit to the final click and hides the channels that created demand earlier.
- Linear attribution spreads credit evenly across every touchpoint, which can work for balanced campaigns but may flatten the impact of the channels doing the heaviest lifting.
- Time-decay attribution gives more weight to touchpoints closer to conversion, making it useful for longer sales cycles where late-stage activity matters more.
- Data-driven attribution in GA4 uses actual conversion-path data to assign credit based on observed behavior, but it only becomes useful when the account has enough conversion volume.
When Last-Click Attribution Hides the Channels Creating Demand
The SaaS team’s sales cycle averages 90 days, and most closed deals touch three or four channels before converting.
Their default model was last-click attribution, which credited paid search with about 60% of pipeline.
When the team switched to a time-decay model, the picture changed:
- Paid search: ~42% credit, down from 60%
- Email nurture: ~28% credit, up from near zero
- Organic content and SEO: ~22% credit, up from a small share
- Webinars and other channels: ~8%
The customer journeys did not change. The reporting model simply stopped giving all the credit to the final interaction.
That new view changed the budget conversation. Paid search was still important, but email and content were doing more pipeline work than the last-click reports showed.
For the next quarter, the team shifted roughly 15% of budget from paid search into email nurture and content, giving more support to the channels that were influencing buyers before the final click.
Attribution models are useful, but they all share a structural flaw in that they only measure what's tracked.
To answer the what would have happened if we hadn't spent question, you need a different category of measurement, which we're discussing next.
Beyond Attribution: Is Marketing Mix Modeling Right for You?
Marketing Mix Modeling (MMM) helps marketers see how each channel contributes to revenue across the full media mix, including paid, organic, online, and offline activity.
Attribution is useful for tracking known touchpoints before a conversion, but it only works with the interactions a platform can see.
That makes it less reliable when buyers move across devices, privacy controls limit tracking, or offline channels influence demand.
MMM gives ROI analysis a broader view, as it uses historical performance data to estimate which channels actually move revenue, which ones are over-credited by platform reports, and where budget can be shifted for stronger returns.
- Are you ready for MMM? Three honest prerequisites
- If you're not ready yet, start with incrementality testing
- What MMM will actually reveal about your mix
- How modern MMM works in practice
Are You Ready for MMM? Three Honest Prerequisites
Silverback Strategies, which builds measurement programs across financial services, healthcare, and other regulated verticals, frames the MMM aquisition bar clearly:
"[MMM] requires several years of clean, granular marketing data and meaningful variance in spend across channels.
A lot of companies can't meet that bar, and forcing it produces a model you can't trust."
In practice, that translates into three honest readiness checks:
- Do you have several years of clean, granular marketing data? Spend, impressions, and outcomes broken down by channel and time period, without big gaps or methodology changes mid-stream.
- Has your spend actually moved across channels? A model needs variance to learn from. If you've spent roughly the same amount on the same channels every quarter, there's nothing for the model to attribute.
- Is your media mix large and varied enough to matter? MMM is designed to allocate across many channels, including offline. Teams running only paid search and paid social will get more from incrementality testing than from a full MMM.
If the answer to any of those questions is not yet, MMM can wait. Incrementality testing will give you a cleaner starting point.
If You're Not Ready Yet, Start With Incrementality Testing
Incrementality testing measures whether a channel produces sales that wouldn't have happened without it.
Test markets get a change in spend, often a full hold-out, matched control markets don't, and the difference between them is the channel's real contribution.
It's the right first move for most teams because, per Silverback:
"It's faster to stand up, doesn't require years of historical data, and gives marketers a real answer to the only question that matters: did this channel drive sales we wouldn't have gotten anyway? For most teams, that's the right first move away from click-based attribution."
The pattern that works:
- Start with the channels where the most budget is concentrated. That's where the biggest gap between platform-reported performance and true contribution is most likely to be hiding.
- Design the test to detect a meaningful change. Spend reductions of 10-15% rarely produce a reliable signal. Turning a channel off entirely in test markets is often the cleanest read.
- Set duration up front based on the volume needed for statistical significance, not on how quickly someone wants an answer.
Once a team has run a few incrementality tests and accumulated cleaner historical data, MMM becomes a realistic next step, and the test results themselves feed the model.
What MMM Will Actually Reveal About Your Mix
The reason MMM is worth the effort is that it consistently surfaces things click-based reporting can't. Silverback has flagged two patterns that show up across engagements, both of which translate into direct allocation decisions:
1. You're probably underfunding the channels that don't get clicked.
"Click-based attribution gives no credit to TV, radio, or out-of-home — nobody clicks a TV ad before buying.
But MMM regularly shows those channels are creating real lift and pushing indirect traffic into the direct-response channels that take all the credit."
If your reporting is built on clicks, your "best-performing" channels are almost certainly being credited for sales that upper-funnel activity helped create. MMM makes that flow visible, which usually means protecting (or scaling) channels the click report tells you to cut.
2. You're probably overfunding your "winning" channels past the point of diminishing returns.
"Marketers are trained to scale what's working, but every channel hits a point where the next dollar buys less than the one before it.
Push past that point and your cost per sale climbs fast. Pulling spend back on a 'winning' channel and moving it somewhere with more room to grow usually lifts total return.
It feels wrong in the moment. The numbers are consistent."
This is the finding that most often delivers the fastest, most defensible ROI lift after an MMM build: reallocation from saturated channels into ones with more headroom.
If neither of these patterns sounds plausible for your business, MMM is probably less urgent. If one or both feels uncomfortably close to what's happening in your mix today, that's the signal it's worth the investment.
How Modern MMM Works in Practice
A common reason teams delay MMM is the legacy version of it: six-figure consulting engagement, several months to stand up, and a static report at the end. That version is largely gone.
Open-source frameworks, notably Meta's Robyn and Google's Meridian, have brought the cost down and shortened the build cycle.
Per Silverback:
"The bigger shift is how MMM works alongside incrementality testing.
The refresh cadence isn't about an arbitrary schedule — it's driven by how often you're making real changes to your marketing mix."
In practice, this is what an effective MMM program looks like quarter to quarter:
- Run an incrementality test on a channel by introducing a meaningful spend change in a portion of markets.
- Wait for statistically significant results. Depending on the spend level being tested, this can land in days or a few weeks.
- Feed the test result back into the model to sharpen its read on that channel.
- Interpret, prioritize the next test, run it, and refresh again.
What This Looks Like When It Works: Apple Federal Credit Union
A worked example helps make the case concrete. Apple Federal Credit Union (AFCU) had the problem most marketing teams will recognize:
- No clarity on which channels actually influenced revenue
- Difficulty justifying spend in executive conversations
- Vendors pitching tactics without proof
- Growing risk of wasted budget
Silverback Strategies built a Media Mix Model that quantified the true contribution of every channel in AFCU's mix, including OTT, Linear TV, Direct Mail, and Print.
The model flagged approximately $100,000 in low-value local and broadcast media that the existing reporting hadn't caught, which translates to spend that could be cut without losing revenue.
It also delivered a repeatable measurement framework AFCU could use for forward planning and the evidence to push back on vendor recommendations that weren't earning their spend.
Tools and Platforms To Measure Digital Marketing ROI
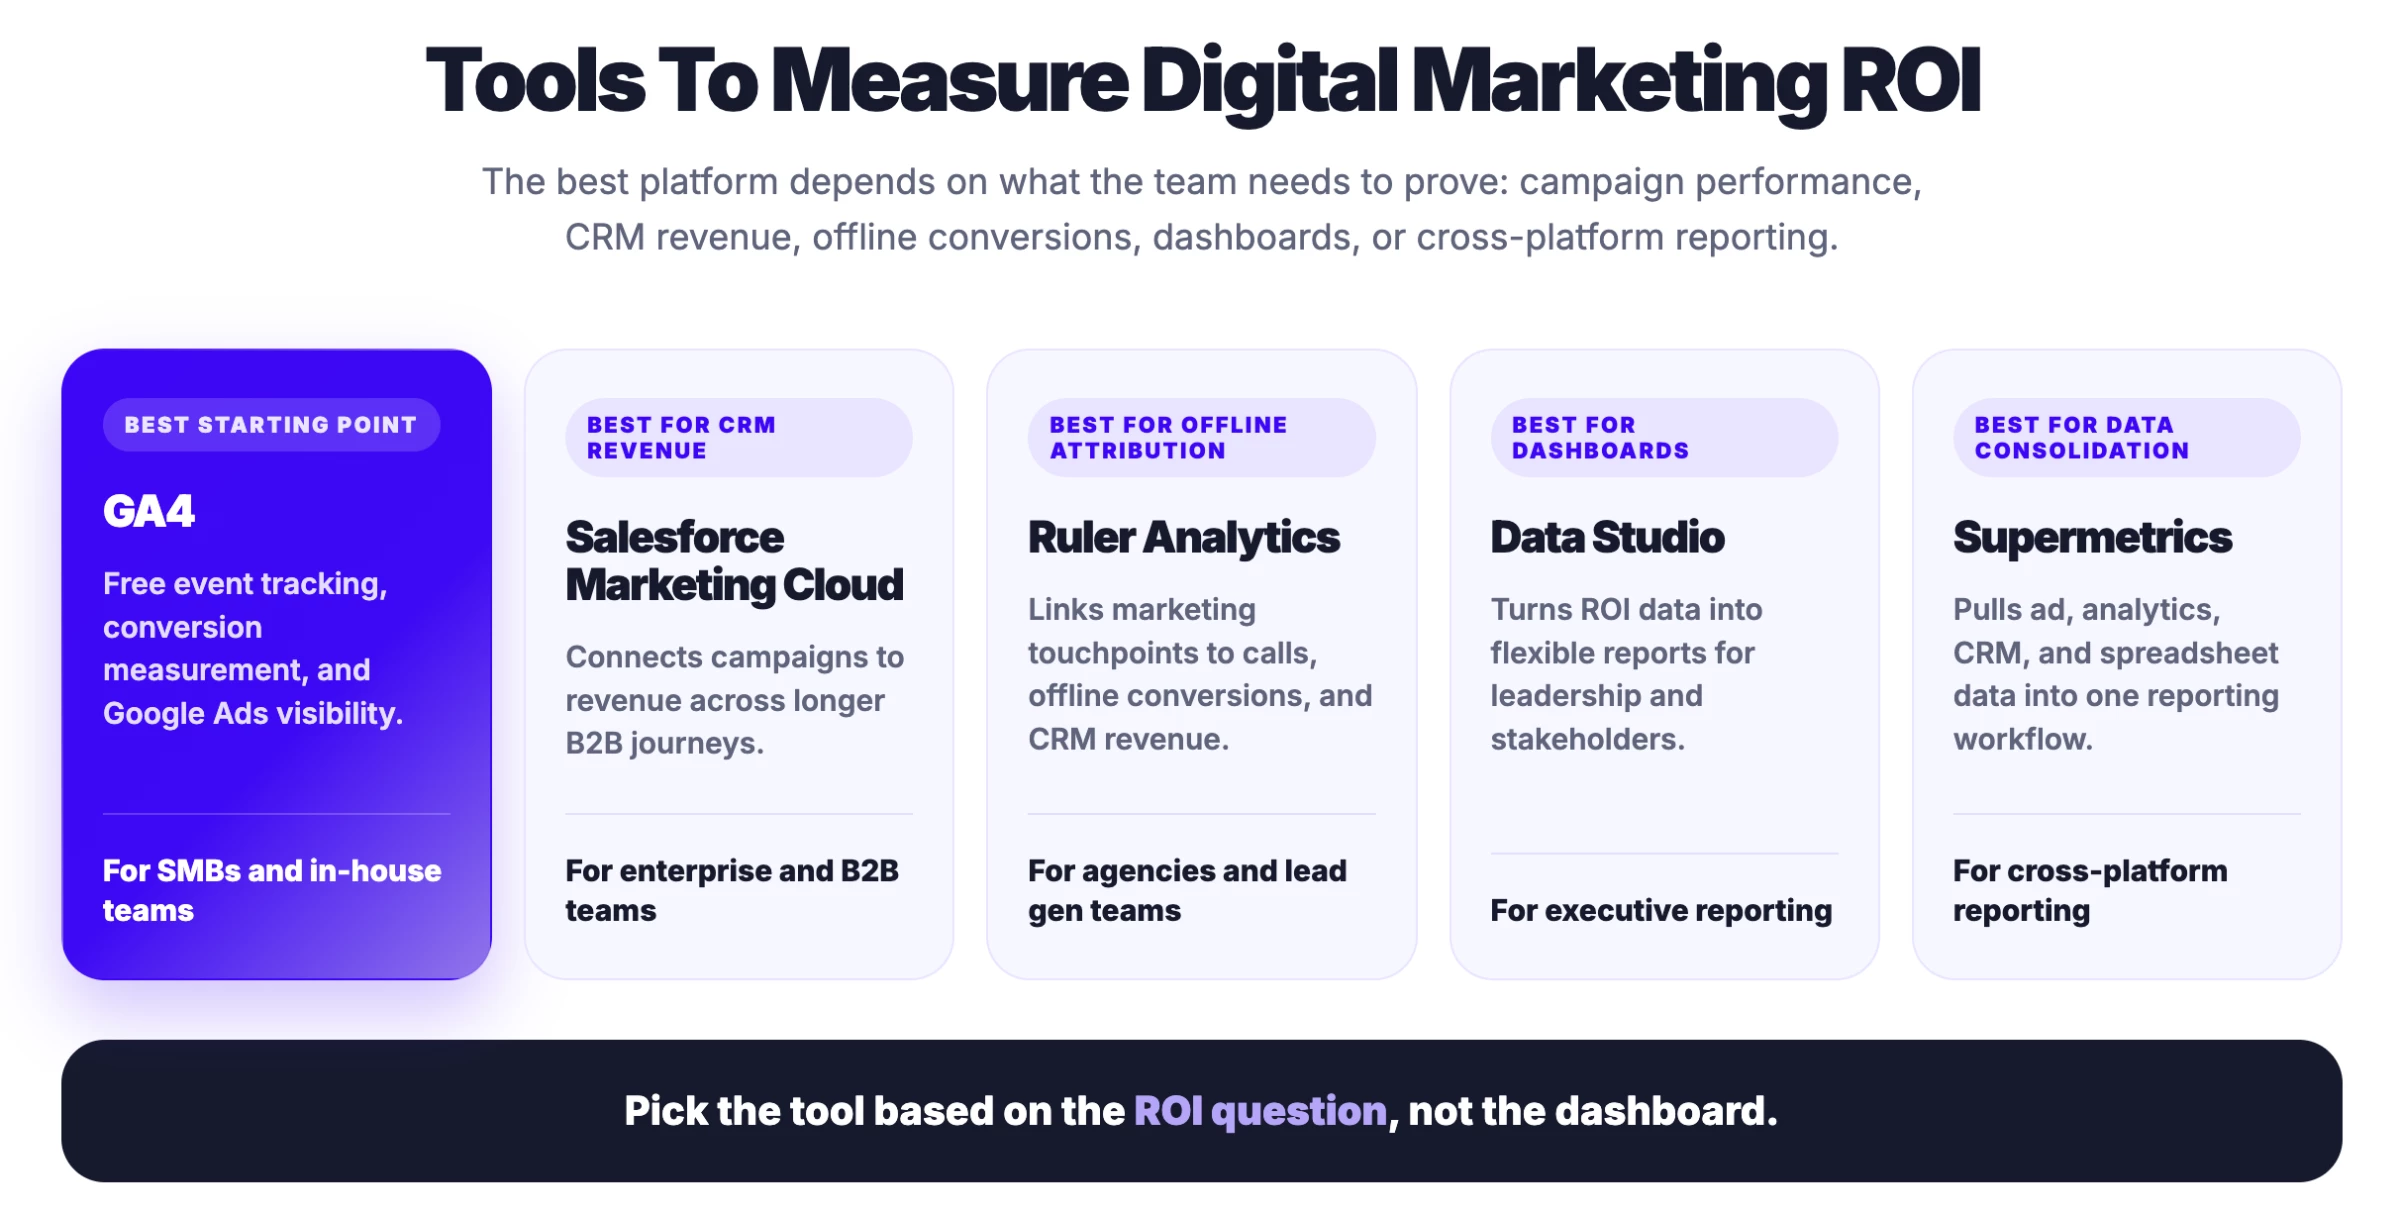 The right choice of ROI analytics platform depends on whether the team needs campaign tracking, CRM-level revenue attribution, dashboard reporting, or cross-platform data consolidation.
Google Analytics 4 (GA4) works well for SMBs and in-house marketing teams that need a free starting point for event tracking, conversion measurement, and Google Ads integration.
- Pros:
- Free to use for most teams
- Strong event and conversion tracking
- Native integration with Google Ads
- Cons:
- Steep learning curve
- Requires careful setup to track ROI properly
- Limited visibility into offline revenue without CRM integration
Salesforce Marketing Cloud is better suited for B2B companies and larger enterprises that need CRM-connected campaign reporting across multiple channels.
- Pros:
- Strong CRM and revenue connection
- Built for complex B2B journeys
- Supports multi-channel campaign reporting
- Cons:
- High cost for smaller teams
- Complex implementation
- Requires clean CRM data to produce reliable ROI insights
Ruler Analytics fits agencies and teams that need to connect marketing activity to offline conversions, phone calls, and CRM revenue.
- Pros:
- Tracks offline and phone conversions
- Connects marketing touchpoints to CRM revenue
- Useful for agencies and lead-generation teams
- Cons:
- Can be expensive for small businesses
- Requires CRM and tracking discipline
- Less useful for simple eCommerce reporting
Data Studio is useful for custom ROI dashboards and executive reporting.
- Pros:
- Free and flexible
- Good for executive dashboards
- Blends multiple Google data sources easily
- Cons:
- Needs connectors for many non-Google platforms
- Dashboard quality depends on data structure
- Can become messy without clear reporting rules
Supermetrics helps teams automate cross-platform ROI reporting by pulling data from ad platforms, analytics tools, CRMs, and spreadsheets into one place.
- Pros:
- Automates cross-platform data pulls
- Reduces manual reporting work
- Works well with spreadsheets and BI tools
- Cons:
- Requires consistent campaign naming
- Does not fix poor source data
- Adds another paid tool to the reporting stack
How To Track Digital Marketing ROI Without Third-Party Cookies
@attentivehq say goodbye to third-party cookies! 🍪 here’s how marketers are adapting to a cookieless future. #marketingdigital#dataprivacy#zeropartydata#generativeai#marketingstrategy#privacymatters#digitalmarketingsecrets#marketingtiktok#marketingagency#googletricks#brandstrategy#emailmarketing#smsmarketing#emailmarketingtips♬ Dance You Outta My Head - Cat Janice
Safari and Firefox have blocked third-party cookies for years, Apple's privacy changes broke deterministic mobile attribution, and Google's evolving Chrome controls keep shrinking what cross-site tracking can see.
There's no single replacement for the cookie. Modern ROI measurement is intentionally layered, with each layer answering a question the others can't.
- Server-side tracking, including conversion APIs like Meta's CAPI and Google's Enhanced Conversions, captures what browser tracking misses. Conversions are sent directly from your server to the ad platform, bypassing ad blockers, ITP, and cookie restrictions that strip data from client-side pixels.
- First-party CRM data connects anonymous sessions to real revenue. UTM parameters tag the visit, the CRM records the lead, and closed-deal data closes the loop back to the campaign that sourced it. This is the only layer that ties marketing activity to booked revenue, not platform-reported conversions.
- Incrementality testing answers the question neither of the above can: would this sale have happened anyway? A test-and-control market design measures actual channel contribution without needing to track individual users at all.
These three layers, paired with attribution modeling for tracked journeys and MMM for portfolio-level allocation, are how mature programs now measure ROI. No single replacement exists by design.
How To Improve ROI in Digital Marketing
Improving ROI in digital marketing means changing one or more of the three variables in the formula, like lowering cost, raising revenue, or, ideally, both at once.
Use the diagnostic below to find your leak first, then apply the lever that matches.
Where's the Leak in Your ROI?
Whichever statement is closest to true for your program points to the lever to start with:
| We're spending in places we can't prove are working. | Lever 1: Cut what doesn't earn |
| Our best channels are getting more expensive every quarter. | Lever 2: Reallocate from saturated to underfunded |
| We have enough traffic; not enough of it converts. | Lever 3: Improve conversion rate |
| Our CAC is fine, but we lose customers too fast to make it back. | Lever 4: Increase customer value |
| We're stuck paying for every visitor. | Lever 5: Build compounding channels |
Most programs have more than one leak. Work through the levers in the order above, that's roughly the sequence of biggest, fastest impact for the average team.
Lever 1: Cut What Doesn't Earn
What it does to ROI: Lowers cost without losing revenue.
The biggest, fastest ROI wins typically come from here, and they're the only kind of win you can take without adding work.
Use it any time your team can't articulate, with evidence, why a specific line of spend exists or what would happen if it stopped.
What to do:
- Run a kill-list audit. For every active channel, campaign, and tool, ask: If we paused this for 30 days, what would happen to revenue? If no one can answer with evidence, test it.
- Use hold-out tests before cutting where possible. A geo-based pause or cohort test can show within weeks whether a channel is driving real value. The Apple Federal Credit Union case showed roughly $100,000 in low-value local and broadcast media that could be cut without hurting performance.
- Review platform settings that quietly inflate spend, including broad match, automatic placements, audience expansion, and aggressive bid caps.
- Cancel tools nobody uses. Audit the marketing stack quarterly and cut anything with no logins in the last 60 days.
Lever 2: Reallocate From Saturated to Underfunded
What it does to ROI: Holds total cost constant but moves each dollar to higher-yield work.
Most programs are simultaneously overfunding saturated channels and underfunding channels that would convert more if they were fed.
Use this lever when blended ROI is acceptable, but channel performance is uneven, or when a winning channel's cost per result keeps rising despite the team optimizing it.
What to do:
- Find the point of diminishing returns. For each major channel, review how cost per result changed as spend increased over the last 6-12 months. If costs rise as spend grows, the next dollar is doing less work.
- Look for under-credited channels. Click-based reporting often undervalues content, email, and other channels that assist conversions instead of closing them. The paid search reattribution example from Step 4 shows this clearly, with search losing credit while email and content gained.
- Move budget gradually. Shift 10-20% from saturated channels into underfunded ones, hold for a full reporting cycle, and judge the impact by total program ROI instead of channel ROAS.
The hardest part of this lever is psychological. Pulling spend off a channel the team has been celebrating feels wrong even when the math says it's correct.
As Silverback Strategies puts it in the MMM section: "It feels wrong in the moment. The numbers are consistent."
Lever 3: Improve Conversion Rate
What it does to ROI: Holds traffic and cost constant but extracts more revenue from each visitor.
CRO is the highest-leverage place to invest when traffic is already established, because a single conversion improvement lifts ROI across every channel feeding that page.
Use it when paid and organic traffic is meeting expectations, but lead, signup, or purchase volume isn't keeping pace.
What to do:
- Diagnose with behavior data. Heatmaps, session replays, and form analytics show where users hesitate, skip, or abandon, from hidden CTAs to form fields that cause drop-off.
- Test the highest-impact elements first. Headlines, CTA copy and placement, form length, trust signals, and pricing presentation usually affect conversions more than full visual redesigns.
- Tie micro-conversions to pipeline. Track the steps before revenue, such as newsletter signups, downloads, demo requests, and add-to-cart actions, to see where momentum breaks.
- Run tests long enough to trust them. Set sample size upfront and avoid calling winners too early based on weak data.
Lever 4: Increase Customer Value
What it does to ROI: Holds acquisition cost constant but raises the revenue side of the formula.
The cheapest customer to acquire is the one you already have.
Use this lever when CAC is competitive, but CLV is short, or when your CLV:CAC ratio is below 3:1.
What to do:
- Stop churn at the source. Find where churn clusters, such as the first 30-90 days, second purchase window, or renewal period, then invest in onboarding, education, and proactive support there.
- Trigger expansion by behavior. Cross-sell, upsell, and upgrade flows work better when based on usage or value signals instead of fixed timelines.
- Reward retention behaviors. Segment loyalty offers for first-time repeat buyers, frequent users, and at-risk accounts so each group gets a reason to stay.
- Measure CLV, not just AOV. Average order value captures one transaction, while customer lifetime value shows the full relationship.
Bain & Company found that A 5% increase in customer retention can lift profits by 25% or more. For most programs, retention is the largest unrealized ROI lever and it's almost always cheaper than buying the equivalent revenue through new acquisition.
Lever 5: Build Compounding Channels
What it does to ROI: Lowers blended CAC over time by reducing dependence on paid traffic.
Paid channels stop producing the moment you stop paying, but organic content, SEO, and brand search keep producing.
Use this lever when paid CAC is rising faster than CLV, and when the business has the budget patience to invest now for ROI 6-12 months out. This one doesn't help in the next quarter, but it rather changes the shape of the program in the next year.
What to do:
- Prioritize commercial-intent SEO. Build pages around searches like project management software, CRM pricing, accounting software comparison, best payroll service, or SEO agency in Chicago before broad educational content.
- Keep the technical foundation solid. Core Web Vitals, mobile experience, internal linking, and structured data help strong content rank instead of stall.
- Tie content to pipeline in your CRM. Track which pages appear in closed-won journeys, not just which ones get traffic.
- Answer the buyer’s real question. Winning commercial pages address the specific concern blocking the purchase, from cost and fit to proof and alternatives.
![]()
We evaluate agencies across the globe to connect you with the most capable partners. Explore our Agency Directory to discover the top digital marketing agencies, along with:
- Top SEO Agencies
- Top PPC Agencies
- Top Email Marketing Agencies
- Top Media Buying Agencies
- Top Digital Marketing Agencies In Portland
How to Calculate and Improve Your Digital Marketing ROI FAQs
1. How does ROAS differ from ROI?
ROAS measures revenue from ads divided by ad spend. ROI includes all marketing costs, including salaries, tools, content, and agency fees. ROAS is useful for paid-channel efficiency; ROI is the right metric for program- or board-level reporting.
2. What's a good ROI for digital marketing?
A 5:1 ratio is widely considered strong, and 10:1 is exceptional. The right benchmark depends on your industry, margins, and stage. High-margin businesses can sustain higher thresholds; low-margin or commodity businesses may treat 3:1 as a healthy result.
3. Can conversion rate optimization alone boost ROI?
Yes. Improving conversion rates without adding traffic reduces acquisition costs and lifts ROI directly. CRO is often the highest-leverage early investment for teams with established traffic.
4. How long does it take to see positive ROI from digital marketing?
It depends on the channel. Paid search and paid social can produce measurable returns within weeks. SEO and content marketing typically take 3-9 months to show positive ROI but compound over time. Long-cycle B2B may take a quarter or more before attributed revenue appears.
5. How to measure digital marketing ROI without cookies?
Use a combination of server-side tracking and Conversion APIs, first-party data tied to your CRM, modeled attribution, incrementality testing for channel-level truth, and Marketing Mix Modeling for portfolio-level allocation. No single replacement exists as modern measurement is layered by design.
6. When should a team move from attribution to Marketing Mix Modeling?
When you have several years of clean, granular marketing data and meaningful variance in spend across channels. If you can't meet that bar, start with incrementality testing as it's faster to stand up and produces actionable results on a per-channel basis.
7. What's the difference between attribution and incrementality testing?
Attribution distributes credit across tracked touchpoints in a conversion path. Incrementality testing uses a test-and-control market design to measure whether a channel produces sales that wouldn't have happened without it.
8. What digital marketing metrics should I track alongside ROI?
- ROI tells you whether a program worked, but a handful of companion metrics tell you why.
- ROAS isolates paid-media efficiency by measuring ad revenue against ad spend only.
- CAC flags whether you're paying too much to win each customer, even when ROI looks healthy.
- CLV reveals whether the return holds up over the full customer relationship, which is critical when first-purchase revenue is modest.
- CPL and lead-to-close conversion rate diagnose whether the problem is demand efficiency or sales conversion when leads aren't producing customers.
- Conversion rate by channel shows which traffic sources are bringing buyers versus browsers.