PPC campaigns live or die by how well you track them. In a $351-billion industry, even minor data blind spots can lead to seven-figure budget misfires. We'll give you the tools and strategies to stop guessing and start scaling with confidence.
PPC Tracking: Key Points
- Marketers lost $84B to ad fraud in 2023, or 22% of global ad spend, yet most brands still operate with fragmented or misconfigured tracking systems.
- Brands using GA4 Enhanced Conversions and Meta’s Conversions API see up to 20% better conversion attribution.
- Companies with integrated CRM and PPC tracking report 30% to 50% higher lead-to-close visibility, enabling more accurate modeling and better forecasts.
PPC Tracking Overview
This article breaks down the strategic playbook for PPC tracking in 2025: powerful tools, mission-critical KPIs, common pitfalls, and privacy compliance.
How Accurate PPC Tracking Drives Business Growth
More than 70% of executives say real-time data analytics are essential for staying competitive — and that starts with tracking pay-per-click (PPC) campaigns effectively.
Far from a technical afterthought, PPC tracking is a strategic engine for ROI visibility, budget efficiency, and full-funnel accountability.
@danielhazan123 Conversion tracking helps scale for profitablility. Dont miss out on this important action item when setting up your account. #googleads#digitalmarketing#conversiontracking#ppc#onlineadvertsing#paidadvertisment♬ original sound - Daniel Hazan
- Real-time visibility drives faster optimization: Accurate tracking delivers instant performance data, so marketing teams can pause underperforming ads and reallocate spend. This agility improves ROAS, reduces waste, and aligns outcomes with growth goals.
- Attribution accuracy improves budget confidence: Multi-touch attribution tools clarify which channels drive revenue across the full customer journey. This evidence-based insight strengthens CFO and CMO alignment and justifies long-term PPC investments.
- Transparent tracking builds business credibility: When PPC campaign reporting connects directly to revenue, marketing becomes a strategic growth driver. Being clear about results helps executives and clients feel more confident.
Top PPC Tracking Tools in 2025
When leveraged correctly, PPC tools align cross-functional teams, inform executive budgeting, and drive higher ROI across digital campaigns. Below are the most impactful ones shaping PPC performance in 2025.
1. Google Ads & GA4
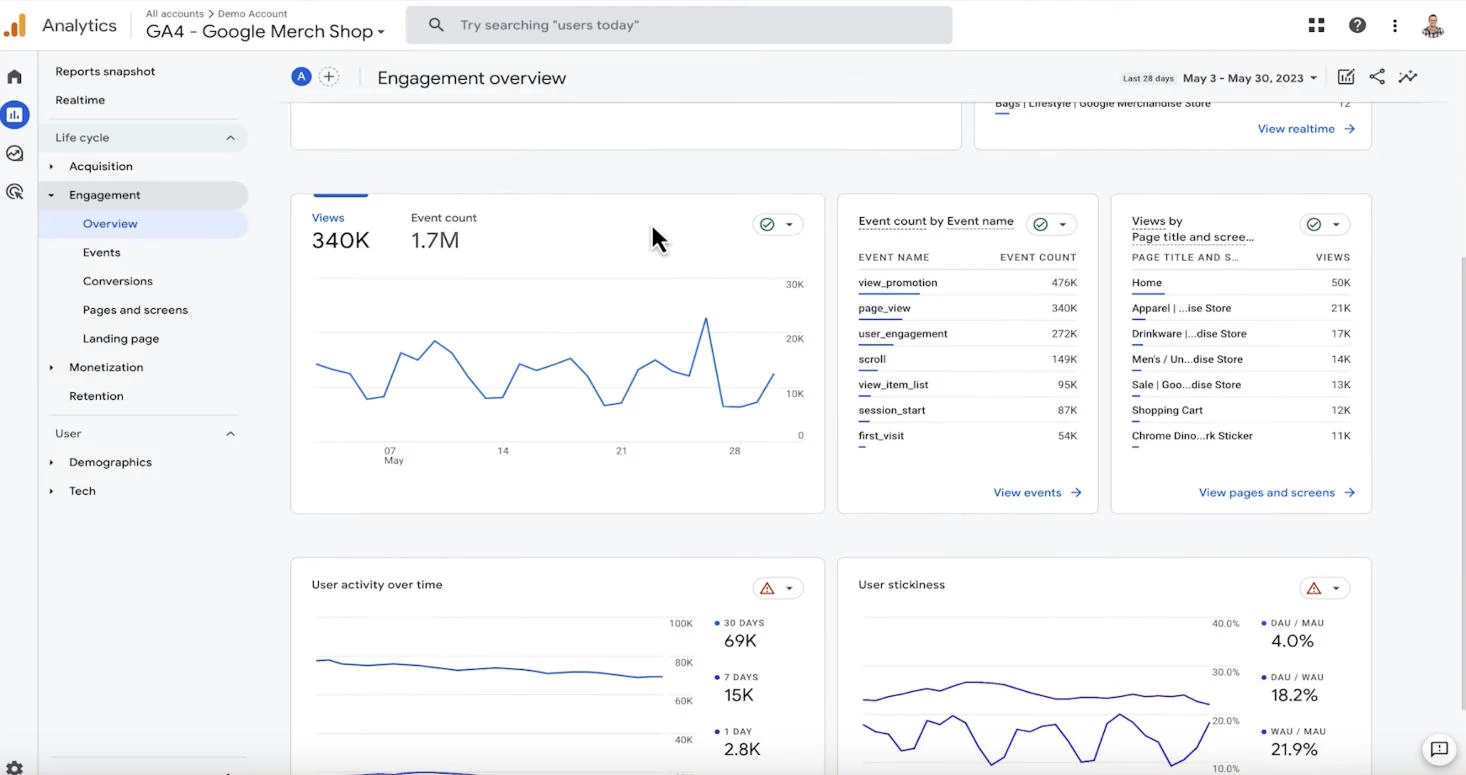
Google Ads, paired with Google Analytics 4 (GA4), offers a unified ecosystem that reveals not just where clicks happen, but why conversions do. For business leaders, this integration offers clear ROI attribution across channels, touchpoints, and even offline interactions.
GA4’s event-driven model enables marketing teams to track every interaction in real time, while Enhanced Conversions and CRM syncing close the loop between marketing performance and actual sales. Executives gain visibility into qualified leads, deal value, and full-funnel ROI.
Key Features:
- Event-based tracking across web and app
- Native GA4 and Ads integration with shared audiences
- Offline conversion import and enhanced conversion support
- CRM integration with platforms like Salesforce
- Attribution reporting for smarter budget decisions
2. Meta Ads Manager
Meta Ads Manager delivers conversion insights beyond basic clicks, which is ideal for brands seeking precise engagement data across Facebook and Instagram. Executives can understand how ad exposure contributes to real-world sales outcomes, not just impressions.
Meta Pixel and Conversions API combine to link online behavior with offline results. Marketing teams can track micro-interactions like Add-to-Cart or Lead submissions, then use ranked event tracking to prioritize business-critical conversions even in privacy-limited environments.
Key Features:
- Meta Pixel for behavioral tracking across ecommerce actions
- Conversions API for offline attribution and CRM syncing
- Aggregated Event Measurement for iOS privacy compliance
- Revenue-optimized event prioritization
- Multi-platform campaign reporting for Facebook, Instagram, and more
3. Google Tag Manager (GTM)
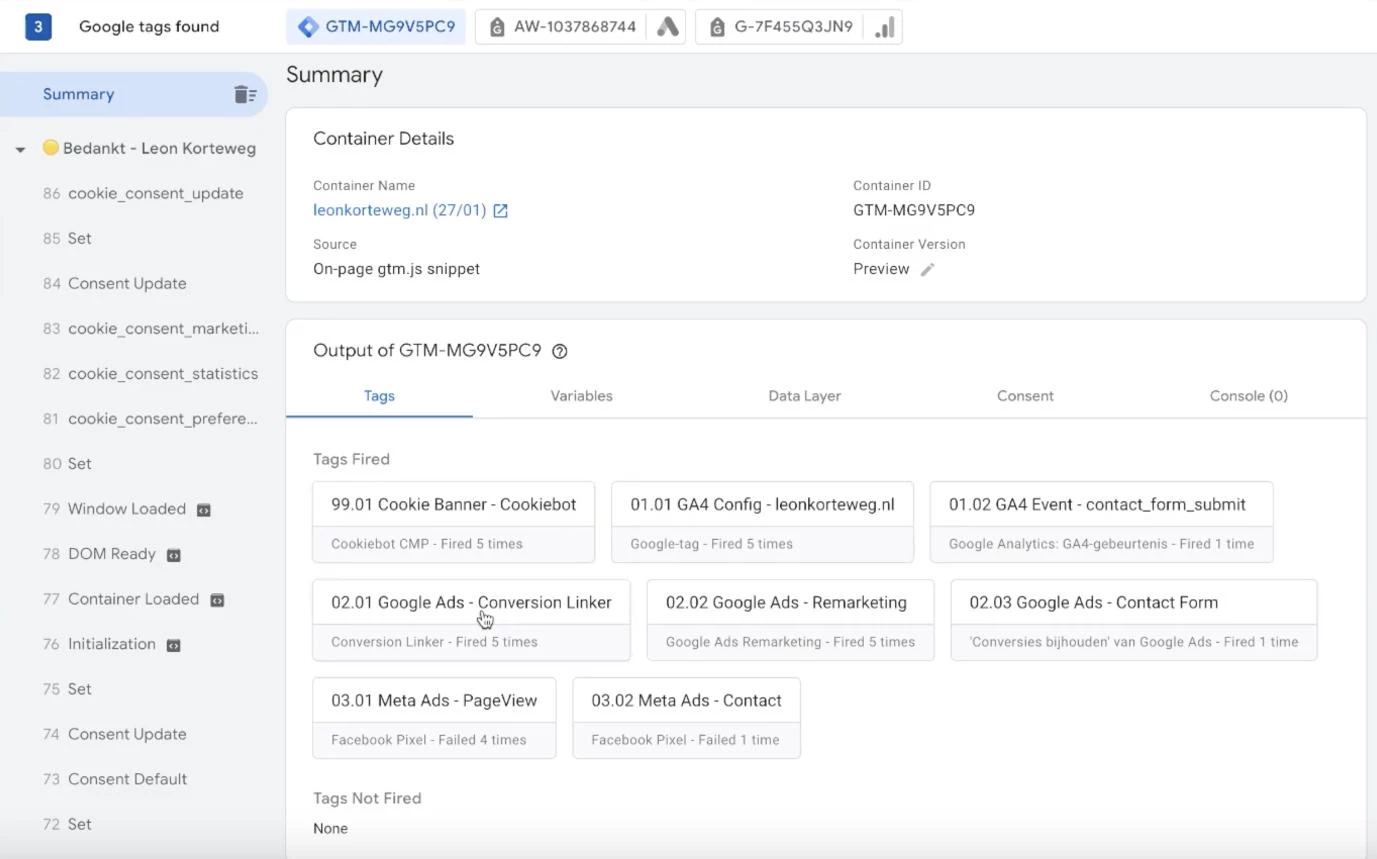
Google Tag Manager (GTM) allows marketing teams to deploy and manage tracking tags quickly without developer bottlenecks. It enables faster PPC campaign launches and consistent data collection — a must-have for multi-site businesses and growth-stage brands.
With its dataLayer and trigger logic, GTM empowers teams to set up complex tracking workflows tailored to business needs. From error-free tag debugging to granular user permissions, it ensures data governance and speed on one platform.
Key Features:
- Centralized tag management across platforms
- Built-in Preview & Debug mode for QA
- Custom triggers using dataLayer events
- Version control and user permissioning
- Reduced reliance on dev teams for tag deployment
4. Third-Party Attribution Tools
For marketing teams managing multi-channel funnels, native ad platform data often fails to capture the full customer journey. Third-party attribution tools provide visibility and ROI clarity so you can allocate budget effectively and scale campaigns with confidence.
Some top options include:
- Hyros: Delivers multi-touch attribution across ads, email, and webinars using a proprietary pixel, enabling real-time revenue tracking and ad platform optimization for long-cycle, high-ticket funnels.
- Wicked Reports: Connects CRM and order data to attribute revenue from first click to sale, offering LTV-focused, finance-grade ROI insights across Google, Meta, Shopify, and more.
- SegMetrics: Tracks revenue by lead source and customer behavior, helping SaaS and funnel-driven brands prioritize high-LTV channels through advanced cohort and attribution analysis.
5. AI & Automation Tools
As the PPC landscape evolves, AI-powered PPC tools are reshaping how teams track, predict, and act on performance data. High-level automation reduces manual reporting overhead and helps teams make more informed choices based on real-time campaign intelligence.
- Northbeam: This uses machine learning to attribute revenue across channels by modeling user behavior from the first click to purchase. Its predictive dashboard helps leadership teams understand ROI trends, forecast spend efficiency, and justify budget reallocation.
- Triple Whale: Specifically designed for eCommerce, it unifies ad platform data, first-party tracking, and post-purchase behavior. Its AI engine delivers blended attribution, cohort tracking, and LTV insights that help marketing leaders scale spend with confidence.
- SegmentStream: This leverages predictive conversion modeling to close attribution gaps caused by privacy restrictions. By analyzing session-level data and behavior patterns, it can help you optimize media spend even when direct conversion tracking is blocked.
Key PPC Metrics for Executive Decision-Making
To drive profitable ad spend and defend budgets in the boardroom, business leaders need visibility into the metrics that matter. These KPIs translate campaign activity into revenue signals, making it easier to align performance with business outcomes and long-term growth goals.
| Metric | What It Measures | Why It Matters |
| Impression share | % of eligible ad impressions won | Reveals competitiveness in auctions |
| CTR (click-through rate) | % of impressions that become clicks | Signals ad relevance & audience fit |
| CPC (cost per click) | Avg. cost paid per ad click | Controls cost efficiency |
| CVR (conversion rate) | % of clicks that convert | Tracks landing page & funnel performance |
| CPA (cost per acquisition) | Cost to acquire one conversion | Measures lead/sale efficiency |
| ROAS (return on ad spend) | Revenue earned per $1 of ad spend | Measures profitability at campaign level |
| Quality score | Google’s relevance & experience score | Impacts CPC & ad rank |
| Bounce rate | % of users who exit after landing | Indicates traffic quality & landing page issues |
Strategic Highlights:
- High Impression Share + Low CTR = Poor message-market fit. You’re winning auctions but failing to engage; revisit ad copy, creative, and value proposition to better match audience intent.
- Low Bounce Rate + Low Conversion Rate = Good traffic, broken funnel. Users are staying but not converting; audit the conversion path, test new CTAs, and streamline form or checkout friction points.
- High ROAS + Low CVR = Strong monetization, but possible funnel drop-offs. Revenue is healthy despite weak conversion rates; investigate pre-click targeting and post-click user experience to improve lead or sale volume.
- High CTR + Low ROAS = Strong engagement, but poor conversion alignment. Your ads are compelling but not profitable; refine targeting, tighten offer relevance, and qualify traffic more effectively.
- Low Quality Score = Missed efficiency gains and wasted budget potential. You’re overpaying for exposure; align PPC keywords, ad copy, and landing page experience to boost ad rank and lower CPC.
Jeff Carterson, founder of marketing agency SevenCube, says relevance is critical for ideal PPC ad performance:
“High-quality, targeted PPC ad copy, ad extensions that add value, and optimized landing pages ensure the user experience is seamless and relevant. Ultimately, if you’re delivering exactly what someone is looking for, they don’t care if it’s an ad.”
Best Practices to Set Up Bulletproof PPC Tracking
Global investment in PPC is accelerating, with search ad spending expected to exceed $351 billion by 2025. This growth reflects not only increased budget pressure, but also the need for smarter, full-funnel tracking.
As brands scale paid media, precision in setup separates high-growth campaigns from costly guesswork.
To support accountable performance and revenue-driven marketing, here are three critical PPC tracking practices every executive team should align around:
- Use structured UTM tagging
- Implement cross-device and offline tracking
- Establish a centralized reporting and attribution model
- Integrate CRM and sales data
- Run QA checks routinely
1. Use Structured UTM Tagging
Inconsistent tracking data breaks campaign visibility and weakens executive trust. UTM tags ensure every click is correctly attributed to its source, campaign, and medium, making dashboards cleaner and decision-making faster.
Actionable steps include:
- Enforce a consistent naming convention (e.g., all lowercase, no spaces) across all UTM parameters.
- Document your UTM framework and share with all marketing, paid media, and content teams.
- Use tools like UTM.io to save tag templates and reduce manual errors.
- Use dynamic URL builders in platforms like Google Ads to automate and scale tracking tags.
2. Implement Cross-Device and Offline Tracking
The modern buyer journey spans multiple devices, sessions, and even in-person interactions. To measure true ROI, you need to connect online ads to offline conversions and stitch together fragmented touchpoints.
To achieve this:
- Enable Enhanced Conversions to capture privacy-compliant first-party data across sessions and devices.
- Use call tracking software (e.g., CallRail) to track phone leads and integrate results into your CRM.
- Set up offline conversion imports in Google and Meta to link store sales or CRM outcomes to original ad clicks.
- Automate your upload workflows to ensure consistent attribution back into PPC platforms.
3. Establish a Centralized Reporting and Attribution Model
Without a shared attribution framework, marketing, finance, and leadership teams often work from conflicting data. Centralizing your attribution model creates a single source of truth for evaluating channel performance and making budget decisions with confidence.
Follow these steps:
- Select a primary attribution model (e.g., data-driven, first-click) and align all reporting tools and teams around it.
- Use GA4, Looker Studio, or your BI platform to consolidate cross-channel performance into unified dashboards.
- Annotate discrepancies between ad platforms and analytics to contextualize performance reports.
- Include ROI-focused KPIs (e.g., ROAS, CAC, LTV:CAC) in executive dashboards to support strategic planning.
4. Integrate CRM and Sales Data
Tracking clicks and leads is only half the equation. Integrating your PPC data with CRM systems like Salesforce allows marketing and leadership to tie spending directly to closed revenue, pipeline growth, and customer lifetime value.
Actionable steps include:
- Pass campaign source data (via UTMs or hidden fields) into your CRM during lead capture.
- Set up automated workflows or integrations to sync lead and deal status back into ad platforms.
- Track downstream KPIs like lead-to-close rate, revenue per campaign, and deal velocity by channel.
- Use closed-loop data to inform budget allocation, bid strategies, and sales/marketing alignment.
5. Run QA Checks Routinely
Even robust tracking systems degrade over time due to platform updates, website changes, or human error. Routine quality control and PPC audits prevent silent failures that misguide budget decisions or erode leadership confidence in reports.
Here are steps to take:
- Use tools like GTM Preview, Tag Assistant, and Meta Pixel Helper to validate each tag before and after deployment.
- Perform monthly diagnostic audits on high-priority events, forms, and pages across your conversion funnel.
- Audit your GTM containers quarterly to remove redundant tags and resolve trigger conflicts.
- After any major web change, run a full regression test on conversion paths and event tracking to ensure continuity.
Tracking Compliance & Privacy: Safeguarding Data Integrity in a Regulated World
From GDPR and CCPA to iOS privacy restrictions and Google’s Consent Mode, the modern PPC stack must be built not only for efficiency but also for compliance and resilience in a privacy-first era.
Failure to comply risks more than fines. It also compromises the integrity of your analytics.
When tracking is blocked due to lack of consent or poor architecture, conversion data goes dark. This results in underreported ROI, misaligned budgets, and missed growth signals, all of which undermine strategic decision-making.
Key Considerations for Business Leaders and Marketing Teams
- Consent matters: If users don’t consent, you lose visibility. Consent Mode in GA4 allows businesses to collect behavioral data responsibly while honoring user preferences.
- First-party data is non-negotiable: Transitioning from third-party dependency to first-party tracking (via hashed emails, login IDs, etc.) ensures long-term attribution stability.
- Privacy impacts optimization: Without compliant tracking, your PPC platforms lack the data to improve bidding, remarketing, or lookalike modeling, weakening campaign performance.
- Executive risk exposure is real: Non-compliant tracking setups can trigger legal reviews, erode investor trust, or generate media scrutiny, especially for enterprise brands.
Data Privacy Checklist for PPC Tracking Infrastructure
| Priority | Action Item | Recommended Tools |
| Consent compliance | Enable Consent Mode in Google Tag Manager or GA4 | Google Consent Mode v2, Tag Manager templates |
| Cookie banner enforcement | Display cookie banners with granular opt-in/out | Cookiebot, OneTrust, Termly |
| First-party data strategy | Capture hashed email, phone, or user ID | GA4 Enhanced Conversions, Meta CAPI |
| Attribution safeguards | Estimate conversion paths when consent isn’t given | GA4 modeling attribution, SegMetrics, Triple Whale |
| Cross-team alignment | Document data collection policies | Internal SOPs, legal sign-off on tracking infrastructure |
Common PPC Tracking Mistakes That Hurt ROI & Reputation
In 2023 alone, advertisers lost $84 billion to ad fraud, representing 22% of global ad spend. This level of waste highlights a critical truth: sophisticated PPC tracking is a financial imperative. Below are the most damaging PPC tracking mistakes and how you can proactively address them:
- Lack of granularity in goal setup: Tracking only macro conversions hides valuable user behavior insights. Add micro-conversions like scrolls and clicks and study heat maps to diagnose friction points and guide optimization across the full customer journey.
- Misconfigured metrics: Duplicate or inaccurate conversion tracking inflates results and misguides spend. Validate trigger accuracy, remove test data, and audit across platforms to ensure clean, reliable metrics.
- Platform siloing: Using one platform’s data in isolation leads to duplicate crediting and ROI misrepresentation. Consolidate data with a unified attribution model and cross-platform dashboard to inform strategic planning.
- Delayed or missing event tracking: Slow or broken tracking delays critical decisions and hides underperformance. Run QA before launch, monitor real-time dashboards, and set alerts to protect data accuracy and campaign agility.
- Lack of version control or documentation: Without change logs or governance, data gaps often go unnoticed until reporting fails. Use GTM version history, enforce naming conventions, and require documentation or review for any major tracking changes.
PPC Tracking: Final Thoughts
By investing in the right PPC tracking tools, following best practices, and avoiding common pitfalls, you ensure that you never have to fly blind. Instead, you have a trusty compass (your data) to navigate the complex challenges of modern advertising.
As a result, you can turn marketing metrics into growth, and marketing spend into profit, with clear insights most teams don’t have. That is the true ROI of mastering PPC tracking.
![]()
Our team ranks agencies worldwide to help you find a qualified partner. Visit our Agency Directory for the top PPC companies, as well as:
- Top Advertising Agencies
- Top Conversion Rate Optimization Agencies
- Top B2B PPC Agencies
- Top Media Buying Agencies
- Top SEO Agencies
PPC Tracking FAQs
1. Why does PPC performance data vary across platforms?
PPC data varies across platforms due to differences in attribution models, conversion windows, and tracking logic. Each platform favors its own ecosystem, so a single conversion may be counted multiple times unless reconciled through unified attribution and analytics. It's important to align different models to get a truer picture of ROI.
2. How can I track PPC results across multiple business units or regions?
Use Google Tag Manager containers with custom variables and GA4 property filters by brand, region, or business line. Set up a master dashboard in Looker Studio to visualize segmented performance while maintaining global oversight.
3. Is Consent Mode required in GA4 to stay compliant?
While not legally mandated, Consent Mode is highly recommended in GA4 for businesses operating in GDPR/CCPA zones. It enables data collection only after user approval and adjusts model-based reporting for unconsented sessions, protecting both analytics integrity and legal risk posture.