Visuals explain things faster, help us absorb ideas with less effort, and make content far more engaging. Let’s walk through what visual communication is, the different types you can use, real examples that show how it works, and the AI tools that can help you create it confidently.
Visual Communication: Key Findings
- Visual communication makes ideas easier to understand. Duolingo’s TikTok visuals helped drive a 1,400 percent follower increase by simplifying messages through short video.
- Strong visuals lift performance. Sephora’s AR try-on delivered up to 35% higher conversions, proving visuals can directly improve results.
- Visuals speed up decision-making. Uber’s heatmaps guide drivers to high-demand areas in minutes, improving efficiency in real time.
What Is Visual Communication?
Visual communication uses images, videos, diagrams, and other graphics to share information in ways text cannot. It adds clarity and emotion, which helps people understand ideas faster and remember them longer.
A single image can set the tone instantly, and a simple diagram can explain a complex point in seconds. This is why many companies now take a visual-first approach.
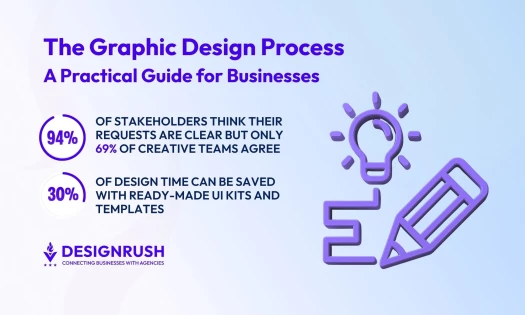
According to Canva’s 2024 report, visual communication enhances ideas articulation by 93%, efficiency by 91% and business performance by 77%.
10 Examples of Visual Communication
Visual communication comes in many forms, and each one plays a different role in how we share ideas, teach concepts, or capture attention.
The following examples show how different visual formats can simplify information, spark emotion, and make messages easier to understand.
- Images: Photos, illustrations, and graphics
- Video: Short form, long form, and live
- Infographics: Visual summaries of data and concepts
- Charts and graphs: Data visualization
- Maps and heatmaps: Spatial visuals
- Symbols and icons
- Diagrams and process visuals
- 3D models and augmented reality
- Typography: Text as visual design
- Interactive and scrollytelling experiences
1. Images: Photos, Illustrations, and Graphics
Images are the simplest and most common form of visual communication. They capture emotion and context faster than text and often serve as the first impression of a brand.
E.l.f. Beauty’s Social-First Visuals

E.l.f. Beauty built a reputation as one of the fastest growing beauty brands through bold, meme-friendly visual content across TikTok and other social platforms, helping it outpace category peers in awareness and sales growth.
Industry profiles credit its visually distinctive, social-first creative as a major driver of its performance.
2. Video: Short Form, Long Form, and Live
Video combines motion, sound, and text. It is ideal for storytelling, demonstrations, and emotional narratives.
Duolingo’s TikTok Content
@duolingo must’ve been the wind…
♬ original sound - trapceleb
Duolingo leans heavily on short form video and humorous visual storytelling on TikTok.
A TikTok case study reported a follower base increase of more than 1,400%, more than 90 million video views, and click through rates 39% above benchmark for education campaigns.
This sort of performance is why video content is now a core pillar of many brands’ visual communication strategy.
3. Infographics: Visual Summaries of Data and Concepts
Infographics mix icons, charts, illustrations, and short text blocks to explain a topic quickly. They are highly shareable and ideal for thought leadership pieces, reports, and educational content.
Global Health Infographics from WHO

The World Health Organization (WHO) frequently uses infographics to communicate public health guidance, such as vaccination and hygiene recommendations.
These visuals help distill complex guidelines into simple steps that work across languages and literacy levels.
Engagement data from campaigns during global health crises shows significantly higher share rates and understanding when information is presented visually.
4. Charts and Graphs: Data Visualization
Charts and graphs turn numbers into patterns. They highlight trends and comparisons in a way that is much easier to understand than raw tables.
Apple’s Product and Platform Keynotes

Apple often uses clean line charts and bar graphs during its events to show metrics such as adoption rates, satisfaction scores, and performance improvements.
While Apple does not always share engagement metrics for these charts, they are a central part of how the company explains complex technology in a way that is easy to grasp for a broad audience, from developers to consumers.
5. Maps and Heatmaps: Spatial Visuals
Maps communicate geographic or spatial relationships. They are used in navigation, logistics, and user behavior analysis.
Uber’s Demand Heatmaps
@drivermatty Uber has announced a new in-app feature for its UK drivers called the ‘Rides Heatmap’, which aims to help drivers locate high-demand areas, reduce idle time, and potentially increase earnings. According to an in-app message sent to Uber drivers, the heatmap will show colour-coded zones where rider demand is higher and indicate expected wait times for trips. The message states: “Soon, you’ll be able to see where it’s busy, what wait times to expect, and areas where you could earn extra with easy-to-read warm colours.” #uber#uberdriver#ubersurge#uberupdate#heatmap♬ original sound - Driver_Matty
Uber’s driver and courier apps include delivery heatmaps that visually indicate hotspots where demand is highest.
These maps update approximately every ten minutes to guide drivers toward busy areas, improving their earning potential and making the system more efficient overall.
6. Symbols and Icons
Symbols and icons condense meaning into very small visual units. They are essential for interfaces, signage, and quick comprehension across languages.
TikTok’s Safety and Content Labeling Icons
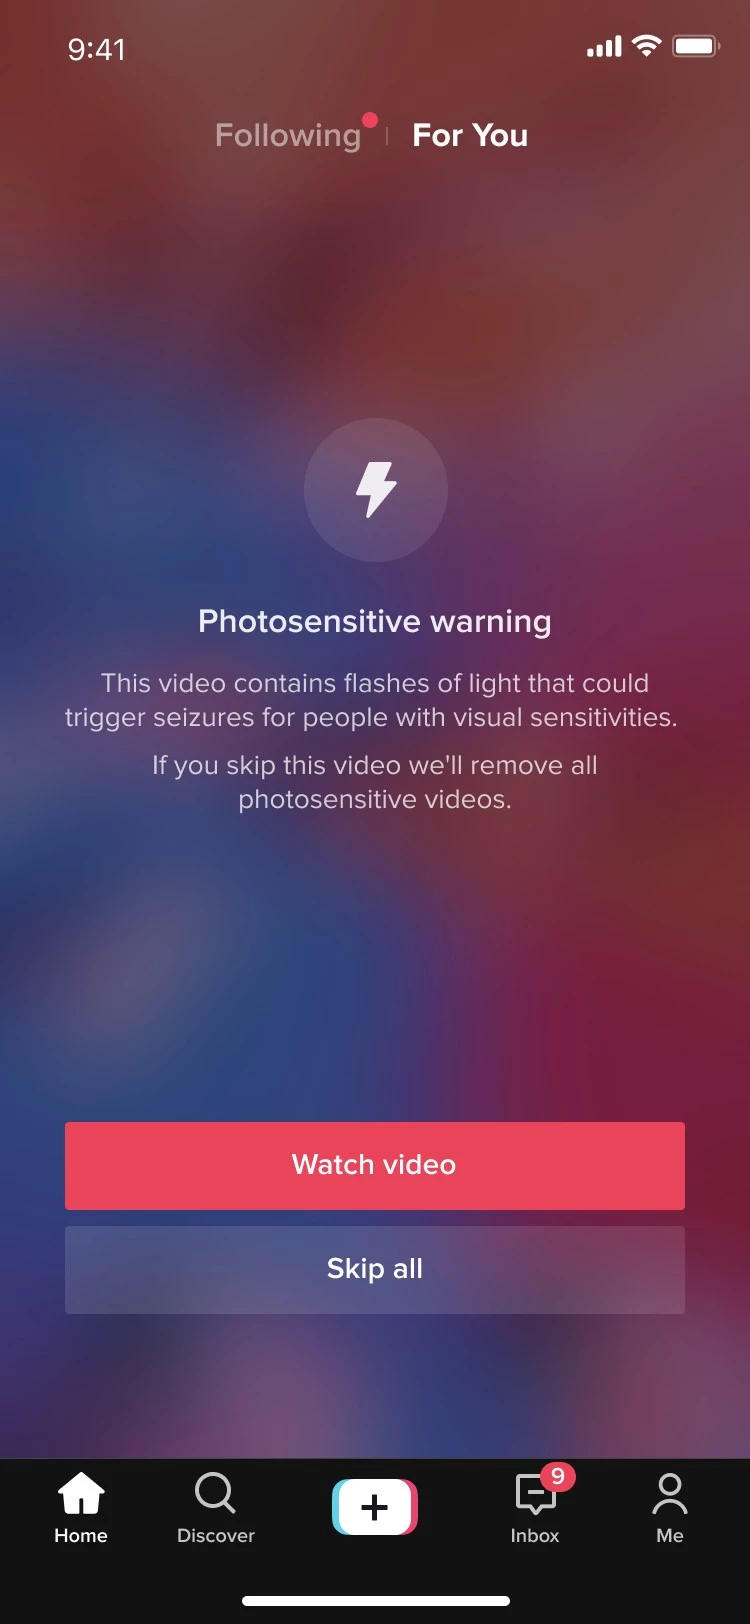
TikTok continues to refine its safety and content labeling system using icons and visual warnings so that users can quickly see when there is sensitive content, advertising disclosure, or safety features enabled.
Simplified icon based communication improves user understanding even in global markets with diverse languages.
7. Diagrams and Process Visuals
Diagrams explain how parts fit together or how a process flows. They include flowcharts, system diagrams, organizational charts, and assembly instructions.
IKEA Assembly Diagrams
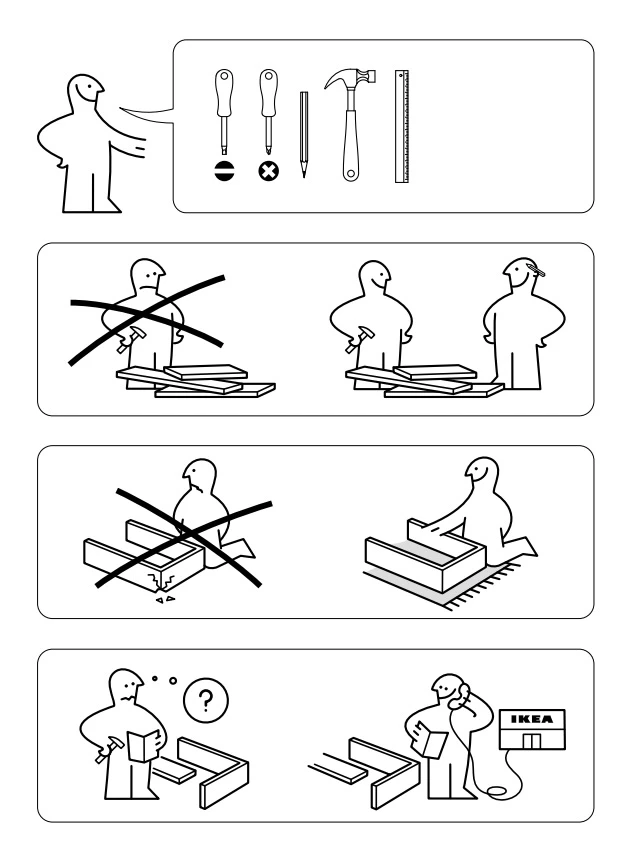
IKEA’s wordless assembly instructions rely entirely on diagrams.
Clear illustrations, arrows, and step by step visuals make it possible for customers worldwide to assemble furniture without text.
Design case studies frequently reference IKEA as a model of visual communication that reduces support requests and returns by eliminating language barriers.
8. 3D Models and Augmented Reality
3D and AR visuals help users understand products in context. They are especially powerful in eCommerce, architecture, and product design.
Sephora’s AR Virtual Try On
View this post on Instagram
Sephora’s Virtual Artist and AR mirrors allow customers to try on makeup virtually.
Case studies report that the AR try on experience led to conversion lifts of up to 35%, a 25% increase in add to basket rate, and in some analyses more than 100 % uplift in conversions compared to non AR journeys.
This is a clear example of visual communication directly improving commercial results.
9. Typography: Text as Visual Design
The way you arrange and style text can also communicate specifics, conveying tone and improving readability.
In addition to making written content look more aesthetic, it also affects how the reader perceives the message, whether it’s casual, urgent, or formal.
Typography can also help enhance the overall effectiveness of communication and guide the reader’s eyes to the desired places.
Netflix’s Custom Typography
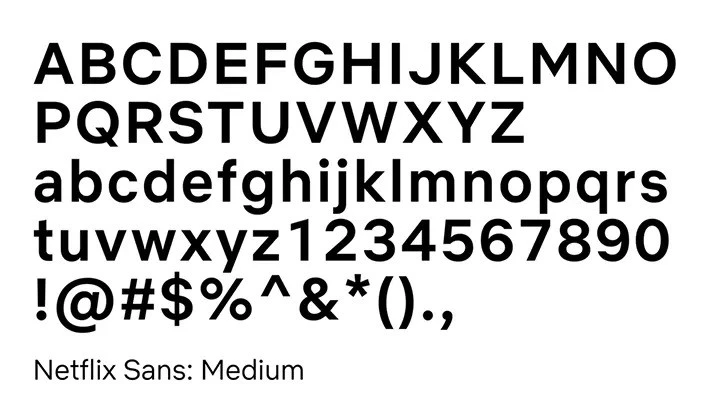
Netflix introduced and then refined its custom typeface, Netflix Sans, to create a consistent visual language across product UI, key art, and marketing.
This reduces licensing costs and strengthens brand recognition, since every headline, menu label, and promo uses the same recognizable typographic style.
As Brittney Murphy, Owner of Brittney Murphy Design, puts it, “with an exclusive font, your business can be recognized in more contexts and with more subtlety,” which is exactly why brands like Netflix invest in owning their visual voice at the letterform level.
10. Interactive and Scrollytelling Experiences
Interactive formats combine multiple visual types into a story that unfolds as the user scrolls or interacts.
Cristina Marcos, Head of Corporate Communications, PR, and Events at Genially, notes that “a person who interacts with a piece of content is the opposite of a passive spectator, since they live an experience.”
This is what makes interactive visual communication so powerful.
She also points out that interactive visual content “appeals directly to our biology,” because we are “visual and interactive beings by nature” who are naturally driven to explore.
The New York Times’ Snow Fall

Snow Fall showed how powerful scrollytelling can be when visuals and narrative work together.
As readers moved through the story, the page triggered animations, topographic maps, and embedded video that matched the pacing of the avalanche being described.
The results were unprecedented at the time: 3.5 million page views and 2.9 million unique visitors in six days, with nearly one third being new readers to NYT.com.
Principles and Best Practices of Visual Communication
According to Canva’s report, a visual-first approach provides higher efficiency, better collaboration, and a positive return on investment (ROI).
These principles and best practices explain how to create visuals that support those outcomes and help your message land with clarity and impact.
- Lead with clarity
- Embrace simplicity
- Build a consistent visual language
- Create strong visual hierarchy
- Use color and contrast with purpose
- Tell a story, not just a fact
- Avoid clutter and competing messages
- Test visuals with real users
1. Lead With Clarity
A visual should communicate its main message within a few seconds. If someone has to stop and decode what they are seeing, the design is not working as intended.
Remove elements that do not support the idea you want to communicate.
Clarity matters as 89% of leaders believe visuals make their message clearer and easier to understand.
2. Embrace Simplicity
Simple designs are easier to process.
- Limit fonts, colors, and competing focal points.
- Use whitespace deliberately so important information can breathe.
Minimalism is not only a style choice. It improves comprehension and helps teams communicate faster.
Business leaders often cite efficient workflows as a top priority, at 93%, which makes simple, streamlined visuals a significant advantage.
3. Build a Consistent Visual Language
Brand recognition depends heavily on visual consistency.
Define:
- A core color palette
- A limited set of typefaces
- Icon and illustration styles
- Rules for logo, photography, and layout
Apply these standards across every touchpoint so your audience recognizes your brand immediately.
4. Create Strong Visual Hierarchy
Visual hierarchy guides the viewer from the most important information to the supporting details:
- The most important element should be the largest, boldest, or most contrasting
- Secondary information should appear below or around it in a clear reading order
- Alignment and spacing should support this flow
Hierarchy works the same way headings and subheadings guide an article. It helps people understand your point quickly and makes information easier to grasp.
5. Use Color and Contrast With Purpose
Color sets the tone and influences how people interpret information. For example:
- Red and orange often signal urgency or action
- Blue often signals trust, stability, or professionalism
Contrast improves readability on all devices, especially mobile. Clear contrast between text and background ensures that key messages remain visible at a glance.
6. Tell a Story, Not Just a Fact
People remember stories more than isolated pieces of information.
Even a single chart can tell a story when it shows a clear trend or a before-and-after change.
For more complex content, structure your visuals with a beginning, a middle, and an end.
A visual story helps people connect the dots quickly, which is one of the reasons 89% of leaders say visuals help them express key points with more confidence.
7. Avoid Clutter and Competing Messages
Each visual should focus on one idea.
When too many messages appear in the same space, comprehension drops and engagement falls.
Create separate assets for separate objectives rather than forcing everything onto one screen.
8. Test Visuals With Real Users
View this post on Instagram
Before launching a visual asset, test it with a small group:
- Ask what they understand in two to three seconds
- Ask what emotion it creates
- Check if they notice the call to action
Use this feedback to refine clarity, hierarchy, and emotional impact.
Best AI Tools for Visual Communication in 2026
AI has moved from novelty to infrastructure. It now supports ideation, layout, asset generation, and even motion design.
Here are leading AI tools for visual communication:
1. Canva AI and Magic Studio
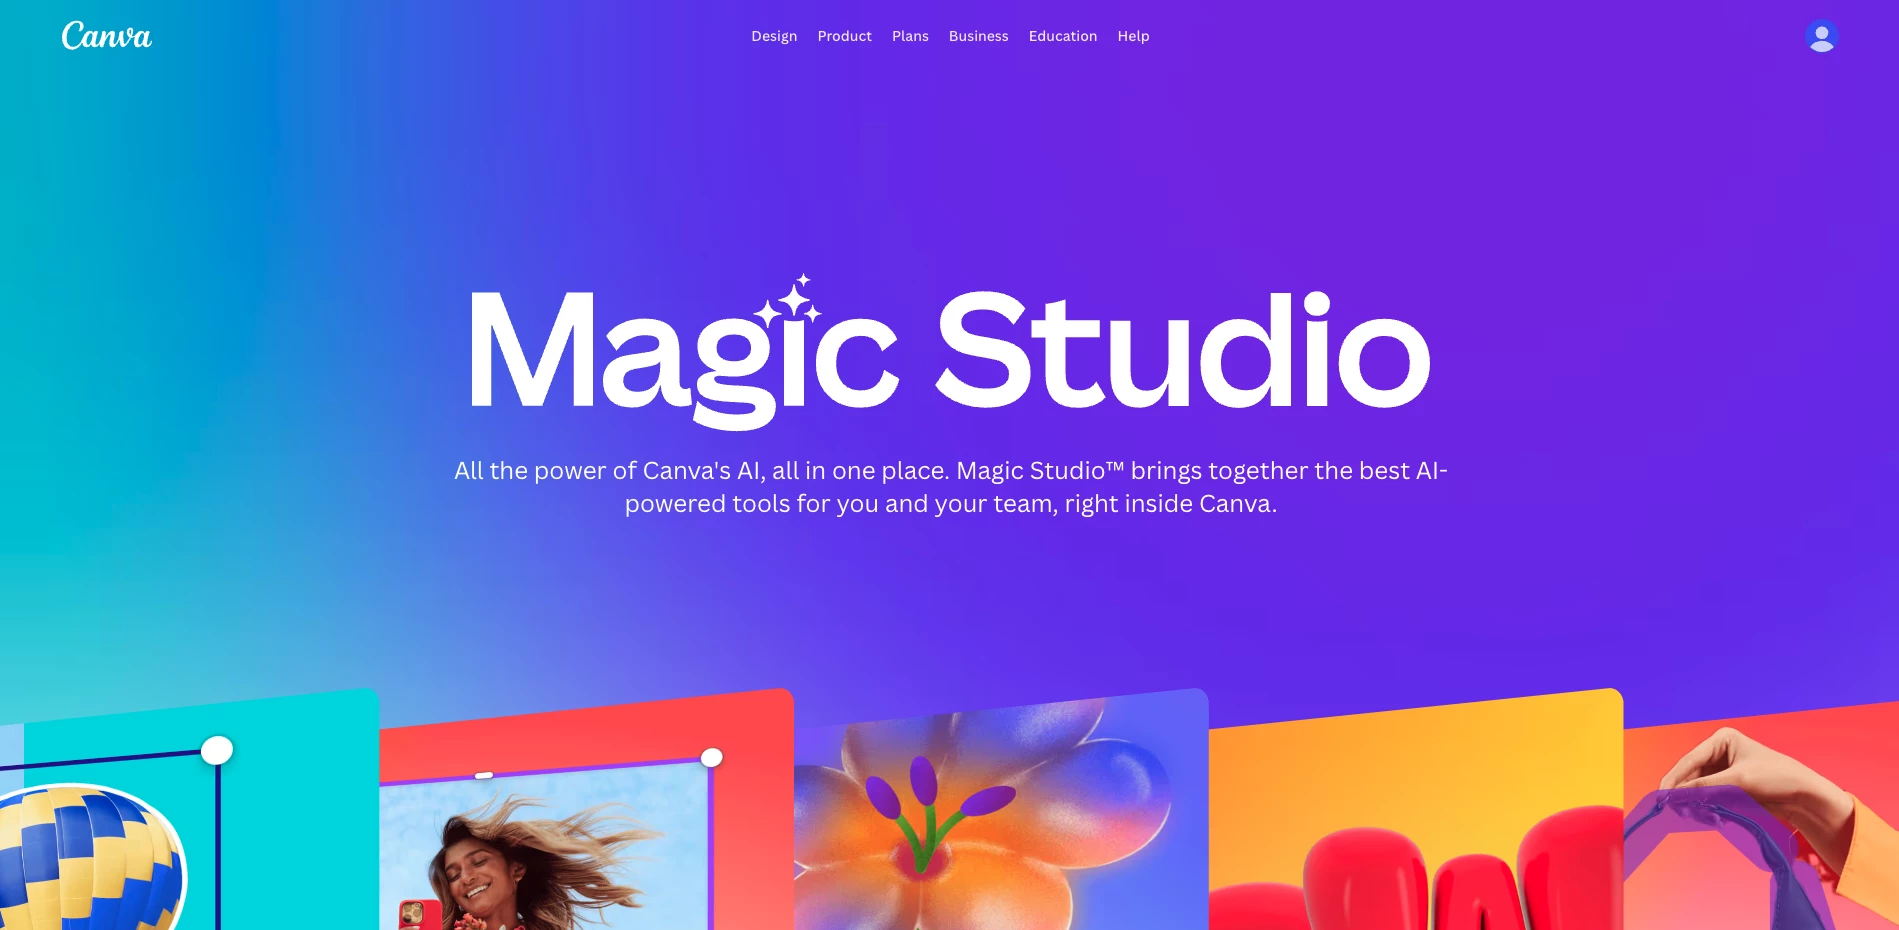
Canva’s Magic Studio includes Magic Design and Magic Media for text to image, text to graphic, and automatic layout generation.
You enter a prompt and the AI produces ready to edit visuals aligned with your brand.
| Pros | Cons | Pricing |
|
|
|
Use it for: Social media creatives, decks, one pagers, ads, and basic motion.
2. Adobe Firefly
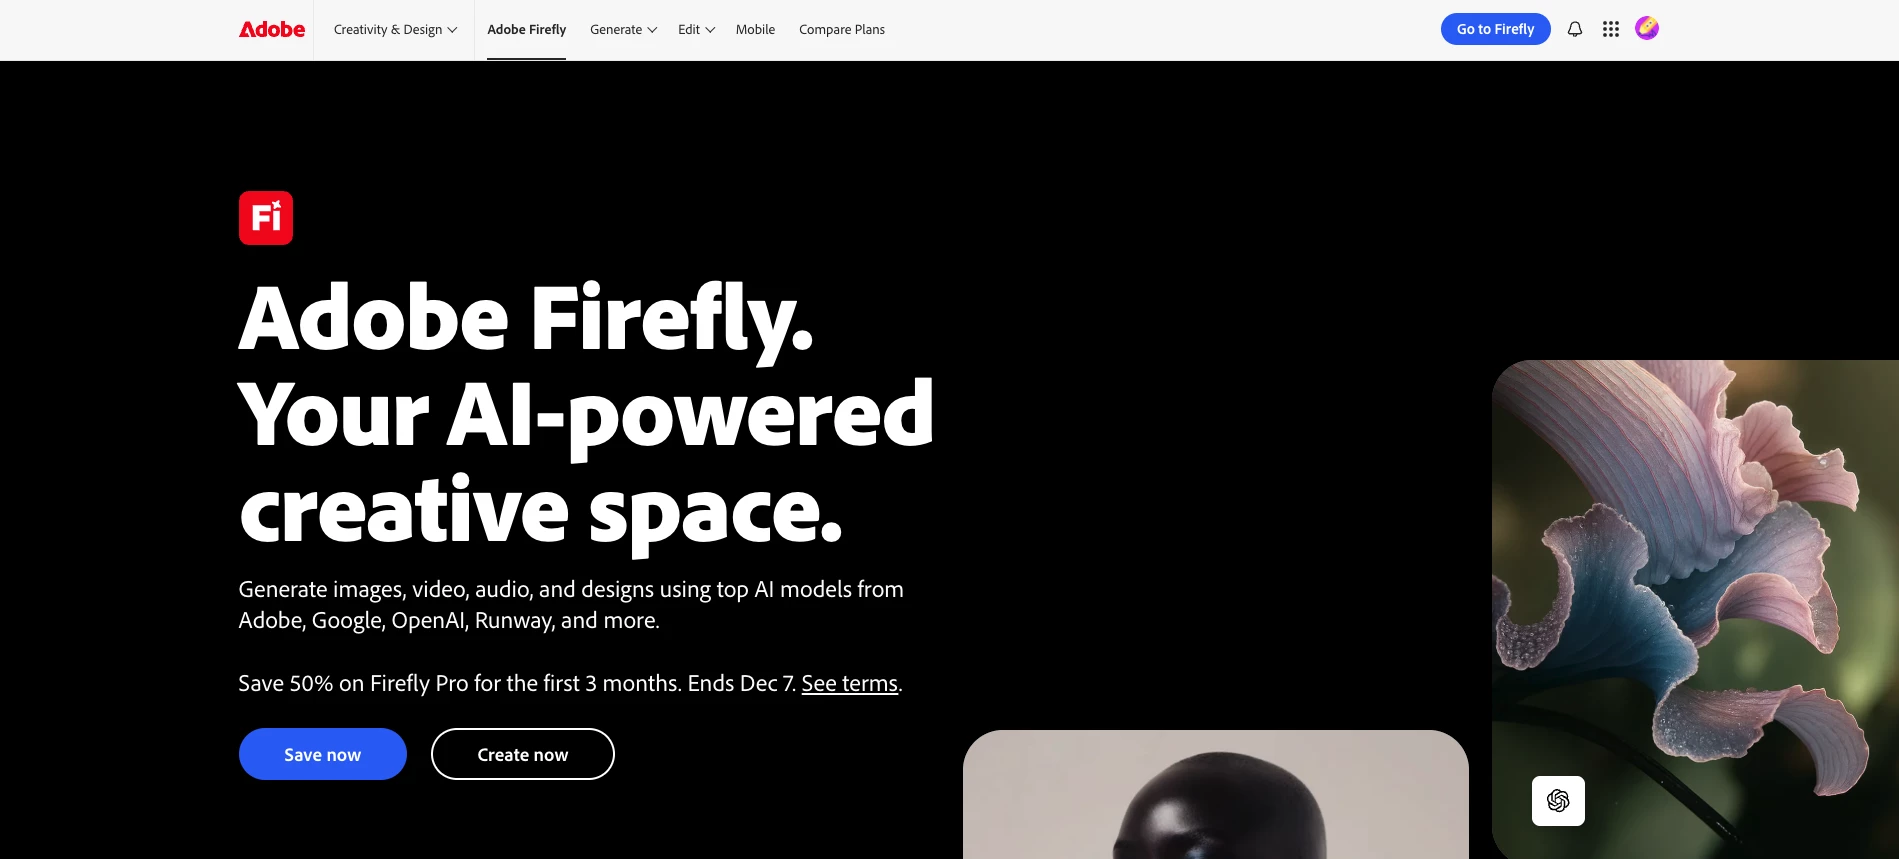
Adobe Firefly is a generative AI environment for images, video, audio, vector graphics, and text effects.
It is marketed as commercially safe and integrates with Creative Cloud apps such as Photoshop and Adobe Express.
| Pros | Cons | Pricing |
|
|
|
Use it for: Brand safe campaign visuals, stylized typography, and creative exploration.
3. Runway Gen 2
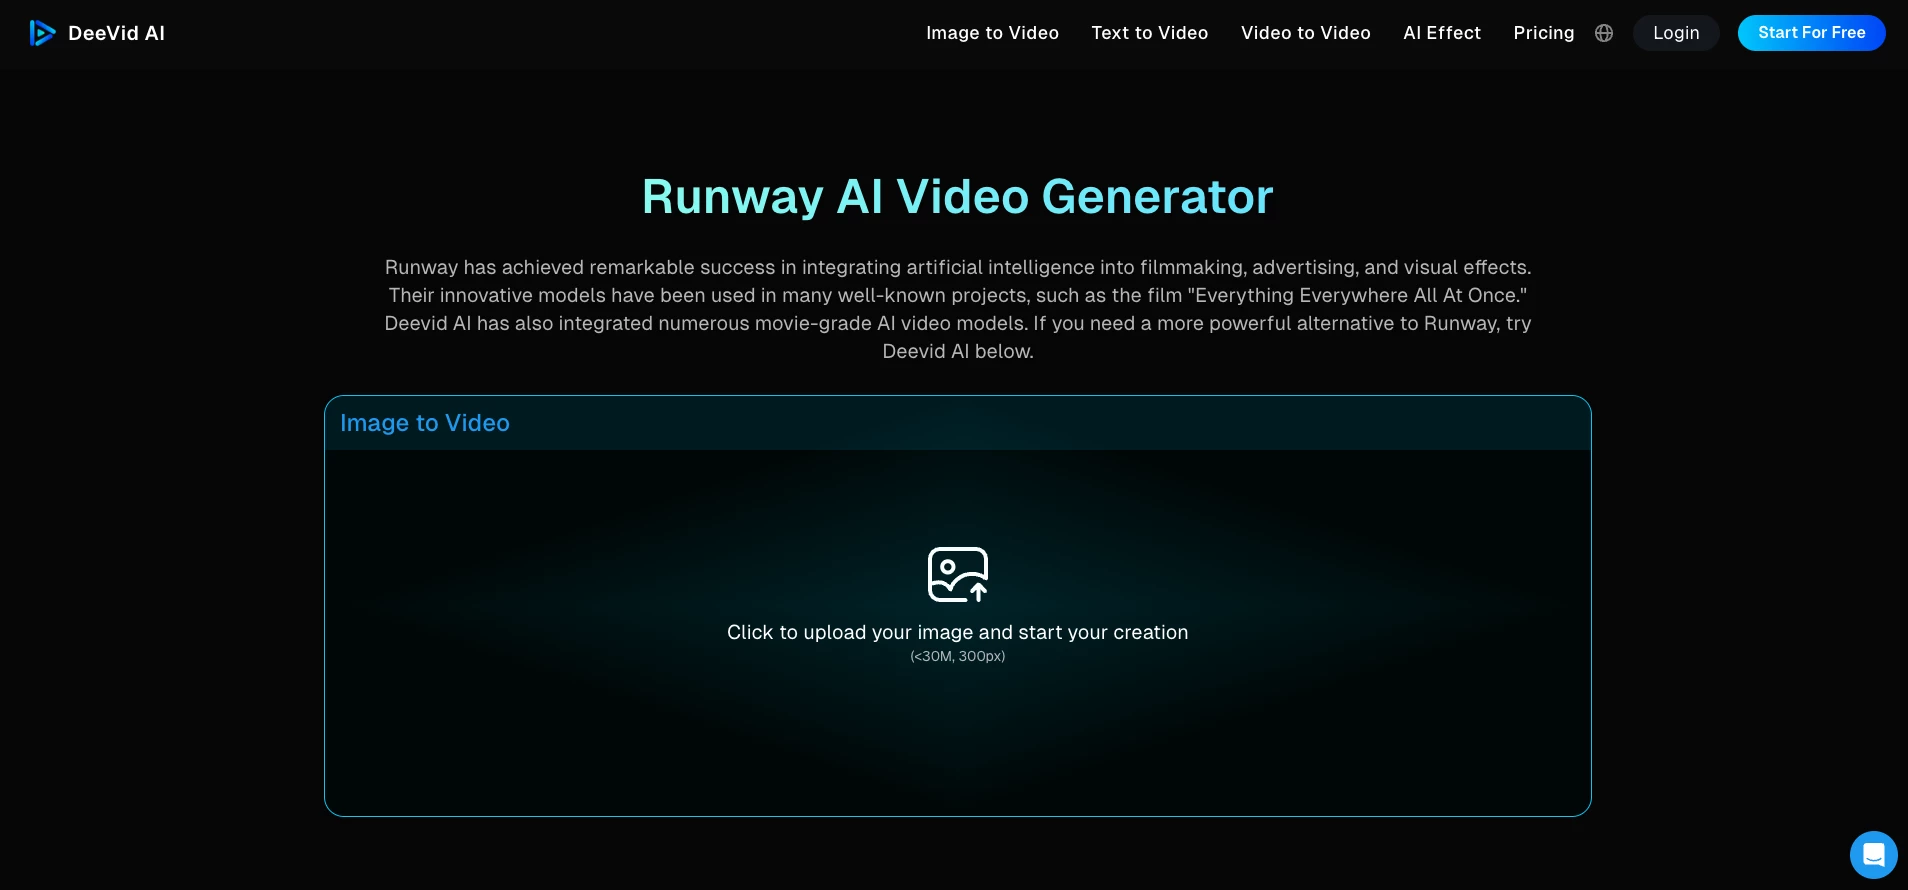
Runway’s Gen 2 model creates short videos from text prompts, images, or existing footage.
It is widely used for concept videos, product animations, and social clips without traditional production.
| Pros | Cons | Pricing |
|
|
|
Use it for: Fast video prototypes, background footage, and experimental storytelling.
4. Figma AI
Figma AI can generate UI layouts from text prompts, propose design variations, and help teams move from concept to first draft much faster.
| Pros | Cons | Pricing |
|
|
|
Use it for: Rapid wireframes and design systems.
5. Spline AI
Spline AI uses natural language to generate 3D scenes and interactive elements that can be used in web experiences and product demos.
| Pros | Cons | Pricing |
|
|
|
Use it for: 3D, product simulations, and future facing landing pages.
![]()
Our team ranks agencies worldwide to help you find a qualified partner. Visit our Agency Directory for the top visual communication companies, as well as:
- Top Graphic Design Companies
- Top Web Design Companies
- Top Video Production Companies
- Top 3D Animation Companies
- Top Interactive Design Agencies
Our design experts also recognize the most innovative design projects across the globe, so you'll want to visit our Awards section for the best visually striking website designs.
Visual Communication FAQs
1. Where is visual communication used the most?
Visual communication is everywhere: digital marketing, product interfaces, education, gaming, journalism, and internal business communication. Slide decks, dashboards, AR try ons, social feeds, and even office signage are all forms of visual communication.
2. Why is visual communication important?
People rely on visual cues constantly, from traffic signs and app icons to product labels and social content. Visuals help us navigate the world, make decisions quickly, and understand information without reading long explanations.
3. Is visual communication crucial for digital marketing?
Yes. In digital channels, attention is scarce and competition is intense. Visual elements such as thumbnails, short videos, infographics, hero images, and interactive experiences determine whether a user stops, engages, and remembers.