Website speed is a crucial factor for customer satisfaction, SEO rankings, and business revenue. Slow load times lead to higher bounce rates, reduced conversions, and lost revenue, making website speed optimization the kind of strategic business imperative you can’t ignore.
This article reveals the latest data on website speed and the business impact it has.
Website Speed Statistics: Key Points
- 53% of users abandon mobile sites that take over 3 seconds to load; 79% are unlikely to return after a slow experience.
- eCommerce sites loading in 1 second see conversion rates up to 3.05%, while a 4-second load drops conversions to 0.67%.
- Sites hitting Google's speed benchmarks (especially LCP under 2.5s) are more likely to rank in the top 20 search results, directly influencing visibility.
Website Speed Performance Benchmarks
Website speed benchmarks provide businesses with industry-specific standards to gauge their site performance against competitors and identify areas for improvement.
1. eCommerce Load Time Benchmarks
 eCommerce websites are highly dependent on fast loading speeds to enhance user experience and increase revenue. The following benchmarks highlight the performance of top eCommerce sites.
- A 2025 study by BloggingWizard reveals that the top ten eCommerce websites load in an average of 1.96 seconds on desktop.
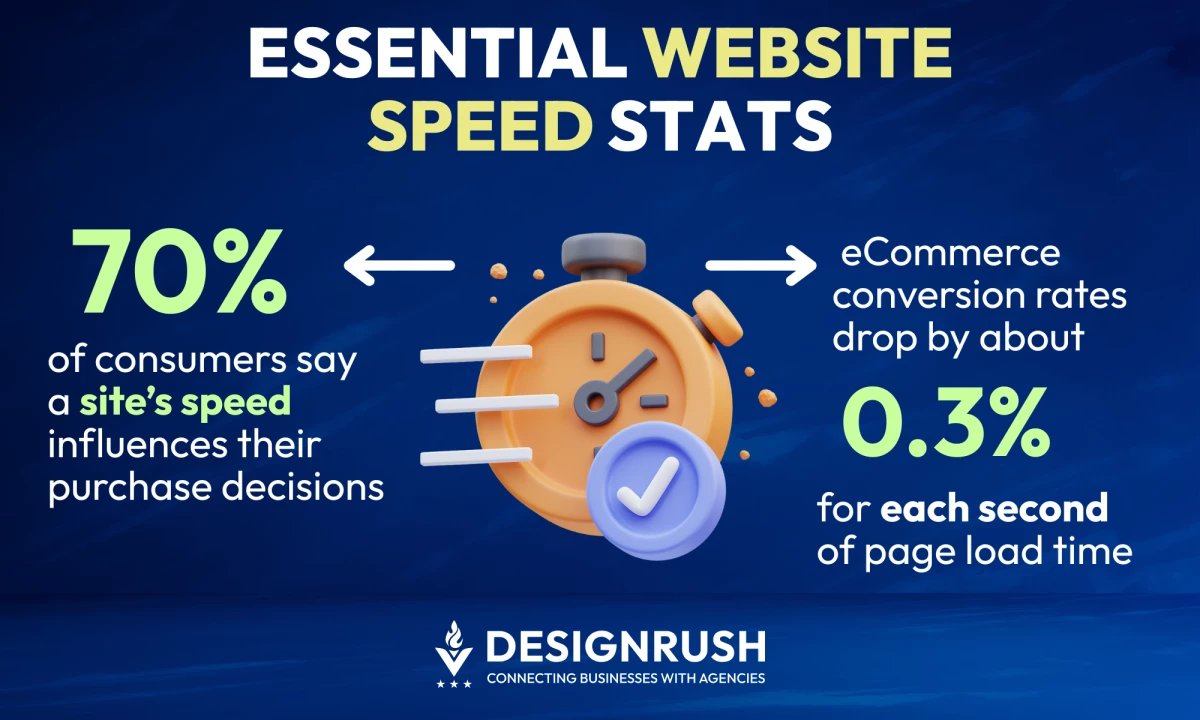
- Portent’s 2022 analytics report, "Site Speed is (Still) Impacting Your Conversion Rate”, shows that eCommerce sites with a page load time between 1 and 2 seconds tend to achieve the highest conversion rates (sales), with an average of 3.05% at 1 second, compared to 0.67% at four seconds, decreasing by roughly 0.3% for every additional second.
- The percentage of eCommerce sites loading in under 5 seconds is steadily increasing, with 86% of pages meeting this benchmark in 2022, compared to 81% in 2019, as per Portent’s report.
Key takeaway: For eCommerce businesses, aiming for a load time of under 2 seconds is essential to maximize user engagement and conversions.
2. Mobile Performance Benchmarks
 Mobile performance is ever more critical due to the growing number of mobile shoppers. Fast mobile load times directly contribute to user retention, improved SEO rankings, and higher conversions.
- According to Tooltester, the global average mobile web page load time is 8.6 seconds, well above the recommended 3-second benchmark.
- In the US, the average mobile website takes 1.9 seconds to load, and 1.8 seconds in the UK, according to Debugbear’s May 2025 research.
- On average, webpages take 70.9% longer to load on mobile devices compared to desktops, per Tooltester’s report.
3. Core Web Vitals Compliance
Core Web Vitals are a set of performance metrics focused on user experience, which influence both SEO rankings and overall site performance.
Sites that meet them are more likely to rank higher in search results, as Google uses these metrics as ranking factors.
The three main metrics and Google's recommended thresholds are:
- Largest Contentful Paint (LCP): This measures how quickly the main content of a page loads. For a good user experience, LCP should occur within the first 2.5 seconds after the page begins loading.
- Interaction to Next Paint (INP): A measure of a page’s responsiveness based on the time it takes for the interface to react to user interactions. A good INP score is less than 200 milliseconds.
- Cumulative Layout Shift (CLS): evaluates visual stability by measuring how much content shifts unexpectedly during page load. To maintain a stable visual experience, the CLS score should be under 0.1.
Core Web Vitals compliance statistics:
- As of early 2025, 66.7% of websites achieve a "good" LCP score, and 51.8% meet the overall Core Web Vitals (including FID and INP), as per the Chrome UX Report for June 2025.
- Only 43.4% of mobile sites meet Google’s Core Web Vitals, Debugbear’s previous analysis found.
- The average LCP score for mobile is only 54.9%, compared to 68.8% for desktop, per Debugbear.
The Business Impact of Website Speed
 Website speed plays a critical role in determining how many visitors convert into customers. In fact, nearly 70% of consumers admit that page speed influences their likelihood to buy from an online retailer, according to research by Unbounce.
Slow load times can negatively impact user engagement, leading to fewer conversions and lower revenue. The following statistics make clear the massive impact that website speed has on conversion rates:
- Bounce rates: For every 1-second delay in page load time, the probability of a bounce increases by 32%, per Google Customer Insights.
- Click-through rates: After BMW revamped their mobile site for smoother performance under poor network conditions, click-through rates to the sales site increased from 8% to 30%, a fourfold increase.
- Conversion rates on desktop: Portent’s 2022 study found that websites which load in just one second achieve an average goal conversion rate of 39%, compared to 18% for sites that take six seconds.
- Conversion rates on mobile: Mobile sites that load in under 2 seconds see a 15% higher conversion rate compared to the average mobile site.
- Impact on retention: Slow-loading websites lead to reduced customer retention, shown by 36.8% of consumers who said they were unlikely to be back, per Unbounce.
- Impact on reputation: Unbounce’s report also revealed that 11.9% of visitors would be likely to tell a friend of a site’s poor experience.
Website Speed: More Key Statistics You Should Know
Beyond benchmarks and conversion rates, here are some important statistics to remind you of the importance of optimizing website speed.
- Rich media compromise: More than half (56.6%) of respondents to Unbounce’s survey were willing to give up animations for faster load speed.
- Assigning blame: Most consumers don’t blame the website when it fails to load, per Unbounce. Instead, 50.5% blame their internet connection and 15.4% blame their mobile carrier.
- Bottom line: Vodafone's A/B test revealed that a 31% improvement in LCP boosted their lead-to-visit rate by 15%, cart-to-visit rate by 11%, and sales by 8%.
- Impact of mobile load time: 53% of users abandon mobile sites that take longer than 3 seconds to load, per Google Consumer Insights.
- Revenue loss: eCommerce websites with a 1-second delay in page load time see a 7% drop in conversions, per Portent’s 2022 report.
- SEO rankings: Websites that load faster than 2.5 seconds (low LCP) are more likely to appear in the top 20 Google search results.
- Customer loyalty: 79% of online shoppers who experience slow-loading websites are less likely to return in the future, per Portent.
- Top CMS performers: Tooltester’s 2025 report found that GoDaddy was the fastest-loading CMS platform across both mobile and desktop, followed by Jimbo.
Website Speed Statistics: Final Words
Website speed plays a fundamental role in shaping user behavior, SEO rankings, and revenue generation. Active steps to optimize your website and stay on top in your industry start with understanding the latest statistics and industry benchmarks.
Speed isn’t just a nice-to-have, it’s a necessity for the success of your website.
![]()
Our team ranks agencies worldwide to help you find a qualified partner. Visit our Agency Directory for the Top Web Development Companies, as well as:
- AI Web Design Agencies
- Top Front End Web Development Companies
- UI/UX Design Agencies
- Web Development Companies for Small Businesses
- Top Web Development Companies in Chicago
Our design experts also recognize the most innovative design projects across the globe. Visit our Awards section to see the best in web design.
Website Speed Statistics: FAQs
1. What are Core Web Vitals?
Core Web Vitals are a set of performance metrics that measure the real-world experience of users, focusing on loading performance, interactivity, and visual stability. These metrics directly influence both user experience and SEO rankings.
2. How can I improve my website’s speed?
Optimizing images, leveraging browser caching, reducing server response time, and utilizing a Content Delivery Network (CDN) are effective strategies for enhancing website speed.


-preview-webp.webp)