Social Media Infographics: Key Points
- Infographics Drive Measurable ROI: Infographic-based content generates 178% more inbound links — making it a high-performing asset in both SEO and lead gen campaigns.
- Visual Content Dominates Social Engagement: Social posts with infographics generate 650% more engagement than text-only content, reinforcing their role in feed-dominant strategies across LinkedIn, Instagram, and TikTok.
- Productized Infographics Unlock Recurring Revenue: Leading agencies like Column Five, Lemonly, and Statista use systematized infographic frameworks to offer retainer-based services, branded editorial campaigns, and scalable design toolkits — transforming design deliverables into predictable revenue streams.
- Industry Leaders Prove Market Traction: Companies like Visual Capitalist ($17.4M revenue) and Statista (€167M revenue) demonstrate the compound value of combining editorial authority with visual storytelling, offering agencies a proven blueprint for monetizing infographics at scale.
Social media timelines are crowded, attention spans are short, and traditional long-form content struggles to convert. Meanwhile, a new breed of visual-first brands are dominating the feed using compact, data-dense infographics to educate, persuade, and build massive distribution. These “micro-infographics” are fast to produce, frictionless to share, and increasingly AI-assisted.
So, let’s unpack why agencies need to rethink how they package, sell, and deploy infographics and what you can learn from the seven biggest players already profiting from this shift.
What Defines a Social Media Infographic and Its Role in the Micro-Content Ecosystem
Social media infographics sit at the intersection of visual storytelling and audience behavior. They are compact, single-idea graphics tailored for social feeds, optimized for platform dimensions, scroll speed, and attention economy.
While not all micro-content is an infographic, many social media infographics qualify as micro-content. They're brief, visually dense, and designed for instant consumption without requiring external context.
Working Definition & Characteristics
- Static or animated visuals optimized for platform feeds (Instagram, LinkedIn, TikTok)
- Generally one key insight, stat, or message per asset
- Designed to be standalone, swipeable, or carouseled
When Is a Social Media Infographic a Micro-Infographic?
- It’s short-form, self-contained, and scroll-optimized
- It doesn’t require external context or explanation
- It’s built for repetition and brand recall — not deep dives
Why This Format Matters Now
- Easier to produce than long-form reports or whitepapers
- Performs better than text or image-only posts
- Pairs well with AI automation and content repurposing strategies
For agencies, this format represents an ideal service product: high value, low production friction, and measurable outcomes.

Meet the 9 Industry Giants Building on Social Media Infographics
1. The Visual Capitalist
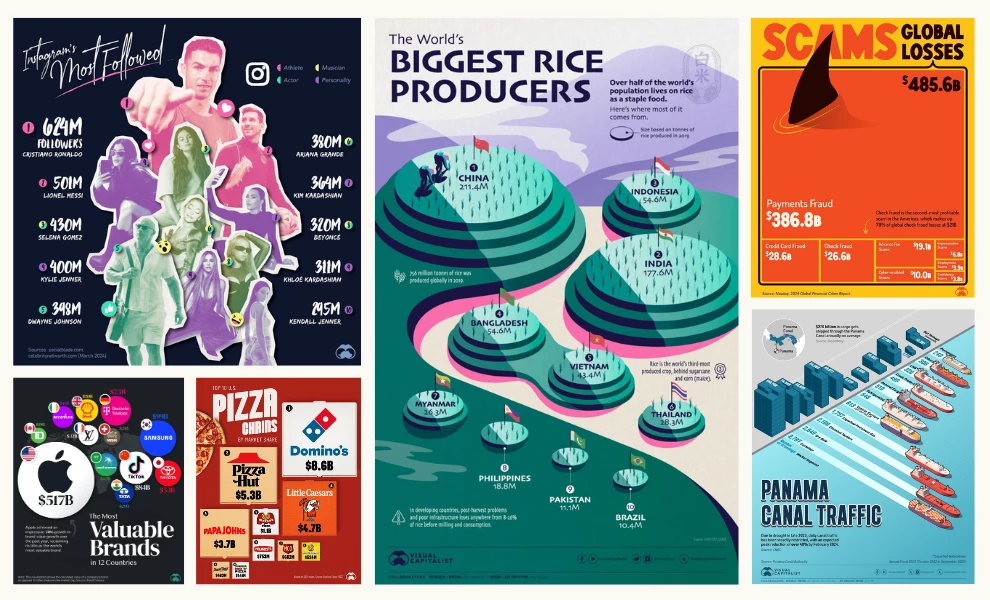
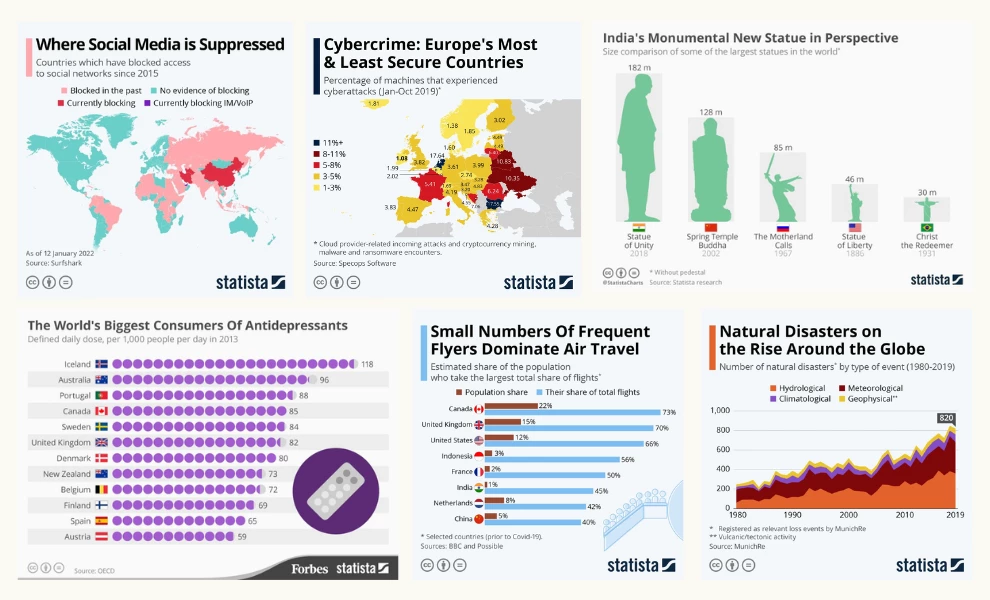
Founded in 2014 and headquartered in Vancouver, Visual Capitalist produces daily high-impact infographics focused on global economics, finance, tech, and commodities. They’ve earned press placements from WSJ, Business Insider, and Bloomberg.
Revenue & Growth:
- Generates an estimatedUS $17.4 million annually with ~85 employees and a 47% YoY headcount increase.
- Consistently growing at ~40–50% yearly, thanks to repeat syndication and robust partnerships.
Social Media Infographic Success:
Visual Capitalist excels at snackable, platform-friendly graphics that distill macroeconomic trends into single-image insights optimized for LinkedIn and Twitter.
Their shareable visuals drive massive engagement and acts as content acquisition — boosting newsletter subscriptions, syndication agreements, and licensed usage.
Business Model: Monetizes through content licensing, data subscriptions, and custom visual content for enterprise.
Strategic Edge: Positioned as a data-first media brand with high audience trust, fueling long-term growth through syndication and content-as-a-service offerings.
Design Strengths:
- Isometric “map-graphic” combos: Great for headline social visuals with strong scroll-stop value.
- Large value callouts & icons: Excellent readability in mobile-first contexts.
- Curated topical focus: Drives syndication across business media.
2. Voronoi
Voronoi is a minimalist content brand specializing in high-concept, single-stat infographics distributed via Instagram, LinkedIn, and Twitter. With a clean aesthetic and focus on clarity, Voronoi has carved out a niche for delivering “1-slide insights” that communicate punchy economic and business concepts.
Revenue & Growth: Privately held with no public revenue data, but estimated to generate consistent growth via premium content subscriptions and high-engagement sponsored content. Their loyal niche audience and viral traction on LinkedIn have solidified Voronoi’s brand equity.
Social Media Infographic Success: Voronoi’s infographic model centers on consistency, minimalism, and brand-coded design — creating instantly recognizable assets optimized for vertical mobile feeds.
Business Model: Monetizes via visual content retainers, paid templates, and platform subscriptions.
Strategic Edge: Scaled rapidly by systematizing single-stat visuals, building a loyal social following, and reducing design time to increase profit margins.
In 2023, Voronoi was acquired by Visual Capitalist, a move that brought operational scale and data infrastructure to its high-performing visual content model.
The merger underscores a strategic pivot: pairing Visual Capitalist’s deep-dive data storytelling with Voronoi’s viral-ready formats, allowing both to diversify distribution, cross-pollinate audiences, and capitalize on the growing demand for business-first microcontent across social media.
Design Strengths:
- High-contrast stat visuals that “pop” on feeds.
- Compact grid structure that enables quick templating and replication.
- Bold color coding by topic primes instant visual categorization and brand consistency.
3. Raconteur
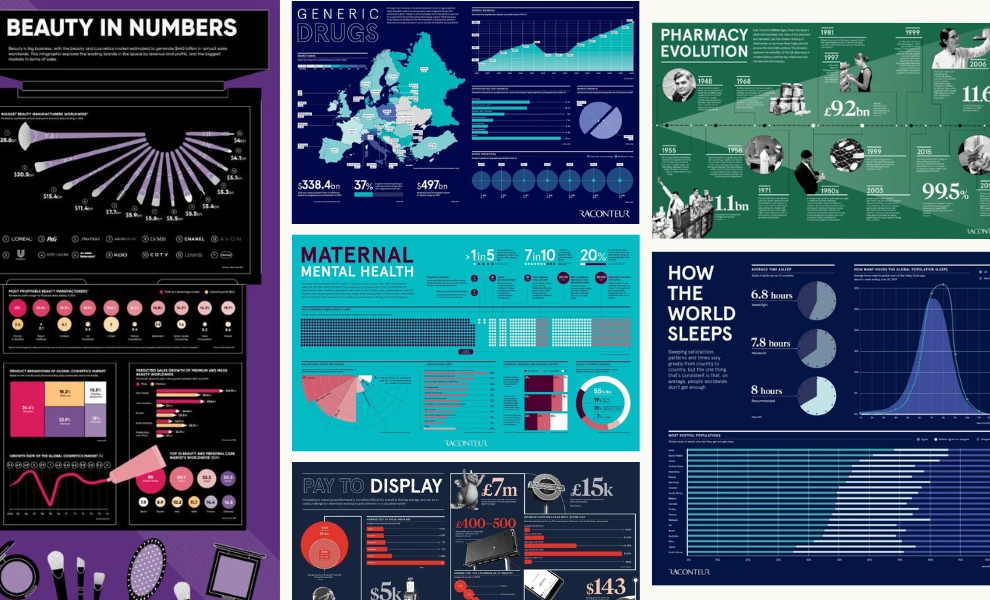
Launched in 2008 as a premium publisher under The Times (London), Raconteur specializes in executive-level reports enriched with visual narrative.
Revenue & Growth: Funded and growing steadily through corporate partnerships and white-label content embedded in financial media.
Social Media Infographic Success: They use micro-infographics as teasers for long-form thought-leadership, designed to perform as standalone visuals on LinkedIn and Twitter. These are often “report highlights” slides that drive click-through to gated content.
Business Model: Monetizes through branded content partnerships, native visual storytelling, and B2B marketing services.
Strategic Edge: Combines editorial authority with visual storytelling to command premium media rates and deepen B2B brand positioning.
Design Strengths:
- High-density fact arrays that match business reader expectations.
- Consistent visual grammar (e.g., dark backgrounds with bold type) for brand recognition.
- Topic selection (drugs, mental health, sleep) — aligns with timely reporting and executive interest.
4. Statista
Founded in Germany in 2007, Statista is now a global research and visualization platform headquartered in Hamburg and Berlin, supported by ~1,450 employees.
Best known for its vast data platform, Statista now offers Statista.design, a self-service hub for embeddable infographics. With over $150M in annual revenue, Statista successfully bridges raw data and design-ready social assets.
Revenue & Growth:
- €167 million in revenue (2024)with 1,450 employees operating globally across 13 offices and reaching over 4 million registered users.
- Sustained growth trajectory: Statista grew ~39% annually post-acquisition by Ströer (from €136M in 2022) with ongoing revenue projected to reach €250M by 2025.
- Low churn SaaS model: Their "Data as a Service" subscription model demonstrates strong customer retention and recurring revenue
Design Extension: Statista.design allows users to download embeddable, ready-made infographic assets tailored for social or presentations.
Social Media Infographic Success: By offering instant, data-backed visuals built for TikTok, LinkedIn, and Stories, Statista solidifies itself as an enterprise tool for agencies managing client dashboards, monthly stats, and thought leadership bites.
Business Model: Monetizes via subscriptions, enterprise API access, and self-serve data design tools (Statista.design).
Strategic Edge: Expanded into infographic services to strengthen platform stickiness and increase average revenue per user through design-led offerings.
Design Strengths:
- Flat, clean iconography ensures rapid infographic generation and universal legibility.
- Consistent styling across charts builds long-term brand trust and easy reuse in reports.
- Uniform color palette and layout support enterprise-ready data workflows (e.g., embedding in client decks).
5. Column Five
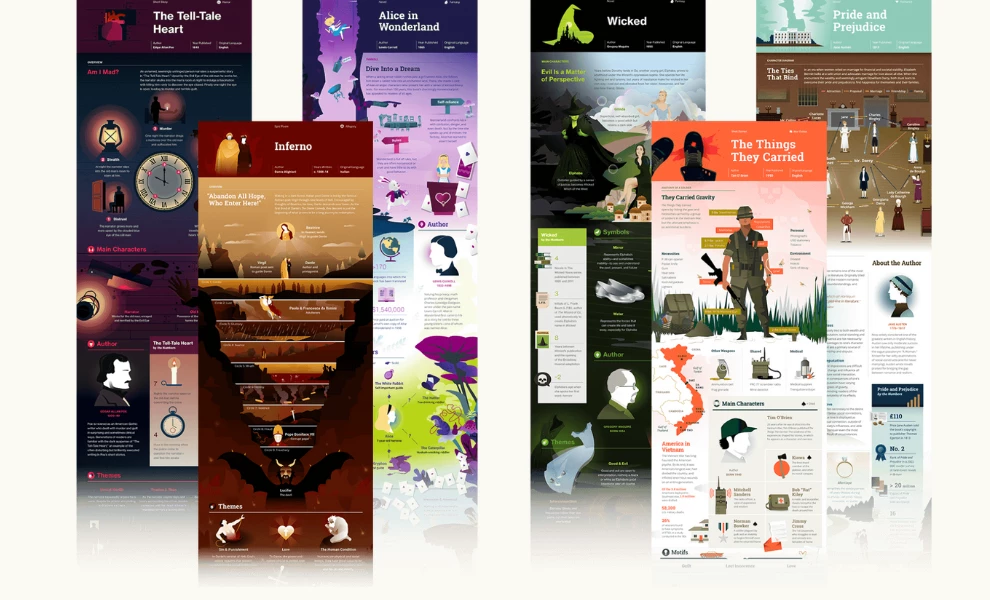
A data storytelling agency from California, Column Five is known for its viral campaigns (like “Child of the 90s”) and high-utility brand content.
They integrate infographics into broader strategy retainers, combining brand narrative with measurable deliverables.
Revenue & Growth: Climbed Crunchbase ranks from #4 to #88 in a year, signaling rapid expansion and strong market traction.
Social Media Infographic Success: Masters branded micro-infographics embedded in storytelling pipelines — carousel stats, motion visuals, and interactive slides that appear across social and content platforms.
Business Model: Monetizes via strategy-first retainers, multimedia brand campaigns, and long-term content partnerships.
Strategic Edge: Uses data storytelling to move up the value chain from tactical design vendor to strategic brand advisor.
Design Strengths:
- Rich narrative flow using layered info-density, excellent for long-scroll assets and embedded storytelling.
- Multiple thematic sections (characters, themes, quotes) keep each infographic engaging for longer durations.
- Branded editorial polish, this structure supports lead-gen as PDF downloads or gated content reliably.
6. JESS3
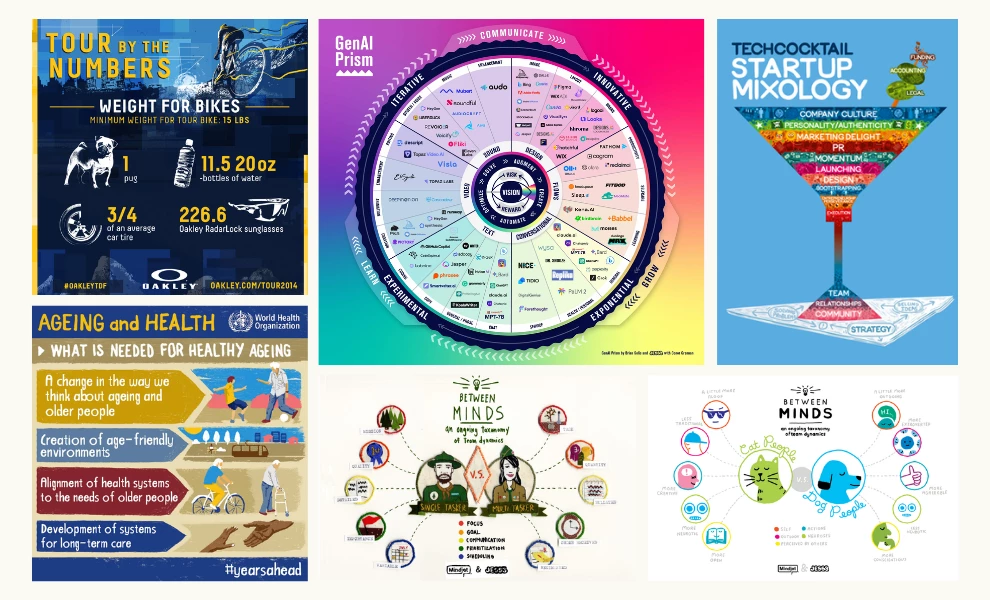
With clients like Google, Facebook, and NASA, Jess3, founded in 2007 by Jesse Thomas, specializes in interactive and visual-first digital experiences. Their early success came from visualizing conversations and trends in social-first formats.
Revenue & Growth: Once ranked among the top visualization agencies globally, JESS3 scaled rapidly to a multimillion-dollar valuation during the early infographic wave. While no longer at peak media visibility, they continue to serve high-profile clients in tech and publishing.
Social Media Infographic Success: JESS3 specializes in interactive and motion-augmented infographics adapted for modern platforms like Instagram Stories and TikTok — often turning static content into animated sequences.
Business Model: Revenue comes from custom data storytelling, digital activations, and multimedia editorial partnerships.
Strategic Edge: JESS3’s longevity and multimedia expertise position them as an innovation partner, especially for brands looking to bridge data and storytelling across platforms.
Design Strengths:
- Tight visual hierarchy with bold headers and segmented sections, which is ideal for carousel adaptation on Instagram.
- Interactive mindset, clearly primed for motion or GIF output, aiding multiplatform expansion.
- Cultural resonance in topics that are timely, and design handles them with clarity and humanity.
7. Lemonly
A niche design-first infographic studio specializing in illustrative, playful graphics for healthcare, non-profits, and the arts.
Since 2007, they've developed over 40+ microcontent pieces across industries like technology, travel, and public service, showcased in an extensive portfolio list .
Revenue & Growth: Stable growth through recurring client relationships and niche marketing.
Social Media Infographic Success: Creates micro-content infographics that capture emotional narratives, with shareable single-stat or mini-comic visuals tailored for Instagram and Facebook.
Business Model: Monetizes through one-off content packages, ongoing visual content retainers, and educational materials.
Strategic Edge: Positioned as a content simplification partner, helping brands break down complex ideas into scalable, repeatable, and on-brand micro-infographics.
Design Strengths:
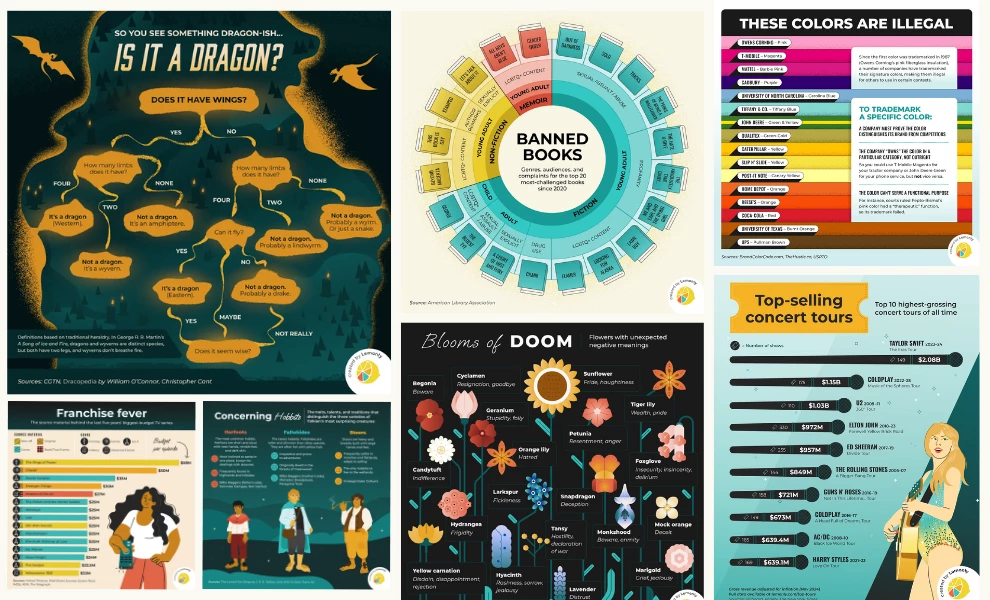
- Whimsical, narrative-driven panels (e.g. dragon flowchart), perfect for social shares and saving.
- Color-coded categorization, viewers instinctively parse branches or categories within seconds.
- Tiny typographic cues (like "These colors are illegal") invite closer reading — great for slide-by-slide reveal tactics.
8. Scriberia
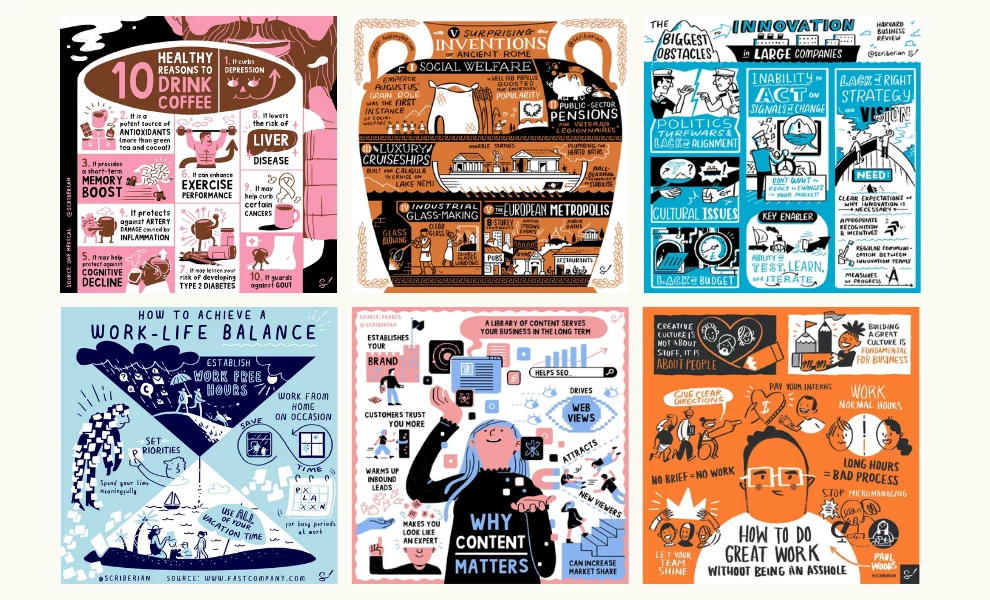
Founded in 2007 in the UK, Scriberia specializes in hand-drawn sketchnote infographics used for workshops, retrospectives, and internal communication WikipediaTracxn.
Revenue & Growth: Self-funded, steady business via corporate workshop partners and internal learning functions. Estimated to earn ~US $6–8 million annually with a steady presence in the UK and EU markets.
Social Media Infographic Success: Adapts sketchnotes into shareable summary visuals, used by consultancy clients to promote thought-leadership sessions or recap key takeaways.
Business Model: Monetizes through corporate workshops, custom visual assets, and long-term strategic partnerships.
Strategic Edge: Their focus on co-creation and human storytelling positions them as high-trust, high-retention partners — ideal for C-level presentations, stakeholder comms, and internal engagement.
Design Strengths:
- Hand-sketch aesthetic stands out in digital feeds, adding perceived authenticity.
- Panel-based storyboards allow for breaking down messaging into bite-size visual steps.
- Conversational visual tone, sketches feel like notes from a trusted advisor or speaker.
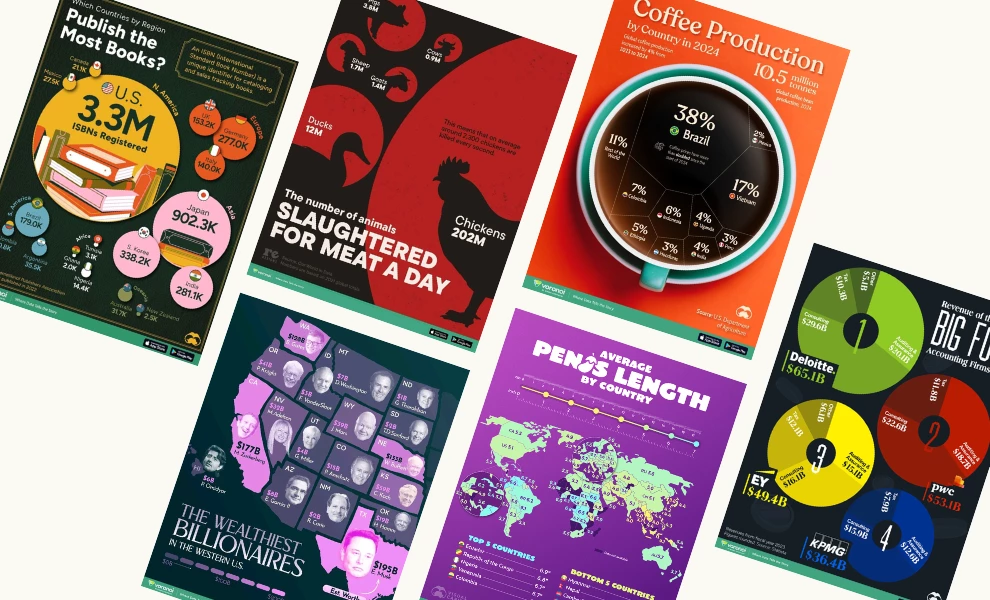
9. TillNoon (ChitChart)
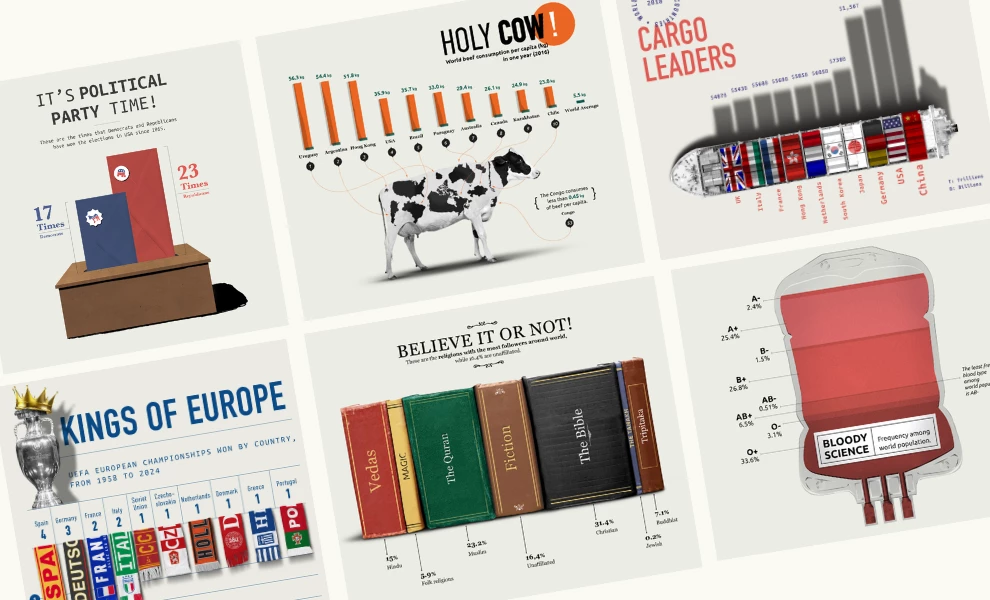
A micro-content studio producing motion-optimized infographic content for social media, with emerging prominence in short-form video.
Revenue & Growth: Rapid adoption among SMBs and startups seeking viral social clips.
Social Media Infographic Success: Fuses animated micro-infographics with editorial storytelling — optimized for Reels, Shorts, and TikTok snippets.
Business Model: Monetizes through social-first brand campaigns, design retainers, and editorial series.
Strategic Edge: By marrying motion, micro-infographics, and editorial tone, TilNoon stands out in cultural storytelling and brand engagement for younger demographics.
Design Strengths:
- Whimsical charts with strong metaphors (cow, books), ideal for social hooks.
- Clean layout with pop visuals, helps content perform in Reels and Stories formats.
- Smart use of whitespace and hierarchy makes data feel digestible and mobile-native.
How Agencies Can Productize Social Media Infographics
Agencies chasing scale shouldn’t just offer infographics, they should productize them. With 84% of businesses calling infographics effective, the path to recurring revenue lies in systemizing design, packaging insights, and selling them as repeatable, results-driven content products.
Modular Design Frameworks
- Use repeatable carousel and single-stat templates for LinkedIn, Instagram, and TikTok.
- Research consistently supports that visuals greatly enhance recall; for example, 65% of information presented visually is retained after three days compared to only 10% for text.
Monetization Paths
- Infographic packages as retainer offerings: Agencies can charge monthly for a set number of infographics.
- Thought Leadership Services: Agencies can pitch infographic-led personal branding for C-level executives; B2B clients rank infographics as a top-performing content asset.
- SEO & Performance Bundles: Backed by Infographic World data showing up to a 12% increase in website traffic and 178% more inbound links when using infographics — agencies can charge premium fees based on performance deliverables.
Proof of Value
- Infographics are 30x more likely to be read than text posts, making them a proven tool for standing out and driving engagement on social media.
- Content featuring infographics sees 650% more engagement on social channels compared to text-only posts — an ideal KPI for agency case studies and client dashboards.
What About AI: How the Future of Micro-Infographics Look Like
AI is already accelerating infographic production:
- Auto-layout tools like Canva & Adobe Express: AI-assisted templates cut production time, enabling faster turnaround for high-volume social content.
- Dynamic data integration: Connect platforms like GA4, HubSpot, or Airtable to auto-populate charts, keeping visuals current without manual updates.
- Multiformat stacking strategy: Repurpose one micro-infographic into a Reel, LinkedIn carousel, or slide deck to maximize ROI across channels.
- Workflow-driven advantage: Agencies that standardize these AI-powered pipelines will scale faster, reduce creative fatigue, and deliver higher-margin content products.
Social Media Infographics: The Bottom Line
Social media infographics aren’t filler. They’re performance assets and when done right, they drive awareness, authority, and action.
The agencies and creators profiled above are setting the new standard for what visual-first content can do for business outcomes. The question isn’t whether to use infographics, it’s whether you’ll lead or follow.
![]()
At this point, social media infographics are proven and supported conversion assets. When designed with strategy, they boost visibility, drive clicks, and deliver measurable ROI across every platform.
That’s why brands and agencies serious about performance need creative partners who understand both design and distribution.
Looking to scale visual impact where it matters most?
Our team ranks the world’s best creative firms. Visit our Agency Directory to connect with:
Our design experts also recognize the most innovative design projects across the globe. Visit our Awards section to see the best & latest in print design.
Social Media Infographics: FAQs
1. What makes a social media infographic effective?
An effective social media infographic is short-form, visually dense, and optimized for scroll behavior. It focuses on one stat or insight, uses bold visuals, and fits platform dimensions like LinkedIn carousels, Instagram posts, or TikTok slides.
2. How can agencies monetize social media infographics?
Agencies can productize infographics into retainer packages, offer C-suite personal branding services, or bundle them into performance-based SEO and lead-gen campaigns. Visuals with high shareability and conversion potential increase client ROI and justify premium pricing.
3. Can AI tools help create social media infographics?
Yes. AI accelerates production through auto-layout design (Canva, Adobe Express), data syncing with platforms like HubSpot or Airtable, and multiformat repurposing, turning one stat into a Reel, carousel, and deck. Agencies using AI workflows gain a competitive edge.