Content Marketing KPIs: Key Points
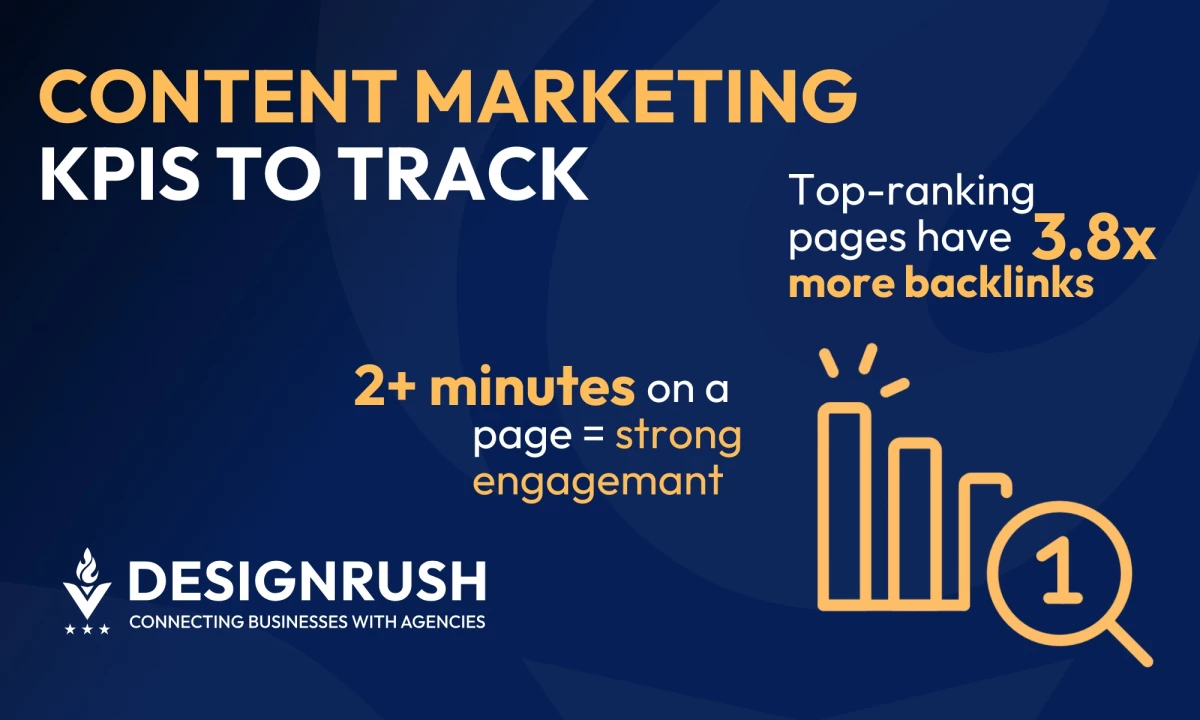
- 2+ minutes on page shows strong engagement; boost this by using a conversational tone and answering real user questions.
- 65%–90% bounce rates are typical for content-heavy sites; aim below 50% on B2B pages for deeper user interaction.
- Top-ranking pages have 3.8x more backlinks; focus on earning high-quality, diverse links.
Tracking the right content marketing KPIs uncovers what truly drives performance. To align your content efforts with business impact, get clued up on the essential KPIs that move the needle on growth, engagement, and ROI.
7 Key Content Marketing KPIs to Track
Tracking page views and impressions gives an initial glimpse, but they don’t tell the full story. There is much more to learn if you dig deeper into your data. Ask how many of those visitors are visiting for the first time, for instance.
That answer can show how many individuals access your site and help you distinguish between loyal repeat readers and new audiences. High page views with few unique visitors suggest strong retention, but the reverse could mean weak engagement.
Ultimately, the most important KPIs to track depend on your business goals and content strategy. There are many content metrics to look at, but here are some of the most critical ones.
- Time on Page
- Bounce Rate
- Pages per Session
- Click‑Through Rate (CTR)
- Social Shares and Engagement
- Backlinks
- Conversion Rate
1. Time on Page
This shows how long users engage with your content, and it starts with a simple formula: divide the total time visitors spend on a page by the number of sessions to calculate the average time on page.
This metric varies based on content format and user intent. For example, a blog post or educational article that holds attention for two minutes or more often points to strong relevance and engagement.
To boost that engagement, take the advice of Digital Silk CEO Gabriel Shaoolian, who recommends answering real user questions and focusing on “topic depth, conversational tone, and aligning with search intent” — especially in terms of replicating how users talk, rather than type.
And if users exit after just 10 seconds, it likely means the content isn’t meeting expectations.
- Higher dwell time (e.g., 30+ seconds) generally correlates with more relevant, high-quality content.
- Boost engagement by using clear subheadings, compelling intros, embedded media, and visuals that draw the eye early. Deliver immediate value to encourage readers to stick around.
2. Bounce Rate

Bounce rate measures the share of one-and-done visits (users who leave after viewing only one page), signaling how often a page fails to engage or meet expectations. It’s calculated using the formula:
Bounce Rate = (Total single-page sessions / Total sessions) × 100
A lower bounce rate means visitors are exploring further instead of exiting immediately. High bounce can stem from slow-loading pages, weak UX, or mismatched expectations.
Here are the current benchmark bounce rate ranges from Plausible:
- Content sites (65%–90%): Typical for blogs, news, and informational content where readers only seek one article.
- Landing pages (60%–90%): Common even for conversion-focused pages, though anything above 70% often indicates a need for optimization.
- B2B and service sites (25%–65%): Aiming for below 50% is considered strong for sites designed to nurture deeper engagement.
- Average rates range from 26–40%, which is considered excellent; 41–55% is average; while 56–70% suggests issues. Content sites often hit 65–90%, but long-form content should aim lower.
3. Pages per Session
This metric tracks how deeply users explore your site per visit. A higher pages per session suggests visitors find your content engaging and are clicking through to multiple pages.
It complements bounce rate and time on page to show how effectively your content ecosystem encourages exploration. Internal links, related content modules, and intuitive navigation help to boost this KPI.
For most websites, between 1.7 to 4.0 pages per session can be a healthy sign of engagement,
For eCommerce websites expect an average of 2.6 pages per session.
4. Click‑Through Rate (CTR)
The average organic click-through rate (CTR) for websites generally ranges from 2% to 5%. However, what qualifies as a “good” organic CTR can differ depending on the industry and even the individual website.
For instance, a 1% CTR may be seen as strong performance in the legal sector, whereas a range of 2% to 4% is more common for industries like finance, eCommerce, and travel.
- Low CTRs can stem from vague messaging or poor CTA placement.
- Test CTA copy ("Get My Report" vs. "Submit") and design (button contrast, layout) to lift performance.
5. Social Shares and Engagement

On social media, engagement rate (likes, comments, shares divided by impressions or followers) is a key KPI to gauge whether or not your content is resonating.
Engagement varies widely across different platforms, but data from RivalIQ’s recent benchmark report puts the averages per post across sectors as follows:
- TikTok: 1.73%
- Instagram: 0.36%
- Facebook: 0.046%
- X (formerly Twitter): 0.015%
6. Backlinks
Backlinks are very important for strengthening SEO and driving referral traffic. Pages that rank at the top of search results typically have significantly more backlinks, usually about 3.8x more than lower-ranked pages.
As SEO expert Rachel Hernandez, emphasizes in a discussion on effective link-building and outreach strategies, the KPIs her teams at TheHoth and Next Net Media were focused on included traffic volume, increased rankings, and Domain Authority/Domain Rating (DA/DR).
She explains that DA/DR provides an ongoing indicator of your site's authority, which is “the most important element of SEO”.
Here’s how you can build a strong backlink profile:
- Create link-worthy assets: Focus on producing valuable resources like in-depth guides, original data studies, or practical tools that naturally attract backlinks.
- Emphasize quality over quantity: Earning links from authoritative, relevant websites has a greater impact than accumulating a high volume of low-quality links.
- Aim for domain diversity: A strong backlink profile includes links from a wide range of unique and trustworthy domains, not just multiple links from a single source.
7. Conversion Rate
 Conversion rate measures the percentage of users who take a desired action (such as filling out a form, downloading a resource, or making a purchase) out of the total audience exposed to an opportunity to convert.
They vary widely by channel and industry:
- For instance, the conversion rate benchmark for Google Ads across all sectors is 3.75% on search, yet the sector with the highest average, law and government sits at 7.45%.
- The industry with the lowest average conversion rate is computers and electronics, at just 3.16% on search.
View this post on Instagram
Tools to Use For Content Marketing
Analytics tools help marketers see results clearly. Centralizing data and integrating systems (web analytics, CRM, social, etc.) allows teams to save time, reduce errors, and gain a 360° view of their content’s effectiveness.
Recommended tools include:
- Google Analytics (GA4): Monitors key metrics like traffic volume, bounce rate (sessions without engagement), conversion events, and user engagement time.
- Ahrefs / Semrush: Offer powerful SEO tools that analyze organic search traffic, track keyword rankings, and audit backlink profiles.
- Hotjar / Crazy Egg: Visualize on-page behavior with click, mouse-movement, and scroll heatmaps, as well as session recordings.
- Sprout Social / Buffer / Mailchimp: These platforms track social engagement (shares, likes), email campaign metrics (open rates, click-throughs), and subscriber growth.
- Jasper / Claude: Enable rapid content generation, support A/B testing by producing multiple variants, streamline content workflows with brand-voice consistency, and aid in optimizing messaging based on performance metrics.
| Tool | Best For | Ideal Team Size |
| Google Analytics (GA4) | Sophisticated tracking of site traffic, user behavior, conversion funnels, and engagement events. | Solo marketers to large teams |
| Ahrefs / Semrush | Deep SEO insights: keyword tracking, backlink analysis, and organic performance benchmarking. | Small SEO teams to agencies |
| Hotjar / Crazy Egg | Visual interaction data, session replays, form analysis, heatmaps (perfect for UX optimization). | Startups to enterprise product/UX teams |
| Sprout Social / Buffer / Mailchimp | Social & email campaign analytics, audience growth tracking, and CRM-powered reporting. | Small marketing teams to enterprise departments |
| Jasper, Claude | Automated content production, variant generation for A/B testing, and maintaining brand tone consistency. | Content teams of varying sizes (2+) |
Best Practices for Tracking Content Marketing KPIs

Having data is only part of the equation, you need smart processes to act on it. A data-driven, iterative approach turns KPIs into performance drivers. This means treating your content strategy as an ongoing experiment: form hypotheses, test ideas, and double down on what works.
Applied systematically, this approach takes content marketing from guesswork to growth engine. If you continue doing controlled experiments like A/B tests while tracking content KPIs, you can steadily improve your content’s effectiveness.
It reveals scalable tactics and eliminates underperformers. One study found a 20% increase in engagement as a result of ongoing experimentation.
Link KPIs to Strategic Goals

Don’t track metrics in isolation. Instead, choose three-to-five core KPIs that directly track to your business objectives. Each should clearly reflect a strategic goal. Ask yourself: “How does this metric drive performance?”
For example:
- Awareness-focused goal → Organic impressions, new unique visitors
- Lead generation goal → Conversion rate, form submissions
- Authority goal → Backlinks, social shares
You can ensure measurement is purposeful and tied to outcomes by consistently tracking this tightly aligned set of metrics. You can also avoid tracking extraneous data that doesn’t move the needle.
Here are some more best practices to keep in mind:
- Adopt multi-touch attribution: Use first-touch, last-touch, or multi-touch models to map how content influences each stage of the buyer journey. CRM or specialized tools can show which content truly drives conversions across the funnel
- Test continuously: Don’t rely on assumptions. A/B test elements like subject lines, CTAs, blog titles, or page layouts. For instance, compare a generic newsletter title vs. one promising a benefit. Apply what works at scale once results are significant.
- Tell data-driven stories: Go beyond the numbers. Explain why a metric changed and what you’ll do next.
- Update and iterate quarterly: Revisit KPIs and strategies every quarter. Ask: Are metrics still aligned with goals? Do we need new benchmarks or targets?
Content Marketing KPIs: Final Words
A smart KPI framework backed by great tools and a testing mindset is all it takes to turn content marketing into a catalyst for growth. It all starts with monitoring these core metrics and using them to navigate your way to optimization.
![]()
Our team ranks agencies worldwide to help you find a qualified partner. Visit our Agency Directory for the content marketing agencies, as well as:
- Top Digital Marketing Agencies
- Top Conversion Rate Optimization Agencies
- Top Video Marketing Agencies
- Top Creative Agencies
- Top Social Media Marketing Agencies
Content Marketing KPIs: FAQs
1. How often should I review each KPI?
Track KPIs weekly to catch short-term shifts and ensure timely action. Then, review overall trends monthly or quarterly to identify patterns, assess performance against broader goals, and make strategic adjustments.
This ensures you stay both agile and aligned with long-term objectives.
2. Which KPI should small businesses prioritize first?
Start with traffic, time on page, and engagement. Layer in conversions later as your audience grows.