Small Business Data Analytics: Key Points
- Small businesses that define SMART goals and align them with KPIs (like conversion rate or customer retention) are more likely to achieve growth.
- Tracking content metrics such as click-through rates, sign-ups, and social shares offers insight into what drives user action.
- Platforms like SAS provide small businesses with forecasting and trend analysis that uncover new opportunities without enterprise-level resources.
Small business data analytics uses big data tools, algorithms, and BI platforms to turn raw information into clear, actionable insights. It helps you spot what’s working, identify problems, and make smarter decisions.
We’ll break down the best ways to approach data analytics, how big data can benefit your small business, and the top tools to get you started.
Why Is Data Analysis for Small Businesses Necessary?
Data analysis for small businesses delivers an objective assessment of your company’s performance. By analyzing the right data, you can gain key insights such as:
- Where your business currently stands
- Where it’s headed if current trends continue
- Your brand’s growth potential
- A realistic timeline for expansion
- The exact steps needed to scale successfully
When used effectively, you can empower your company to find solutions for your brand. From understanding customer behavior to spotting market trends and identifying internal issues, small business analytics puts information that was once out of reach directly into your hands.
Steps to Get Started With Data Analytics
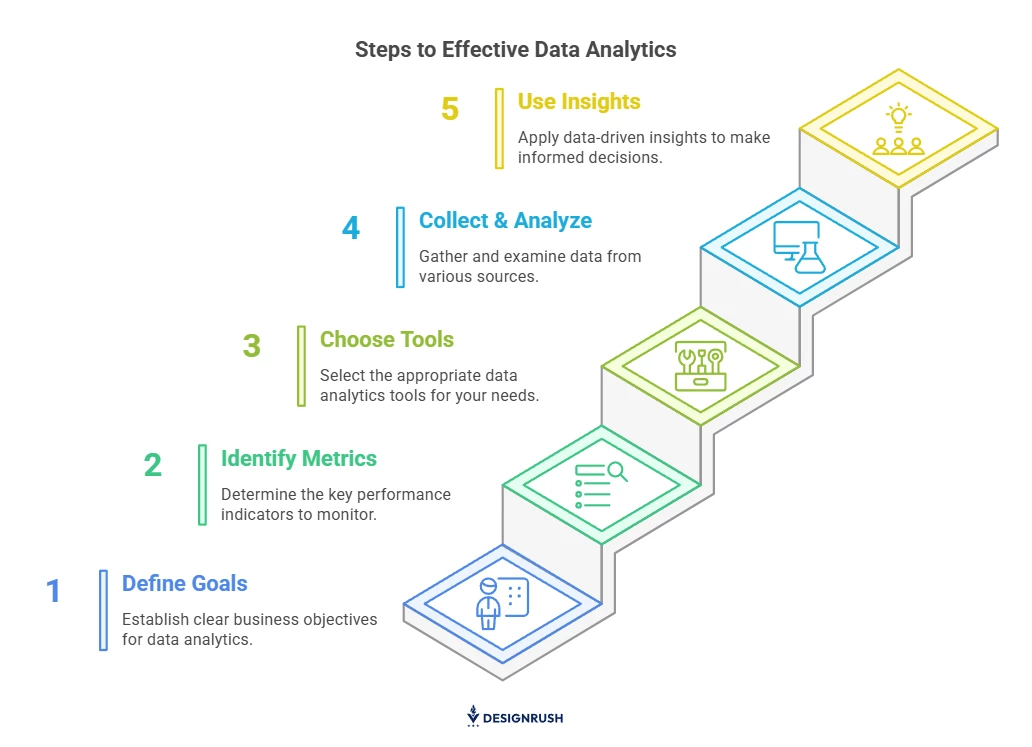
Consider the following steps on how you can start using data analytics for your small business even with limited resources or expertise.
- Define your business goals for data analytics
- Identify the key metrics to track
- Choose the right data analytics tools for your business
- Collect and analyze data from multiple sources
- Use data insights and take action
1. Define Your Business Goals for Data Analytics
The first step is identifying clear business goals aligning with your vision. Whether you’re aiming to boost sales, improve customer retention, or enhance operational efficiency, having a specific target will focus your analytics efforts. This clarity will help you determine which data to collect and how to measure your progress.
To make these goals actionable, try using the SMART framework by setting goals that are specific, measurable, achievable, relevant, and time-bound. Tools like Google Sheets or Excel are useful for tracking and organizing your goals, giving you a visual roadmap to measure your progress.
2. Identify the Key Metrics To Track
Once you’ve set your business goals, the next thing to do is to focus on the metrics that will help you measure progress. These metrics should be closely tied to your goals. For example, if your goal is to increase sales, you might track metrics such as conversion rates and average order value. If your focus is customer retention, metrics like customer lifetime value (CLV) and churn rate will provide more insight.
To track the right metrics, here are some useful tools:
- Google Analytics to monitor on-site traffic and user behavior.
- HubSpot CRM to monitor customer interactions and sales.
- Facebook Insights and Instagram Analytics to measure social media engagement and audience response.
These tools will help you stay on top of the metrics that matter most, ensuring that you can continuously track your progress.
3. Choose the Right Data Analytics Tools for Your Business
Selecting the right tools is crucial to analyze your data effectively. Start with simple, affordable options that suit your business’s immediate needs — Google Analytics and Excel are great entry-level tools. As your business grows, consider more robust solutions like CRM software or advanced data visualization platforms to keep pace with your expanding needs.
For more complex needs, here are a few options:
- Tableau and Power BI for advanced data visualization and reporting.
- Zoho Analytics for integrated analytics across departments.
- Google Data Studio for visualizing multiple data sources in one place.
- Choosing the right combination of tools ensures your analytics setup is scalable as your business evolves.
Tamir Roter, Chief Corporate Development Officer at Bright Data, adds:
"The right data tools don’t just display charts — they help small businesses spot patterns like customer churn, product demand fluctuations, or underperforming marketing channels. At Bright Data, we often advise businesses to start with tools that integrate easily with their existing systems and prioritize real-time visibility into what’s working and what’s not."
4. Collect and Analyze Data From Multiple Sources
Data collection is at the core of any analytics strategy, and you need to gather data from as many relevant sources as possible. These sources could include your website, CRM, email campaigns, and social media channels. Be sure you’re regularly tracking the same data points to make comparisons and draw meaningful conclusions.
You can start with Google Analytics to get a deep look at how users engage with your site while monitoring your social media with platforms like Sprout Social or HootSuite.
You can also automate data collection with tools like Zapier, which integrates your website, email, and social media into one cohesive system. This will help streamline the process and ensure you’re working with up-to-date information.
5. Use Data Insights and Act on Them
The last step is using the information gained from your data to make decisions that improve your business. Once you have collected and analyzed the data, use it to refine your marketing, sales, and operational strategies. This isn’t just about reporting — it’s about taking action based on what the data reveals.
Set up regular reporting intervals to review your metrics and adjust your strategies accordingly. Tools like IBM Watson can help you gain predictive insights that guide your decisions. By continuously monitoring and refining your strategies based on data, you ensure that your business remains agile and can make informed decisions in a constantly changing market.
Best Practices for Data Analytics for Small Businesses
Small business data analytics can monitor vital information that can help improve your sales performance, increase your bottom line, and bring in greater revenues.
Here are the best approaches so you can get the most out of big data for small businesses:
- Pay closer attention to trends
- Look and monitor beyond web traffic
- Keep an eye on how much you spend on customer acquisition
- Track content engagement based on accurate data
1. Pay Closer Attention to Trends
Trends in big data for small businesses are quantifiable information. They accumulate over time and explain patterns in the long term. When you follow these trends and spot the patterns they create, you can better predict and foresee where your business is going in the future.
With this practicable knowledge in hand, you can take action to support and sustain favorable trends. On the other hand, you can stop or come up with a resolution to overturn the negative, detrimental patterns.
Focus on these top trends and patterns in your big data for small business:
- Source of traffic: This report shows you the overview of where your audience and prospective clients come from before reaching your landing page. Segregate the direct source, i.e., website visits by audiences who directly key in your URL, from the organic source redirected from looking up your website on a search engine.
- Keywords use and SEO: This tells you which of your content are ranking well and which needs improvement. It also gives you a better idea of what content to generate in the future.
2. Look and Monitor Beyond Web Traffic
Apart from web traffic in general, you should also look into the following:
- Amount of time visitors stay on your website: Take note of the time period when people hang out on your site, browse through it, and interact. If your report exhibits a high bounce rate, it may be an indicator that you need a design revamp or better, more engaging content.
- The number of visitors that actually buy: Track and examine your conversion rate. It says a lot about the effectiveness of your messaging and your offering’s quality.
Based on the results of your demographic data analysis, you can then modify your future plans for marketing and products to sell. You can launch more efficient promotions, change your advertising tactics, and hence, improve your conversion rate.
3. Keep an Eye on How Much You Spend on Customer Acquisition
Customer lifetime value (CLTV) helps you estimate the potential net profit from different client segments you serve. By analyzing this area of your small business data analytics report, you can focus your investments on acquiring and retaining customers who:
- Generates the most revenues
- Is most fitting and rewarding for your brand
- With whom your products or services resonate the most
4. Track Content Engagement Based on Accurate Data
They say content is king — and that couldn’t be truer for businesses in the digital space. As a business owner, your goal is to grab your audience’s attention, keep them engaged, and ultimately persuade them to take action, whether that’s placing an order, signing up, or making contact.
Content engagement and effectiveness come down to the quality, relevance, and relatability of the messages you put out there. Here are the metrics to watch out for when you perform data analytics for small businesses:
- Signups: Give your website visitors the option to sign up for your email newsletters. Briefly explain to them what is in it for them when they subscribe to your updates.
- Click-through rates (CTR): So, you have a long list of subscribers. Now, what you should do is analyze how many of them take the time to open your mail and act on your CTAs. Consequently, the higher your CTR is, the greater the chances for conversion, and ultimately, the better for your business.
- Social sharing: While likes and comments signal engagement, social shares matter just as much. They expand your reach and show that your content is valuable enough to pass along.
5 Most Effective Big Data for Small Business Solutions
Big data for small businesses can be obtained through various tools. Here are some of the most prominent solutions for data analytics for small businesses.
1. Google Analytics
Google Analytics is one of the easiest ways for small businesses to start making sense of website data. It helps you see where your visitors are coming from, how they interact with your site, and how long they stick around.
All the key insights — traffic sources, visitor behavior, device types, and even social media activity — are brought together in one place, so you’re not guessing what’s working and what’s not. It’s a simple, powerful way to understand your audience better and make smarter decisions as you grow.
2. Statistical Analysis Software (SAS)
SAS is a powerful analytics tool that helps you collect, manage, and analyze data from different sources like your website, social media, and marketing platforms. It lets you filter through the noise and focus on the insights that really matter to your business.
Once you’ve gathered your data, SAS steps in with advanced analytics, forecasting, and data-mining features. You’ll gain a clearer picture of your customers, your market, and what’s happening inside your business — without needing a massive budget or team.
It’s user-friendly and built to help small businesses spot what’s working, identify problem areas, and uncover new opportunities. With SAS, you can make smarter decisions and get your business ready for growth and stronger competition.
3. Kissmetrics
Kissmetrics is designed to help your business boost ROI by optimizing your marketing efforts. This platform focuses on understanding consumer behavior so you can categorize your audience and increase engagement.
With Kissmetrics, you can easily build, manage, and automate email campaigns based on customer data insights. It allows you to track clicks, analyze their meaning, and measure social shares and other forms of engagement.
Kissmetrics also offers a specialized tool for eCommerce businesses. This feature is tailored to improve ROI from Instagram and Facebook marketing, reduce cart abandonment, and encourage repeat purchases.
4. Alteryx
Alteryx is a powerful data analytics platform that’s perfect for small businesses. It offers advanced data mining tools that simplify complex business data, making it easy to understand and use.
Combining your company’s internal data with publicly available data, Alteryx helps you make smarter business decisions and more effective strategies. You can create customized, easy-to-understand graphs, storylines, and other useful interactive visuals through its dashboard. This makes it easier to collaborate with your team and share insights across your organization.
Beyond big data for small business, Alteryx also tailors its data extraction to specific departments like operations, marketing, sales, and customer support.
5. InsightSquared
What sets InsightSquared apart is its automation and seamless integration with other popular business tools you may already use, like Zendesk and Salesforce. This platform streamlines small business data analytics, saving you time by eliminating manual data mining.
With InsightSquared, you no longer need to manually fill out endless spreadsheets. It lets you quickly gather big data and provides actionable insights in real time. For instance, if you’re already using CRM software, InsightSquared enhances your efforts by offering valuable sales intelligence, including:
- Lead generation and tracking
- Activity monitoring
- Sales forecasting
- Profitability analysis
With these insights, you can identify trends, celebrate strengths, and pinpoint weaknesses, allowing you to take action where it counts. The suite of products offered by InsightSquared also covers financial and marketing reports as well as support analysis tools.
Strategies and Techniques for Leveraging Data Analytics
Now that we’ve covered the basics of data analytics and its importance for small businesses, let's dive deeper into how you can use these insights to drive real results. Applying specific strategies can optimize various aspects of your operations, including marketing, customer retention, and inventory management.
Here are key techniques that will help you make the most of data to improve your decision-making processes.
- Boost targeting and personalize campaigns with data
- Identify sales trends and predict customer behavior
- Solve customer pain points and reduce churn
- Optimize inventory and cut costs with data
1. Boost Targeting and Personalize Campaigns With Data
To improve targeting and personalize your campaigns, start by gathering as much relevant data as possible. Use this data to segment your audience based on demographics, purchase behavior, and online activity. Once your audience is segmented, craft personalized messaging tailored to each group’s specific interests and pain points.
To ensure success with targeting and personalization, follow these tips:
- Regularly monitor campaign performance to refine messaging strategies.
- Use A/B testing to compare different campaign approaches and optimize results.
- Create a process for tracking conversions in your analytics platform to measure campaign success.
- Take advantage of automation tools to send personalized messages at scale.
2. Identify Sales Trends and Predict Customer Behavior
Start by analyzing your past sales data to pinpoint patterns that can inform your future decisions. Look at factors like seasonal trends, purchasing frequency, and customer demographics. With this information, you can predict future sales trends and adapt your sales strategies accordingly, ensuring you’re always one step ahead.
For better results, consider these tips:
- Use predictive analytics tools to automate trend forecasting.
- Regularly update sales models with fresh data to keep predictions accurate.
- Collaborate with your sales team to integrate frontline insights into forecasts.
- Review past trends and adjust strategies for seasonal changes.
3. Solve Customer Pain Points and Reduce Churn
To identify customer pain points, gather feedback through surveys, reviews, and direct communication. Analyze this data to uncover recurring issues and areas where customers may be dissatisfied.
Once you’ve identified these pain points, focus on improving the customer experience and addressing these concerns proactively.
To maximize the effectiveness of this strategy, keep these tips in mind:
- Use automated tools to collect and analyze customer feedback in real time.
- Train your customer service team to address issues quickly and efficiently.
- Continuously monitor customer satisfaction metrics to track progress.
- Apply changes based on feedback and measure their impact on retention.
4. Optimize Inventory and Cut Costs with Data
Effective inventory management begins with analyzing your historical sales data to predict demand. Use this information to make more accurate forecasts, ensuring that you stock enough products without overstocking.
By aligning inventory levels with demand, you can reduce excess inventory and avoid unnecessary stockouts, which directly impact your bottom line.
For success, follow these tips:
- Use automated inventory tracking systems that update in real time.
- Integrate sales data with your inventory system for more accurate forecasting.
- Regularly review your inventory data and adjust forecasts based on trends.
- Work closely with suppliers to ensure you have flexible and responsive supply chains.
Takeaways on Small Business Data Analytics
Data analytics for small businesses offers a smart and steady route to making data-backed decisions for your company. Results extracted from proper data analysis for small businesses let you in on inside information on your brand and business that you may have been overlooking this whole time.
Whether through tools or expert data analysis services, small business data analytics can transform the way you manage and grow your business. Browse through our selection of digital marketing companies that can help.
Small Business Data Analytics FAQs
1. Can small businesses use data analytics?
Businesses of all sizes generate vast amounts of data, and using this data effectively can be the key to success. By utilizing data analytics, small businesses can improve their efficiency and productivity. Additionally, data analytics can provide a competitive advantage, leading to increased revenue.
2. How do you do analytics for small businesses?
The six steps to doing analytics for small businesses include:
- Data collection
- Evaluation of data relevance and accuracy
- Gaining better insights
- Improving in-house capabilities
- Data visualization and
- Turning insights into action
3. How do you evaluate Google Analytics data for small businesses?
There are a few tips to evaluate Google Analytics data for small businesses. These are:
- Checking the goal conversion pages
- Checking if the landing pages are getting traffic
- Tracking the page site speed and website visitors
- Checking page load issues