Brands that use data to inform strategy and customer experiences are better positioned to lead in the eCommerce industry.
eCommerce Statistics: Key Findings
- More than 56% of internet users worldwide make an online purchase every week.
- Holiday shopping periods continue driving massive ecommerce spikes, with Cyber Monday 2025 generating $14.25 billion in online sales and total Cyber Week sales reaching $44.2 billion.
- Cart abandonment ratesaverage 74.7% globally and climb as high as 85% on mobile devices.
Key eCommerce Statistics To Know in 2026
The numbers reveal how consumer expectations, mobile shopping habits, AI adoption, and digital purchasing behaviors are reshaping the future of online retail.
We’ve compiled a list of eCommerce statistics that will guide your strategy, enhance service delivery, and improve client outcomes. Use these insights to stay ahead of the pack through smarter decision-making and a clearer view of emerging growth opportunities.
Global eCommerce Market Size and Growth Statistics
As global digital sales surge, agencies must understand the drivers and benchmarks that shape market expansion to craft compelling, data-driven strategies.
- Online shopping is breaking all records
- Regional eCommerce markets are diverging
- Shopify, Amazon, and WooCommerce are leaders in eCommerce
1. Online Shopping Is Breaking All Records

According to Statista’s data report, global eCommerce revenue is expected to reach $3.88 trillion in 2026 and grow at a compound annual growth rate (CAGR) of 6.84% through 2030, resulting in a projected market volume of $5.05 trillion.
Data-backed strategies that improve customer experiences and scale digital operations will be needed to capitalize on that long-term market growth.
To seize global momentum, agencies should:
- Emphasize data-backed proposals grounded in global performance benchmarks.
- Identify cross-border opportunities for clients looking to scale internationally.
- Stay ahead of evolving privacy, payment, and logistics regulations.
Here’s what the numbers say about market size:
- In 2025, eCommerce accounted for over 23 percent of retail sales worldwide, as per Statista.
- The same research predicts that 25% of all global retail purchases will be made online by 2030.
- The report also notes that retail eCommerce sales surpassed $3.66 trillion globally in 2025 and are on track to reach $5 trillion by 2030.
2. Regional eCommerce Markets Are Diverging
Each region exhibits distinct patterns in adoption, payment preferences, and regulation — agencies must tailor local strategies accordingly.
To achieve this, they should consider:
- Localizing language, payment methods, and pricing for each market.
- Leveraging regional logistics partners to speed delivery and reduce costs.
- Implementing multi-currency and VAT-compliant checkouts to remove friction.
Asia-Pacific (APAC) Leads Global Digital Commerce
The APAC region continues to outpace other markets, driven by rapid digital adoption and localized payment innovations.
Here’s the data highlighting APAC’s scale:
- Asia-Pacific will remain the world’s largest eCommerce market, accounting for more than 60% of global retail eCommerce sales, according to EMARKETER’s Asia-Pacific eCommerce Forecast 2026.
- The same research found that overall retail sales across the Asia-Pacific region are projected to grow by 4.9% in 2026.
- Retail eCommerce sales growth across APAC is projected to range from 21.5% in the Philippines to 4.7% in Japan in 2026, revealing the region’s wide variation in market maturity and growth potential, per EMARKETER.
- China is approaching 50% eCommerce penetration, driven largely by instant commerce and content-led shopping experiences, the report also found.
North America Doubles Down on Convenience and Subscription Models
North American eCommerce growth is fueled by consumer demand for convenience, personalization, and subscription models.
Here are some of the critical North America figures:
- According to Statista, North America eCommerce revenue is projected to exceed $1.8 trillion by 2029.
- U.S. online grocery sales are expected to reach $452 billion by 2028, according to a 2026 FMI and NielsenIQ ecommerce report.
- Apparel remains one of the dominant drivers of U.S. eCommerce growth, with the online fashion retail market projected to grow by more than $300 billion between 2025 and 2029, according to Technavio.
Europe Accelerates Cross-Border Shopping
European eCommerce growth is increasingly driven by cross-border commerce, rising online shopping adoption, and evolving digital regulations.
To strengthen their position across European markets, businesses should:
- Localize payment methods, currencies, and customer experiences by region.
- Invest in cross-border logistics and fulfillment capabilities.
- Stay compliant with evolving EU privacy, sustainability, and digital commerce regulations.
- Optimize mobile shopping and multilingual storefront experiences.
Here’s what the latest European eCommerce data reveals:
- European B2C eCommerce turnover reached $955 billion in 2024, up from $890 billion the previous year, according to the 2025 European E-commerce Report.
- Cross-border commerce continues expanding across the region, with one-third of EU consumers now shopping from retailers in other European countries.
- More than 77% of EU internet users purchased products online in 2024, accroding to a Eurostat report.
- Ireland recorded the highest share of online shoppers in Europe at 95%, followed closely by the Netherlands at 94%, according to a 2025 EuroCommerce report.
3. Shopify, Amazon, and WooCommerce Are Leaders in eCommerce
Marketplaces accounted for 18% of global online purchase orders in 2025, reinforcing their continued dominance in digital commerce, while 9% of online shoppers reported purchasing from online supermarkets, according to Statista.
Agencies should consider these strategic approaches:
- Leverage Shopify’s ease and app ecosystem for rapid SMB deployments.
- Tap into Amazon’s vast fulfillment network and marketplace reach for volume growth.
- Utilize WooCommerce’s flexibility and cost-efficiency for full control and customization.
Shopify Powers SMB eCommerce Growth
Shopify’s intuitive setup and vast app ecosystem make it the platform of choice for small and mid-sized brands aiming for rapid, reliable growth.
Take a look at the metrics that prove its SMB dominance:
- 27% year-over-year revenue growth in Q1 2025, as per Shopify Q1 2025 Financial Results.
- According to BuiltWith’s statistics, Shopify accounts for approximately 10-12% of the global eCommerce platform market share, particularly strong in small to medium business segments.
- Shopify merchants processed more than $100 billion in gross merchandise volume (GMV) during Q1 2026.
Amazon Continues To Dominate Digital Marketplaces
With an ecosystem that spans the globe and an unmatched fulfillment infrastructure, Amazon’s metrics speak volumes about its market dominance.
Here’s why Amazon remains the marketplace powerhouse:
- Amazon accounted for nearly 40% of all U.S. retail eCommerce sales in 2025, maintaining its position as the country’s dominant online marketplace, according to EMARKETER.
- According to Analyzify’s survey, 50% of Gen Z compare prices on Amazon before placing an order.
- Amazon’s advertising business is projected to surpass $60 billion in global ad revenue in 2026 as brands continue increasing investment in retail media and sponsored product placements, according to WARC Media.
WooCommerce Offers Flexibility and Full Store Control
WooCommerce’s open-source architecture and expansive extension library empower brands with complete flexibility and cost control.
These stats highlight its customizable prowess:
- WooCommerce powers 20.1% of global online stores, as per BuiltWith’s data.
- WooCommerce offers over 400+ official extensions and plugins enabling tailored features like subscriptions, bookings, and payments.
AI, Social Commerce, and Emerging eCommerce Trends
Social platforms and AI-powered tools are rapidly reshaping how consumers discover products, evaluate brands, and complete purchases online. Keeping up means investing in faster, more personalized, and more interactive shopping experiences across every stage of the customer journey.
1. Social Commerce Trends
Global sales generated through social platforms hit nearly $700 billion in 2024, marking a shift in how consumers discover and purchase products (Statista).
Social commerce is booming across every major platform, with Instagram and TikTok leading the way with in-app shopping features and influencer-driven product discovery. Even Pinterest has leaned into product tagging and shoppable pins, turning inspiration into instant transactions.
This cross-platform growth shows that consumers are no longer just browsing on social media, they’re shopping there too. Here’s how brands can capitalize on this growing sales channel:
- Make your products easily shoppable on TikTok, Instagram, Facebook, and Pinterest.
- Collaborate with social media influencers and creators to drive authentic discovery.
- Use livestream shopping, user-generated content, and social proof to boost engagement.
- Drive urgency and build hype by releasing products or discounts exclusively through your social channels.
- Use trending sounds, challenges, and authentic storytelling to boost engagement and build trust.
More and more shoppers are discovering, researching, and buying products without ever leaving their favorite platforms. Here are some other statistics that demonstrate the power of social selling:
- There are now more than 5.6 billion social media users worldwide (73% of the population), making it a leading channel for product discovery and brand engagement, according to Statista.
- The global social commerce market was valued at approximately $764 billion in 2024 and is projected to grow at a compound annual growth rate (CAGR) of 31.6% through 2030, according to Grand View Research.
- eMarketer findings show that 4 in 10 customers hold back from social media purchases over safety concerns.
2. AI-Driven Commerce
With AI revolutionizing every touchpoint of the buyer journey, agencies must integrate intelligent tools to meet rising consumer expectations and operational efficiencies.
Here are the smartest AI tactics right now:
- Incorporate AI personalization engines like Dynamic Yield or Bloomreach into vendor proposals.
- Train client teams to translate predictive analytics into marketing and inventory actions.
- Deploy AI-powered chatbots and visual search to reduce support overhead.
Here’s what the AI data shows:
- According to Segment’s research, over 92% of top-performing eCommerce companies use AI for dynamic, personalized product feeds.
- 55% of Statista’s global survey respondents expressed confidence in AI’s ability to replace human interaction for assembling and presenting product information before purchases.
- Customer service and support were the leading AI applications of 34% of companies during 2024 (Statista).
- However, only nine percent of respondents in the Statista survey believe that using AI for customer service improves their online shopping experience. Roughly 56% think that it depends on how it is used, while around 14% believe that it makes the shopping experience worse.
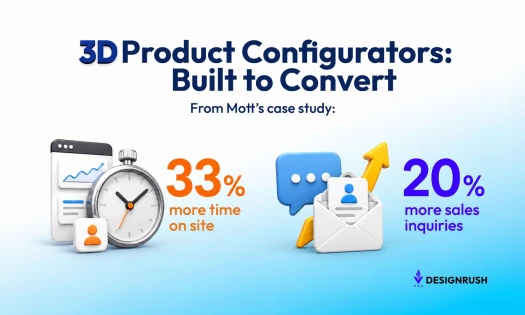
Case Study: AI-Powered Customer Service Improves Ecommerce Payment Recovery
In a recent Parloa case study, an AI agent built for a leading global ecommerce and fintech company achieved a 66% promise-to-pay rate during payment reminder interactions, outperforming human agents by 15 percentage points while also improving payment fulfillment rates.
Mobile Commerce Statistics and Trends
Mobile commerce are transforming the buyer's journey. Consumers now expect instant, seamless, and interactive experiences, especially on mobile-first platforms like TikTok, Instagram, and direct-to-consumer storefronts.
- Mobile is leading the eCommerce surge
- A mobile-optimized experience is non-negotiable
- Mobile wallets are the new checkout standard
1. Mobile Is Leading the eCommerce Surge
 Mobile’s share of eCommerce revenue has steadily grown over the years, rising from 43% in 2018 to an estimated 63% by 2028.
Mobile commerce is rapidly becoming the primary way consumers shop. From discovery to checkout, smartphones are driving the majority of eCommerce growth, and that momentum isn’t slowing down anytime soon.
Here’s how you can make sure your eCommerce site is ready for customers on mobile:
- Invest in mobile-first design tools and responsive templates.
- Run mobile-specific promotions to reach users where they’re most active.
- Design vertical, scroll-stopping ad campaigns to grab attention on mobile feeds.
- Test all campaigns and landing pages on mobile before launching.
- Use SMS marketing for limited-time offers and cart reminders. Text messages have high open rates and are perfect for reaching customers who are always on their phones.
User behavior and mobile eCommerce statistics show that smartphones are now the center of the online shopping experience:
- ConsumerAffair’s report finds that over 30% of the U.S. population uses their mobile phone to purchase something online at least once a week.
- In Q1 2026, smartphones generated 52.27% of global website traffic.
- During Q4 2025, smartphones drove nearly 75% of retail website traffic in the U.S. and accounted for approximately two-thirds of all online shopping orders.
- Around 46% of U.S. eCommerce mobile users are aged 18 to 24, showing just how deeply rooted mobile shopping is in younger audiences (Statista).
2. A Mobile-Optimized Experience Is Non-Negotiable
If your site doesn’t perform well on a phone or tablet, you’re losing customers before they even see your product pages. According to Webflow’s State report, 67% of consumers say they prefer to shop on mobile-friendly websites. They expect speed, simplicity, and intuitive navigation.
Here’s how to deliver:
- Prioritize mobile UX across your entire eCommerce funnel, from homepage to checkout.
- Design thumb-friendly, conversion-driven mobile UX.
- Use large, easy-to-tap buttons and thumb-friendly layouts.
- Eliminate pop-ups or elements that block content on small screens.
- Ensure fast load times; aim for 2 seconds or less.
- Enable autofill for shipping and payment fields and integrate with mobile wallets for quick data entry.
Users on mobile aren’t just browsing casually; they’re ready to take action. But if your mobile site frustrates them, numbers show they’ll leave in seconds:
- Consumers are more inclined to add products to their shopping carts when using mobile devices, as per Statista’s data.
- Roughly 3 out of 4 mobile sites fail to leave enough space between tappable elements like buttons and links. This small detail can lead to frustrating misclicks and significantly hurt the user experience (Baymard Institute).
- According to Google, almost three-quarters of shoppers (74%) say they’re more inclined to revisit a retailer’s site if it’s mobile-friendly.
3. Mobile Wallets Are the New Checkout Standard
Digital wallets accounted for more than 53% of global eCommerce transactions in 2025 as consumers increasingly prioritized faster, more seamless mobile checkout experiences, according to Worldpay Global Payments Report 2025.
Not offering digital wallet options could be costing you serious revenue. Here’s how to change that:
- Integrate mobile-friendly payment options like Apple Pay, Google Pay, and PayPal.
- Highlight the availability of digital wallets at the start of the checkout flow.
- Reduce the need for manual data entry with saved payment options and auto-fill.
- Use trust badges and security messaging to reinforce safe transactions.
- Incentivize wallet use with small perks like faster checkout, loyalty points, or exclusive discounts.
Fast, frictionless payments are a must, and shoppers are showing less patience for merchants who don’t offer them:
- Mobile/digital wallets are the second most popular payment method (after credit cards), preferred by 68% of US consumers.
- The global mobile wallet market surpassed $13.6 billion in 2025 and is projected to grow to approximately $115.2 billion by 2035.
eCommerce Conversion Rate Benchmarks by Industry
 Conversion rates vary a great deal across industries, devices, and product categories, making benchmarking essential for evaluating eCommerce performance.
While the global average conversion rate typically falls between 2% and 3%, high-intent categories like food and beauty consistently outperform luxury and high-consideration purchases.
To improve conversion performance, businesses should:
- Optimize mobile experiences to reduce friction across the buying journey.
- Use reviews, social proof, and trust signals to increase purchase confidence.
- Simplify checkout flows and reduce unnecessary form fields.
- Personalize product recommendations and merchandising strategies.
- Continuously test landing pages, CTAs, and checkout experiences through A/B testing.
According to Dynamic Yield’s 2026 benchmark data, here’s what the latest conversion rate data reveals across the eCommerce sector per industry:
- The current global average eCommerce conversion rate is 2.76%.
- Food and beverage brands lead all categories with an average conversion rate of 5.51%, reflecting strong purchase intent and frequent repeat buying behavior.
- Beauty and personal care brands continue outperforming the market with an average conversion rate of 4.31%, driven by loyalty and subscriptions.
- Pet care and veterinary services also perform strongly, averaging conversion rates of 4.1%.
- Multi-brand retailers average conversion rates of 3.44%, benefiting from broader product selection and cross-category purchasing behavior.
- Fashion, accessories, and apparel brands average conversion rates of 2.84%, slightly above the global benchmark despite high competition and return rates.
- Consumer goods brands average conversion rates of 2.7%, close to the broader eCommerce average.
- Home and furniture brands see lower conversion rates at 1.23%, largely due to higher price points and longer customer decision cycles.
- Luxury and jewelry remain among the lowest-converting eCommerce categories, averaging just 0.85% because of high-consideration purchasing behavior and premium pricing.
Online Shopping Consumer Behavior Statistics
Deciphering customer behavior through detailed metrics empowers agencies to fine-tune tactics that drive conversions and loyalty.
- Online shopping is a regular habit
- Sustainability still influences trust but value comes first
- Cross-border and international shopping trends
1. Online Shopping Is a Regular Habit
Over 56.1% of internet users aged 16 to 64 make at least one online purchase every week, per Datareportal’s report. Furthermore, nearly 43% of shoppers in the U.S. say they’d rather shop online than in a physical store (Statista).
In the digital age, the convenience of eCommerce is a core part of the modern shopping routine.
Deploying effective eCommerce strategies means you’ll be able to capture a massive audience and potentially see healthy long-term returns. To capitalize on this online shopping trend:
- Update your product listings and run weekly promotions to catch recurring buyers.
- Invest in retargeting ads to stay top-of-mind between shopping cycles.
- Offer incentives like flash sales or loyalty points to reward repeat purchases.
- Scale operations with future growth in mind.
- Build backend systems that can handle seasonal surges and global traffic.
Despite economic uncertainty, recent eCommerce stats show how shoppers are spending more online than ever before:
- More than half of online adults worldwide now make purchases online every week, with weekly ecommerce shopping activity reaching roughly 56% in 2025, according to DataReportal’s Digital 2025 Global Overview Report
- Statista reports the number of eCommerce market users is expected to amount to 4.1 billion by 2030.
- User penetration stands at 54.3% in 2026, Statista found, and is expected to reach 58.1% by 2030.
- Hostinger reports that over one-third of people worldwide (34%) now regularly shop online to fulfill their needs.
2. Sustainability Still Influences Trust but Value Comes First
Economic pressure is reshaping how consumers think about sustainability. NIQ’s 2026 sustainability analysis found that concern around climate change and environmental pollution has softened compared to previous years as shoppers increasingly prioritize affordability, convenience, and personal financial security.
That doesn’t mean sustainability no longer matters, only that consumers now expect brands to offer practical, transparent sustainability efforts that offer value and convenience rather than relying on broad ESG messaging alone.
To stay competitive, eCommerce brands should:
- Focus on clear, measurable sustainability initiatives rather than vague claims.
- Highlight practical consumer benefits like recyclable packaging, refill systems, and locally sourced products.
- Communicate sustainability efforts transparently across product pages, packaging, and post-purchase messaging.
- Avoid greenwashing by backing claims with certifications, sourcing details, and operational proof points.
- Balance sustainability messaging with affordability and product quality.
Recent consumer trend data shows how sustainability priorities are evolving:
- NIQ’s 2026 sustainability analysis found that nearly half of U.S. consumers now prioritize economic security over environmental concerns when forced to choose between the two.
- Cost remains one of the biggest barriers to sustainable purchasing behavior, with 41% of consumers saying sustainable products are too expensive.
- eCommerce shoppers increasingly expect clear sustainability proof points like recyclable packaging and transparent sourcing, and nearly two-thirds of consumers say brands don't provide enough information to verify environmental claims.
- Only 38% of consumers are willing to pay a premium of up to 5% for sustainable products in 2025, according to Capgemini’s 2025 Consumer Trends Report.
3. Cross-Border and International Shopping Trends
Improved logistics networks, localized payment options, and faster international shipping have made it easier for shoppers to buy products from brands outside their home countries.
To compete in international ecommerce markets, brands should:
- Offer localized payment methods, currencies, and multilingual shopping experiences.
- Clearly communicate international shipping costs, taxes, and delivery timelines.
- Partner with reliable global fulfillment and logistics providers.
- Optimize mobile shopping experiences for international audiences.
- Use regional marketplaces and cross-border advertising strategies to expand reach.
Here’s what the latest cross-border ecommerce data reveals:
- DHL’s 2025 Cross-Border Buying Behavior Trends report found that 59% of global shoppers purchase from retailers based in other countries, while 35% shop internationally at least once per month.
- According to DHL, 7 in 10 shoppers say they only purchase from countries they trust, highlighting the importance of brand credibility and localized customer experiences in international ecommerce.
- DHL’s also found that 40% of global shoppers are more likely to buy from international retailers when delivery is handled by a trusted logistics provider.
eCommerce Retention, Loyalty, and Customer Experience Statistics
Brands are addressing the issue of intensified competition in eCommerce by improving customer retention, repeat purchases, and long-term loyalty.
From subscriptions and personalized rewards to free shipping and seamless customer support, today’s shoppers expect experiences that deliver both convenience and value.
Subscriptions and Loyalty Programs Boost Long-Term Value

The subscription eCommerce market is projected to reach approximately $5.36 trillion by 2030, growing at a compound annual growth rate (CAGR) of 58%. Subscription models make life easier for your customers and more predictable for your business.
They’re a win-win when done right.
When you remove the need for customers to decide what to purchase every time, you lock in convenience and long-term loyalty. Add personalized rewards, and you’ll have a customer for life.
Here’s how you can leverage subscriptions and loyalty programs for your brand:
- Offer subscriptions for replenishable or high-use products like skincare, food, and pet supplies.
- Give early access or exclusive perks to subscribers or loyalty members.
- Allow flexibility and make it easy to pause, cancel, and change subscription options.
- Reward long-term loyalty with VIP tiers or milestone gifts.
- Implement referral schemes to drive repeat purchases.
- Use personalized reminders or auto-renewal notifications to keep the experience smooth.
- Recover lost sales through exit-intent offers and retargeting.
The line between loyalty and convenience is becoming thinner. These online shopping statistics show that even small points of friction can cause customers to walk away:
- According to Invesp’s report, 54% of online shoppers have signed up for at least one subscription box service.
- Recurly Research finds that over 70% of businesses offer more than one type of subscription product or service. Providing variety is important for attracting more customers and providing more value in the long run.
Great Customer Experience Builds Long-Term Loyalty
Customer experience has become one of the biggest differentiators in eCommerce. Shoppers have access to more brands, marketplaces, and pricing options, so businesses need to deliver fast, personalized, and frictionless support to retain customers and drive repeat purchases.
Here are actionable ways to make every interaction with your brand feel seamless, rewarding, and personalized:
- Give early access to new products or promotions as a perk for repeat buyers and loyalty members.
- Offer support across multiple channels, including live chat, email, social media, and SMS.
- Make automated customer support feel conversational, helpful, and human.
- Use customer data, personalization tools, and insights from eCommerce site search statistics to improve product discovery and post-purchase experiences.
- Follow up with customer satisfaction surveys and proactive support messaging to identify issues early.
Customer expectations around eCommerce support and personalization continue rising. Here’s what the latest data shows about the importance of customer experience:
- More than half of consumers say they would stop buying from a brand after a poor customer experience, according to PwC’s 2025 Customer Experience Survey.
- More than half of online shoppers are more likely to return to ecommerce websites that offer personalized product recommendations.
- According to Deloitte, 80% of consumers prefer brands that offer personalized shopping experiences and report spending up to 50% more with those brands.
eCommerce Checkout, Cart Abandonment, and Fulfillment Statistics
Cart abandonment remains one of the biggest revenue challenges in ecommerce. According to Dynamic Yield by Mastercard, the global cart abandonment rate averages 74.7%, rising to as high as 85% on mobile devices, per Statista.
According to Baymard Institute, eCommerce sites have the potential to boost conversion rates by over 35% by improving how their checkout flow is designed.
This final step is where many brands lose the sale, but it doesn’t have to be. With a few smart adjustments, you can turn abandoned carts into completed checkouts:
- Enable guest checkout so users don’t have to create an account to complete a purchase.
- Display total costs (shipping, taxes, fees) early in the checkout process to avoid last-minute surprises.
- Add trust signals like security badges, payment logos, and secure payment options to build confidence in your brand’s logistics process.
- Use exit-intent popups to offer a last-minute incentive before the user leaves the checkout page.
- Include customer reviews and ratings on product pages and use high-quality photos and videos to show the value of your offerings.
Checkout Friction Continues To Hurt Ecommerce Conversions
To keep customers moving smoothly toward a completed purchase, your checkout process needs to be fast, clear, and built entirely around user convenience. These stats show that even small points of friction can cause shoppers to walk away:
- Cart abandonment is highest in categories like luxury goods (over 80%), as per Statista.
- According to Baymard Institute, eCommerce sites have the potential to boost conversion rates by over 35% by improving how their checkout flow is designed.
- Baymard Institute’s 2025 checkout research found that 18% of U.S. online shoppers have abandoned an order because the checkout process was too long or complicated.
- Around 20% of customers say they bail out at checkout because they don’t trust the site with their credit card details (Baymard Institute).
- Statista reveals that almost 39% of customers in the U.S. cite unexpected fees (shipping, taxes, etc.) as a reason for abandoning their purchases.
Value, Convenience, and Flexible Returns Shape Purchase Decisions
Over 56% of global shoppers say better pricing is the top reason they’d buy directly from a brand’s online store (Statista). They compare prices, look for exclusive deals, and expect added value when purchasing. It’s about getting the best deal and a little something extra.
Here’s how you can respond to this mindset:
- Offer exclusive website-only discounts or bundles to attract more buyers.
- Highlight price guarantees or “best deal” messaging to build trust with cost-conscious shoppers.
- Bundle complementary products at a discounted price to encourage higher-value purchases.
- Create urgency with limited-time or seasonal pricing to drive faster decision-making.
- Clearly communicate savings on product pages and in the shopping cart.
And it’s not just about price. Perks like free shipping and easy returns play a huge role in converting and retaining customers. Let’s look at a few more stats that show how these are shaping buyer behavior:
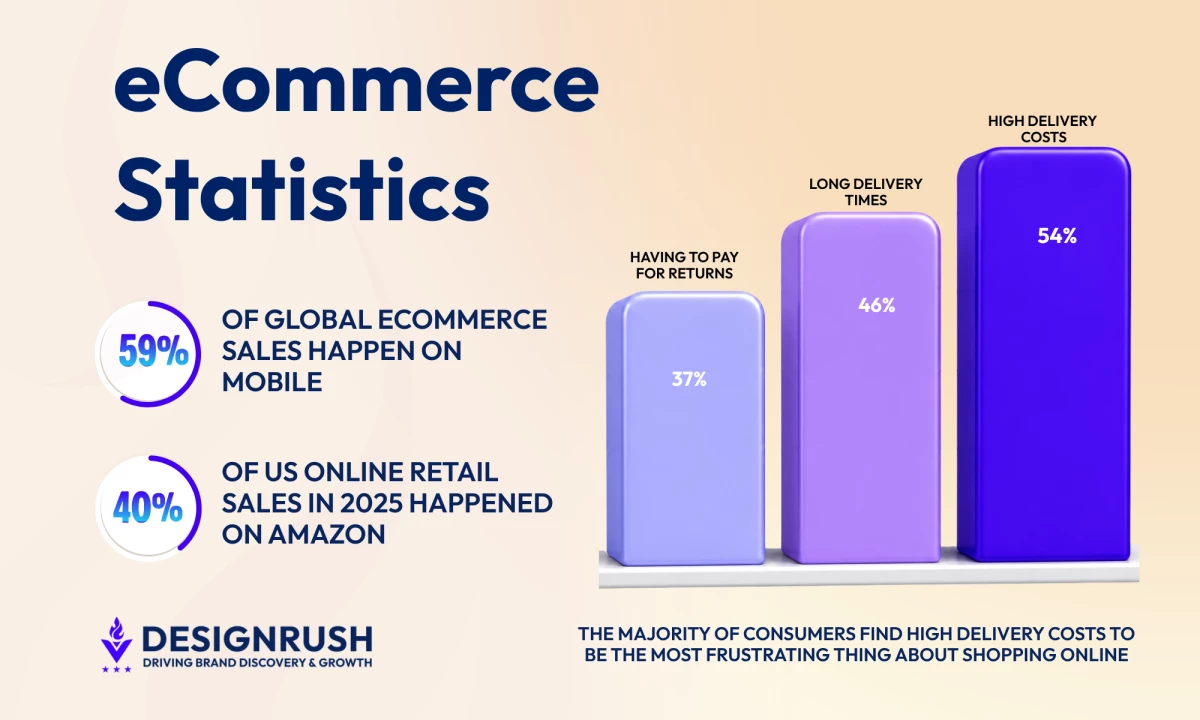
- DHL’s 2025 eCommerce Trends Report found that 72% of global shoppers (up from 67% in 2024) said free delivery improves their shopping experience, and 76% of US shoppers abandon their carts if their preferred delivery option isn’t available.
- 55% of global shoppers say they mostly buy from retailers that offer free returns, DHL’s report also found.
- High delivery costs are the most contentious eCommerce aspect for 54% of adults worldwide, according to eMarketer.
- According to International Council of Shopping Centers, around 82% of consumers say that return policies influence their eCommerce purchase decisions.
Holiday Shopping and Peak Season eCommerce Trends

Holiday shopping periods continue generating some of the biggest ecommerce revenue spikes of the year, with Black Friday, Cyber Monday, and seasonal promotions driving record-breaking online sales growth.
As more consumers shift toward digital-first shopping experiences, peak retail events now play a major role in annual ecommerce performance.
To maximize results during high-traffic shopping periods, ecommerce brands should:
- Launch limited-time promotions and exclusive holiday bundles to create urgency.
- Optimize mobile shopping experiences and checkout flows for increased smartphone traffic.
- Use personalized email, SMS, and retargeting campaigns to capture high-intent shoppers.
- Prepare fulfillment and customer support systems for seasonal traffic surges.
- Monitor advertising costs closely as competition intensifies during peak retail periods.
Here’s what the latest holiday ecommerce data reveals:
- Adobe Analytics reported that Cyber Monday 2025 generated a record-breaking $14.25 billion in online sales, up 7.1% year over year, making it the largest online shopping day of the year.
- Adobe also found that total Cyber Week online sales reached $44.2 billion in 2025, reflecting 7.7% year-over-year growth as consumers increasingly embraced digital holiday shopping.
- Mobile shopping continues dominating peak retail periods, with mobile devices accounting for 58% of Cyber Monday purchases during the 2025 holiday shopping season, according to Adobe Analytics and AP News reporting.
- EMARKETER projects U.S. retail media ad spending will grow from $60.3 billion in 2025 to over $71 billion in 2026 as holiday advertising competition intensifies.
eCommerce Statistics: Final Words
These ecommerce stats highlight a clear move toward online retail: consumers expect faster, more personalized, and frictionless shopping experiences across every touchpoint.
Adapt to these emerging eCommerce trends, mobile-first behaviors, and evolving customer expectations to improve conversions, strengthen loyalty, and drive long-term growth in 2026 and beyond.
![]()
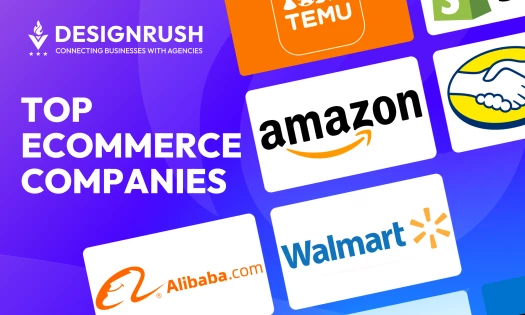
Our team ranks agencies worldwide to help you find the best fit. Visit our Agency Directory for the top eCommerce development agencies, as well as:
- Top eCommerce Consultants
- Top UI/UX Design Companies
- Top Website Design Companies
- Top Content Marketing Agencies
- Top eCommerce Companies in Orlando
For creative inspiration, explore our Design Awards, featuring the latest winners in website design.
eCommerce Statistics FAQs
1. What is the average eCommerce conversion rate in 2026?
According to Dynamic Yield’s 2026 benchmark data, the global average eCommerce conversion rate is approximately 2.76%, though performance varies significantly by industry.
2. Why are ecommerce growth statistics important for online brands?
eCommerce growth statistics help brands understand changing consumer behavior, improve customer experiences, identify emerging market trends, and make smarter decisions around marketing, mobile commerce, and retention strategies.
3. Why do shoppers abandon their online carts?
Unexpected fees, complicated checkout flows, limited payment options, and delivery concerns remain some of the leading causes of cart abandonment in ecommerce.
4. How important is mobile commerce in 2026?
According to the latest ecommerce updates and industry data, mobile commerce now drives the majority of online shopping activity, accounting for 59% of global eCommerce sales in 2025.
5. How is AI changing ecommerce?
AI is helping ecommerce brands improve personalization, automate customer support, optimize product recommendations, and streamline inventory and marketing decisions.
6. Why are personalization and loyalty strategies important in ecommerce?
As customer acquisition costs continue rising, ecommerce brands are increasingly using personalized experiences and loyalty programs to improve retention, repeat purchases, and customer lifetime value.
7. Why should agencies track metrics like AOV and CLTV?
These metrics predict growth and justify strategy: boosting average order value (AOV) by 10% can significantly increase revenue margins. Customer lifetime value (CLTV) helps shape loyalty and upsell strategies, with subscriptions and loyalty programs lifting retention rates by over 20%.