Web teams in 2026 simply can’t build the way they used to. Stacks are shifting, and user expectations are brutal.
The smartest teams now use hard data to drive every decision. Here are web development statistics shaping how modern teams plan, build, and ship faster.
Web Development Statistics: Key Findings
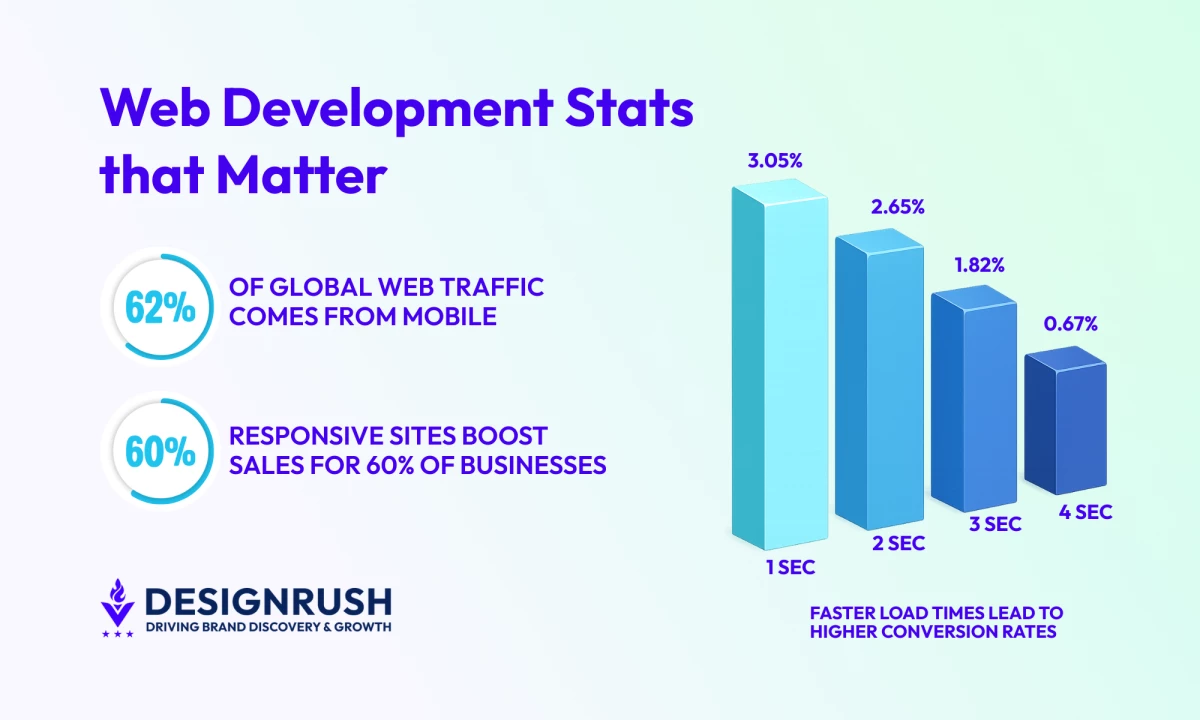
- With over 62% of global traffic coming from mobile and mobile commerce heading toward 63% of total eCommerce, slow or unresponsive mobile builds directly suppress revenue.
- Data shows each second shaved off load time can lift conversions by 2% or more, while delays over four seconds drive abandonment.
- Google’s shift from FID to INP (<200 ms) signals a new standard: sites must respond instantly, not just load quickly.
Why Tracking Web Development Stats Leads to Real Business Outcomes
User expectations are rising, tech stacks are evolving, and performance benchmarks are tighter than they were even a year ago.
Yet many teams still struggle to connect build decisions to real business outcomes.
That’s why up-to-date web development statistics matter: they show where performance drives results, where teams lose ground, and how to build with ROI in mind.
Mobile Dominance Defines the Modern Web
The modern web is massive, mobile-first, and moving fast. The numbers back that up:
- Over 6 billion people use the internet globally.
- Of that, over 62% comes from mobile.
- Mobile commerce is on track to generate $2.5 trillion in revenue by 2025, with its share of total eCommerce expected to climb to 63% by 2029.
In 2026, mobile responsiveness is undoubtedly a direct driver of revenue, retention, and redesign decisions across the web:
- Over 60% of businesses report higher sales after implementing mobile-responsive website designs.
- 73% of web designers say poor mobile responsiveness is one of the leading reasons visitors leave a website.
- More than half of web developers (53.8%) identify the lack of cross-device responsiveness as a primary trigger for website redesigns.
What this means in practice:
- Mobile performance should be at the front and center of your build decisions.
- Your site must load fast, feel responsive, and work smoothly on smaller screens without breaking on desktops.
- Google weighs mobile Core Web Vitals (CWV) more heavily, so poor mobile performance can still hurt your rankings even if desktop is solid.
- Test mobile performance using tools like Lighthouse or other device emulators.
Jeremy Koh, founder of KOPI, emphasized the importance of designing for mobile:
“Adopting a mobile-first approach isn’t just about prioritizing smaller screens; it’s about distilling the user experience to its most essential elements. This clarity often leads to more intuitive navigation and faster load times — both critical to engagement and conversion.”
Front-End Metrics That Expose Good (or Bad) Builds
If mobile defines the modern web, front-end performance metrics reveal whether a site is actually built to succeed.
These signals translate directly into user behavior, rankings, and revenue.
- Speed and bounce rates: The hidden cost of slow load times
- Visual load and responsiveness: Where perceived speed becomes real performance
- Interaction latency: Why fast loads still fail without fast responses
Speed and Bounce Rates: The Hidden Cost of Slow Load Times
Page speed is one of the clearest signals users use to decide whether to stay, engage, or buy.
When a site feels slow, trust erodes instantly, and no amount of content or design quality can compensate for that first impression.
- Faster page speeds consistently correlate with higher conversion rates and revenue.
- When mobile pages load in less than two seconds, conversion rates are roughly 15% higher than the mobile average.
- COOK, a UK meal-kit company, cut average page load time from 4.8 to 3.95 seconds and saw a 7% increase in conversion rate, a 7% drop in bounce rate, and 10% higher engagement.
When performance slips, the penalties are immediate:
- 1 in 4 visitors abandon a site if it takes more than 4 seconds to load.
- Each additional second of load time can decrease conversion rates by 4.42% on average, with the steepest drop occurring in the first five seconds.
- 64% of shoppers who are dissatisfied with a site’s speed say they won’t return.
In practice, speed shapes brand perception, repeat visits, and user confidence at every stage of the funnel.
What this means for your website:
- Aim for 1–3 second load times on mobile, where network conditions and device constraints are least forgiving.
- Defer or delay third-party scripts until core content has rendered and become interactive.
- Treat performance budgets as non-negotiable build requirements, not post-launch optimizations.
Visual Load and Responsiveness: Where Perceived Speed Becomes Real Performance
Visual load speed is one of the strongest signals users use to judge whether a site feels modern, trustworthy, and usable.
If content doesn’t appear quickly and predictably, users assume the experience will be slow or broken and leave before engaging.
- Largest Contentful Paint (LCP) influences up to 25% of your Lighthouse Performance Score.
- Meeting Core Web Vitals make users 24% less likely to abandon the page.
LCP reflects the moment when the main content becomes visible: hero images, headlines, product visuals, or key layout blocks.
If that moment is delayed, no amount of polish later in the experience can recover lost attention.
What this means in practice:
- Keep LCP under 2.5 seconds, especially on mobile networks and mid-range devices.
- Prioritize above-the-fold rendering over decorative animations or secondary UI elements.
- Optimize hero images aggressively (modern formats, responsive sizing, proper compression).
- Improve server response times and reduce render-blocking resources before layering on visual enhancements.
Interaction Latency: Why Fast Loads Still Fail Without Fast Responses
Google now prioritizes Interaction to Next Paint (INP) as the primary responsiveness metric, replacing First Input Delay (FID).
Unlike FID, which measures only the first interaction, INP evaluates responsiveness across the entire user session, making it a far more accurate reflection of real-world usability.
- An INP under 200 milliseconds meets Google’s “good” threshold.
- Sites with low interaction latency feel faster and more reliable, even when visual load times are similar.
- High latency during key actions — navigation, filtering, checkout — correlates strongly with user frustration and abandonment.
Interaction delays are most often caused by heavy JavaScript execution, long main-thread tasks, and third-party scripts blocking input handling.
What this means in practice:
- Break up long JavaScript tasks and minimize main-thread blocking.
- Reduce unused JavaScript and audit third-party scripts aggressively.
- Prioritize responsiveness on high-intent interactions (navigation, search, add-to-cart, checkout) before secondary UI features.
Backend and Framework Adoption: What Today’s Web Apps Are Really Built On
Modern web development is shaped by language demand, abstraction layers, and infrastructure choices that prioritize speed, scalability, and operational efficiency.
- JavaScript and Python are the most in-demand languages among recruiters in 2025.
- Low-code/no-code adoption is surging. According to Gartner, 70% of new applications will be built using low-code or no-code platforms.
Modern web infrastructure continues to move away from monolithic servers toward serverless functions and edge-first architectures that scale automatically and deploy faster.
- 75% of enterprise data will be processed at the edge (Gartner).
- Serverless adoption has surpassed 75% in 2025, with over 70% of AWS customers using Lambda, and Azure and Google Cloud reporting similar usage growth.
What this means in practice:
- Default to serverless architectures, designing around cold starts, execution limits, and concurrency from the start.
- Optimize for execution efficiency, since performance directly impacts cost in usage-based environments.
- Build observability in early with logging, tracing, and monitoring to avoid serverless debugging blind spots.
- Develop fluency with Lambda, Firebase, Cloud Functions, and edge runtimes, and use them for APIs, auth, background jobs, and media workflows.
Developer Tooling and Workflows: What Powers High-Performance Teams
In 2026, developer productivity is shaped by automated workflows, AI-assisted development, and tightly integrated delivery pipelines.
The most effective web teams ship faster not by working harder, but by removing friction across the entire cycle.
The data shows a clear shift toward AI-native tooling, continuous delivery, and observability-first workflows.
AI-Powered Toolchains Are Now the Norm
Modern development tools are designed around automation, collaboration, and intelligent assistance rather than manual workflows.
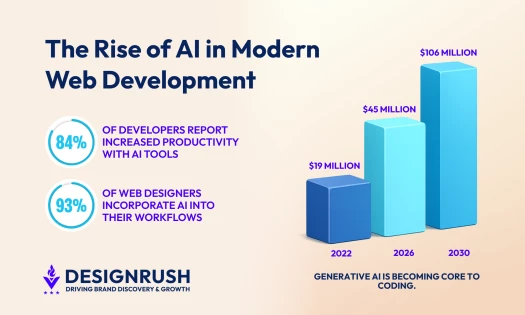
- 90% of engineering teams now incorporate AI into their workflows, up sharply from 61% in 2024, signaling rapid normalization of AI-assisted development.
- 62% of those teams report productivity gains of at least 25%, showing measurable impact.
- 76% of developers are using or plan to use AI tools, with 81% citing increased productivity as the primary reason.
- 74% of developers use Visual Studio Code, making it the dominant IDE across professional workflows.The trends reflect how modern web teams accelerate development timelines while maintaining quality.
What this means in practice:
- Treat AI assistance as a baseline capability.
- Integrate AI directly into editors, code review, and debugging.
- Standardize extensible IDEs like VS Code to support automation and collaboration at scale.
CI/CD Is the Delivery Baseline
If you’re building modern web applications, continuous integration and deployment are the new norm.
- 83% of developers are now involved in DevOps-related activities, much of it centered on CI/CD (continuous integration and continuous delivery/deployment) pipelines.
- Teams using CI/CD tools outperform others across all four DORA metrics, including deployment frequency and lead time for changes.
- Elite teams deploy multiple times per day and ship changes in under 24 hours, while low performers deploy weekly or less with lead times exceeding a month.
CI/CD has become the backbone of reliable web delivery, enabling faster iteration without sacrificing stability.
What this means in practice:
- Design workflows assuming frequent, automated deployments.
- Use CI/CD to enforce testing, performance budgets, and security checks automatically.
- Combine managed and self-hosted pipelines to balance speed, control, and cost.
Observability and Debugging Are Built In, Not Bolted On
In 2026, testing, monitoring, and error resolution are embedded directly into development environments and CI/CD pipelines, giving teams faster feedback and fewer surprises in production.
- Elite teams recover in under an hour, compared to months for low performers. (Google DevOps)
- 79% of organizations with centralized observability report saving time or money, and 70% now use four or more observability tools.
- Single conversational queries produce an actionable bug fix 67% of the time, rising to 85% with two queries in Python programs.
For web teams managing distributed, serverless, and edge-based systems, observability is no longer optional.
Centralized logs, metrics, and traces reduce downtime, shorten debug cycles, and prevent issues from reaching users.
What this means in practice:
- Embed monitoring and error tracking directly into development and CI/CD pipelines.
- Centralize logs, metrics, and traces to maintain visibility across distributed stacks.
- Use AI-assisted debugging to accelerate root-cause analysis and reduce mean time to recovery.
Web Development Statistics: Final Thoughts
The data points to what works: faster load times, tighter workflows, better observability, and smarter stack choices.
Use these metrics to evaluate how your team builds, where the gaps are, and what needs to change.
![]()
Our team ranks agencies worldwide to help you find a qualified partner. Visit our Agency Directory for the best web development agencies, as well as:
- Web Design Companies
- eCommerce Development Agencies
- WordPress Web Design Agencies
- UI/UX Design Agencies
Our design experts also recognize the most innovative design projects across the globe. Visit our Awards section for the best & latest in website design.
Web Development Statistics FAQs
1. What are the most important performance metrics to track post-launch?
Core Web Vitals (LCP, INP, CLS) should still be your baseline. But also track real-world load times by geography, time to interactive, error rates, and bounce rates on key templates.
Layer in business metrics like conversion rate, form drop-off, and cart abandonment to tie performance to revenue.
2. How often should we reevaluate our tech stack?
Annually is a good rhythm, especially after major framework releases or when developer hiring trends shift.
Also, re-evaluate whenever scalability, maintenance, or performance becomes harder than it should be. Stack inertia kills momentum over time.
3. How can we balance speed and stability in continuous delivery?
Automated testing, staging parity, feature flags, and tight observability are key. CI/CD isn't about reckless shipping — it's about safe, repeatable releases. Mature teams ship quickly because their guardrails are tight, not despite them.


-preview-webp.webp)