Demographic Infographics: Key Points
- Companies that effectively apply data visualization see a 44% lift in engagement metrics. However, fewer than half of marketers know how to fully leverage this potential, creating a competitive advantage for agencies that do.
Research confirms that businesses using infographics grow traffic 12% faster, while the brain processes visuals 60,000x faster than text, making them essential tools for high-stakes presentations, stakeholder alignment, and campaign clarity.
With 62.6% of Google searches being image-based, optimizing infographic design and alt metadata gives agencies a strong SEO edge, especially when repurposed into carousels, reports, and social content.
In a digital economy that runs on segmentation, audience data means nothing unless it can be seen, shared, and sold. Demographic infographics help turn numbers into narratives, whether you're pitching a CMO, mapping user personas, or explaining donor trends to a nonprofit board.
For agencies, these visuals have gone far beyond the decorative. They’re strategic assets that close deals, improve client retention, and unlock monetization opportunities beyond traditional design deliverables.
In a time pinch? Catch the key takeaways on the go.
What makes a demographic infographic stick? We explore the creative moves that turn raw stats into brand assets — used to pitch, persuade, and shift behavior.
Stream the quick-hit summary on Spotify.
20 Demographic Infographic Examples That Convert Data Into Action
Not all demographic infographics are created equal. The most effective ones align visuals to business outcomes: from defining customer personas to securing stakeholder buy-in.
.gif)
Below, we’ve categorized high-performing examples based on practical agency use cases.
Each entry includes:
- Overview: What the infographic visualizes
- Strategic Function: What it helps solve or enable
- Best for: Use cases where the format adds the most value
- Agency Play: How agencies can package, upsell, or productize the format
1. Audience Intelligence & Targeting
- Offer To: Clients who are launching new campaigns, refreshing personas, or expanding into new segments.
- Pain Point Addressed: The need to align internal teams, sharpen audience messaging, or build clarity around who they’re targeting.
Millennials: State of Behavior & Trends
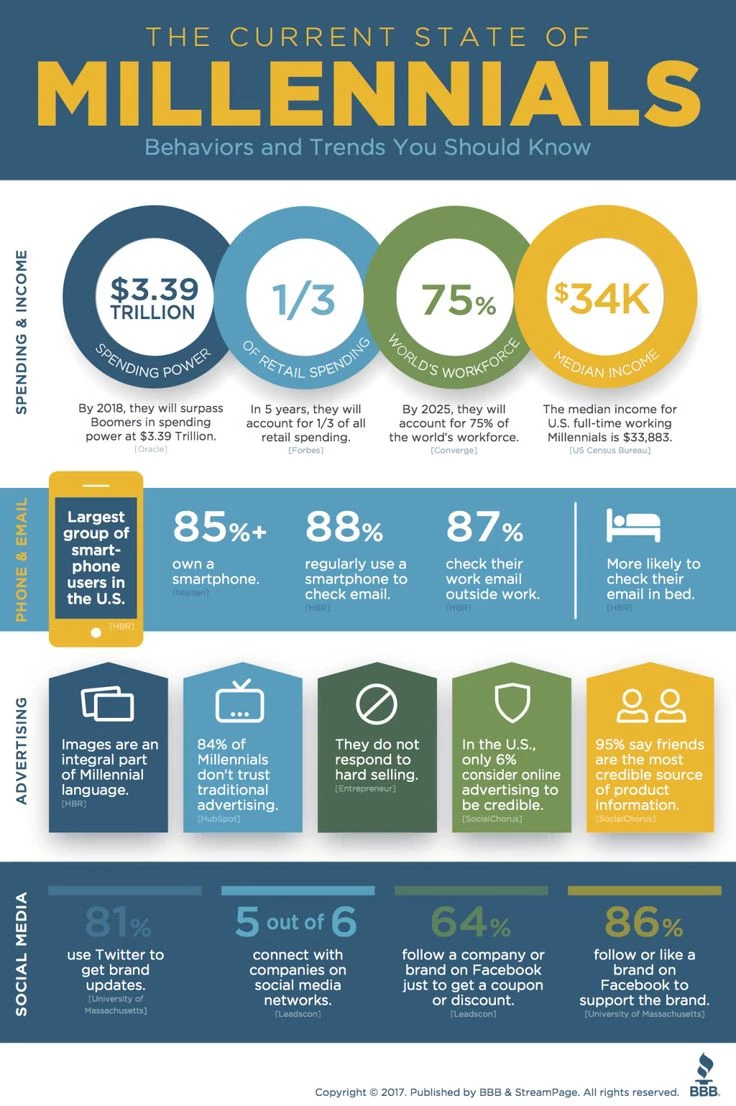
- Overview: This infographic outlines Millennial consumer habits across digital platforms, purchasing triggers, and media behaviors.
- Strategic Function: It helps brands decode generational trends to inform targeting, messaging, and media mix.
- Best for: DTC brands, social media teams, and campaign strategists seeking to resonate with a specific generational set.
- Agency Play: Package it as part of persona frameworks, social media targeting decks, or content direction blueprints.
Gen Now vs. Gen Next (American Express)
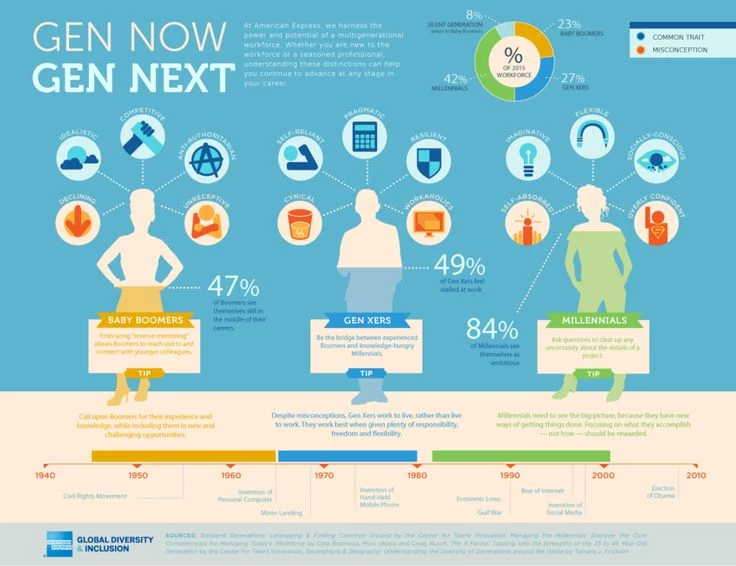
- Overview: A comparative infographic showcasing workplace values and mindset differences across generations.
- Strategic Function: Supports internal comms, leadership messaging, and employer brand strategy with visualized culture data.
- Best for: Brands undergoing generational workforce shifts or HR departments investing in talent retention.
- Agency Play: Use in EVP (Employer Value Proposition) audits, employer brand updates, or DEI (Diversity, Equity, and Inclusion) alignment workshops.
In practice, EVP audits, employer brand updates, and EVP alignment workshops all leverage infographics like Gen Now vs. Gen Next to visualize how your EVP culture resonates across different employee segments, making intangible benefits tangible and emotionally clear.
Customer Psychographic (MailChimp)

- Overview: Stylized photographic personas showcasing behavioral traits through expressive, handwritten labels to reflect user mindset.
- Strategic Function: Helps teams internalize audience psychographics by anchoring emotional triggers and expectations to real faces and roles.
- Best for: Marketing team alignment, tone-of-voice workshops, onboarding decks, or brand archetype development.
- Agency Play: Use as a launch point for creative briefs or messaging strategy, especially in B2B or SaaS where internal clarity around user type is critical. Productize as part of messaging frameworks or visual storytelling kits for internal team rollout.
Buyer Persona Demographic Cards (Shopify)
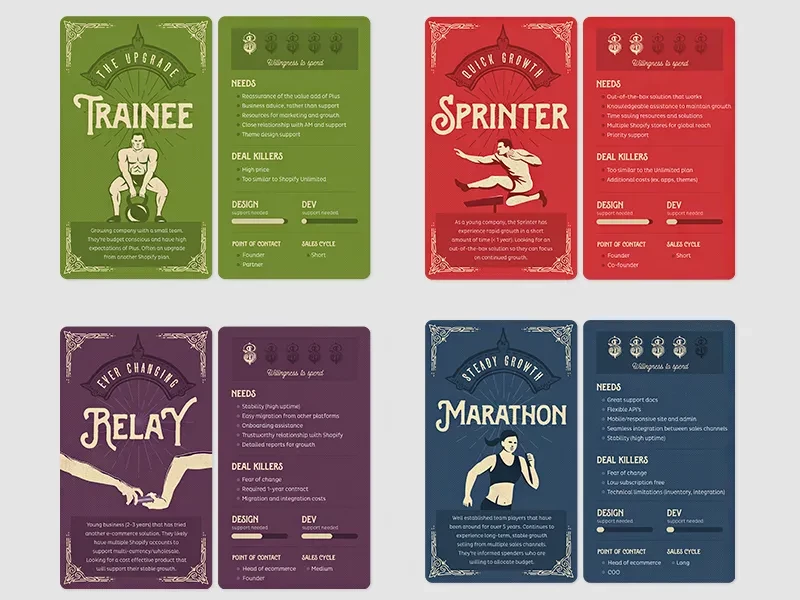
- Overview: Card-based, gamified user segments highlighting product needs, deal breakers, and points of contact in the buyer journey.
- Strategic Function: Converts abstract buyer types into actionable sales enablement assets, mapping needs to customer experience touchpoints.
- Best for: SaaS onboarding sequences, eCommerce sales decks, or cross-functional UX + product handoff documents.
- Agency Play: Offer this format when productizing discovery findings or as a toolkit extension for CRM personalization. Package as an upgrade in funnel strategy workshops or B2B/B2C sales experience mapping sessions.
Facebook Global Demographics
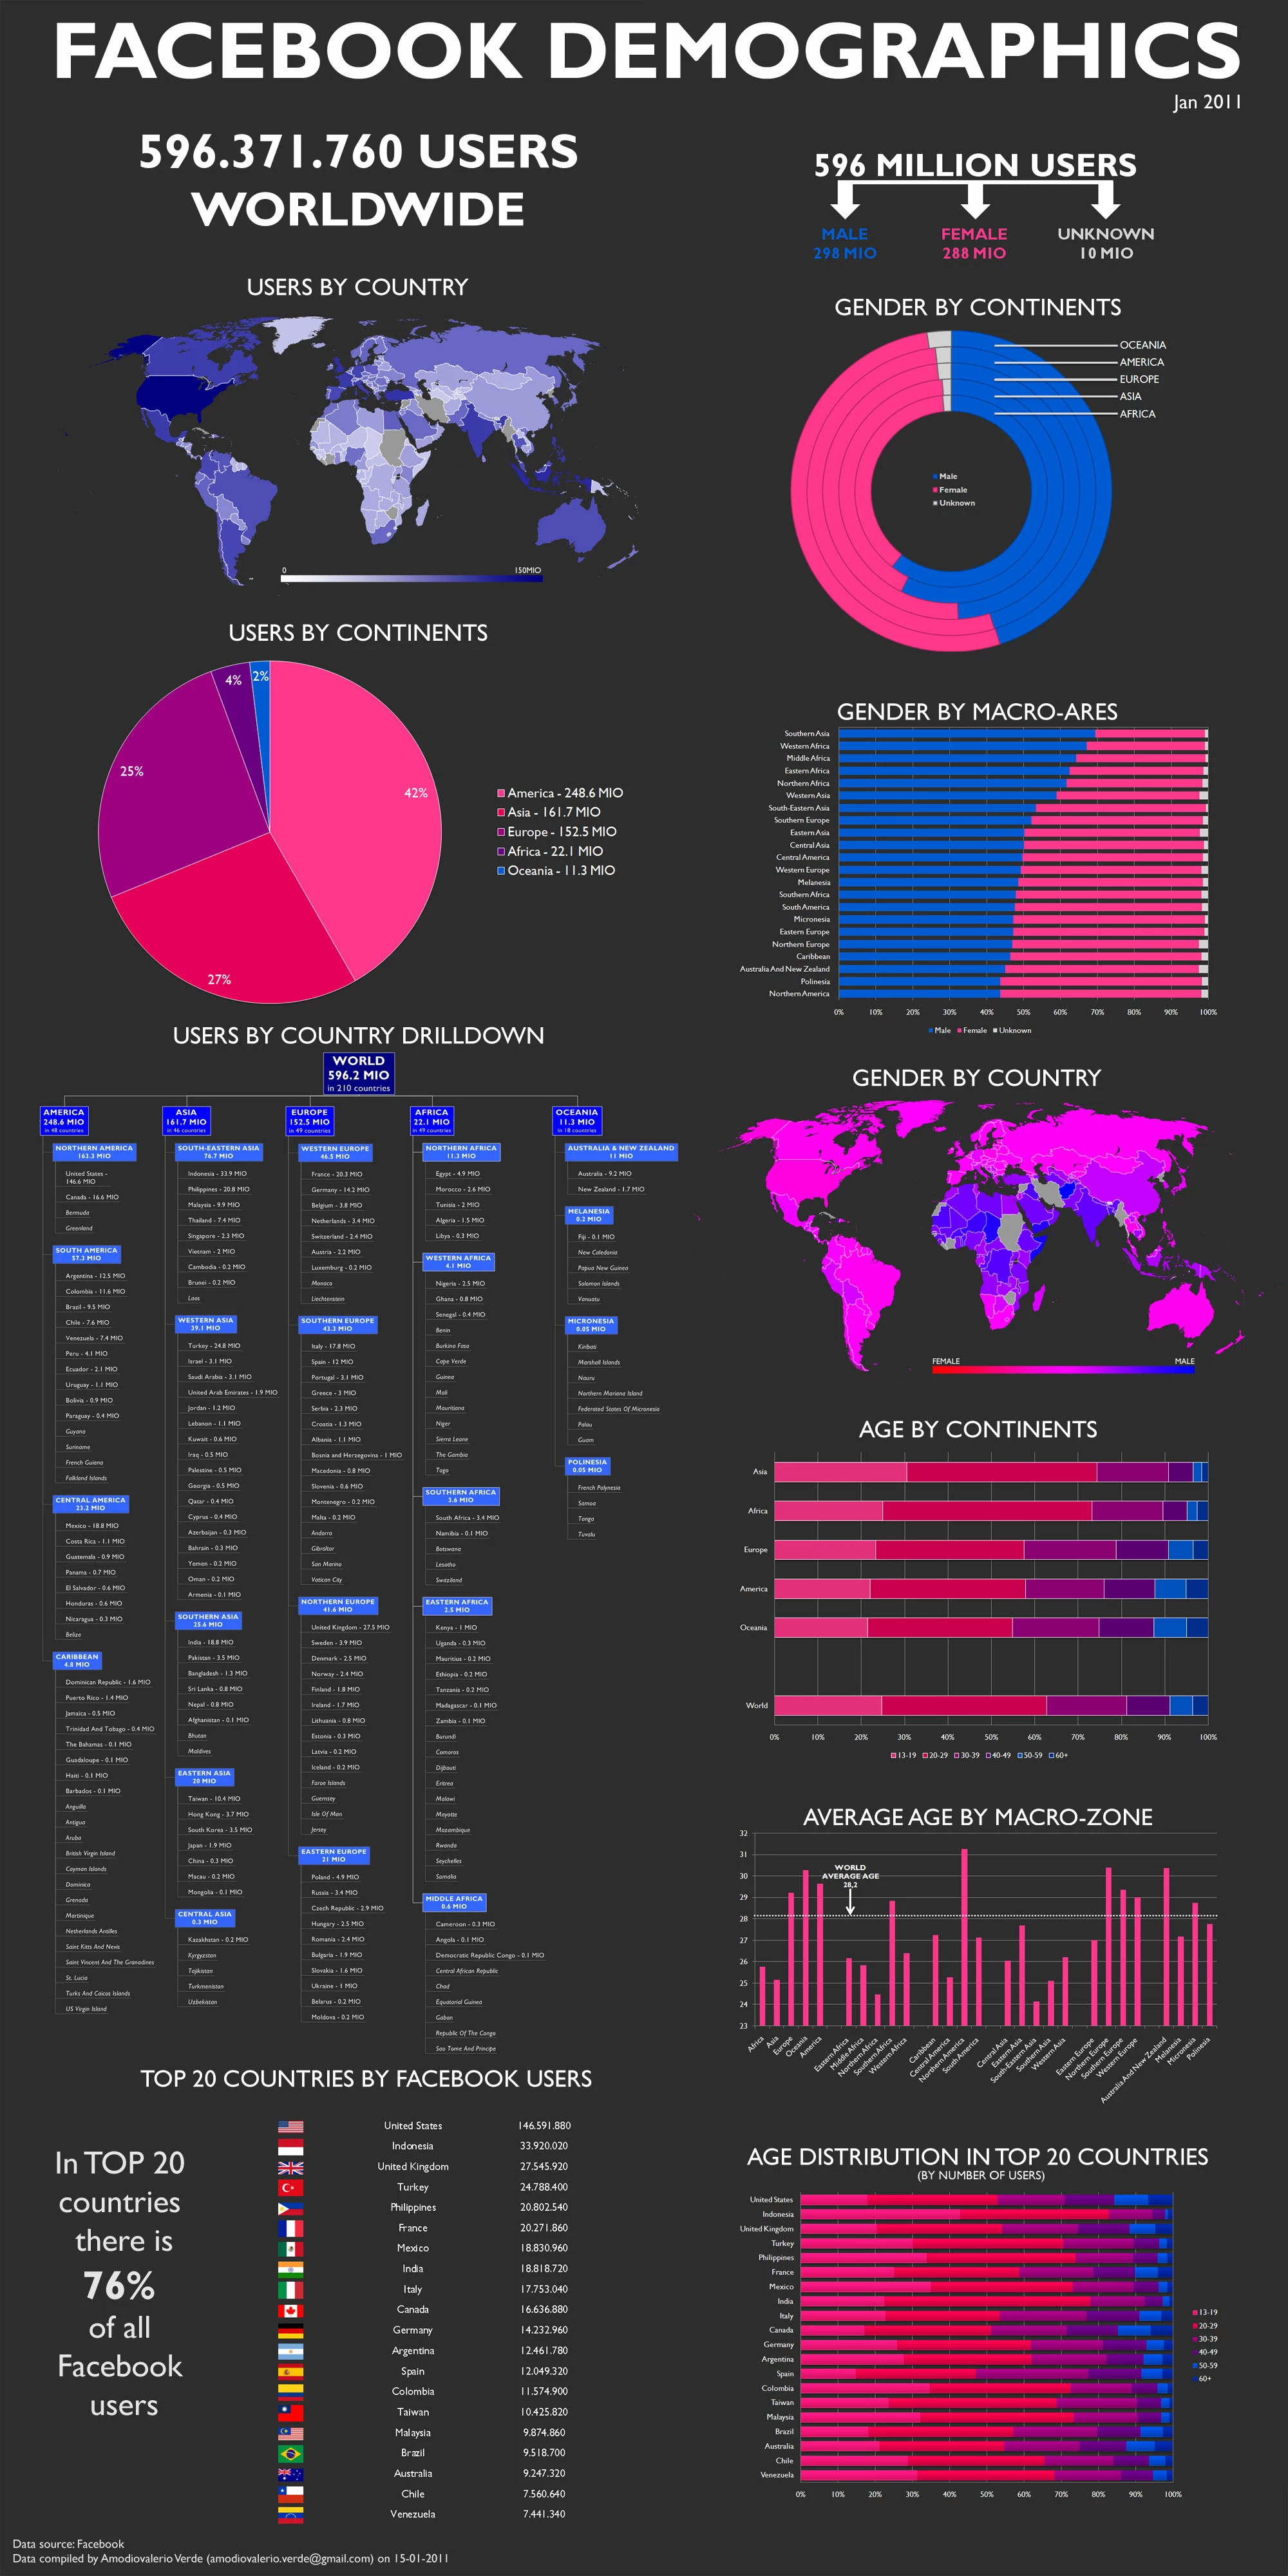
- Overview: Breaks down the global Facebook user base by age, gender, and geography for targeting strategy.
- Strategic Function: Useful for media teams planning cross-border campaigns or optimizing budget splits by region.
- Best for: Global campaign strategists, localization leads, or ad ops teams.
- Agency Play: Bundle with global media plans, paid social playbooks, or channel-specific budget forecasts.
Shocking Demographics of Cell Phone Use
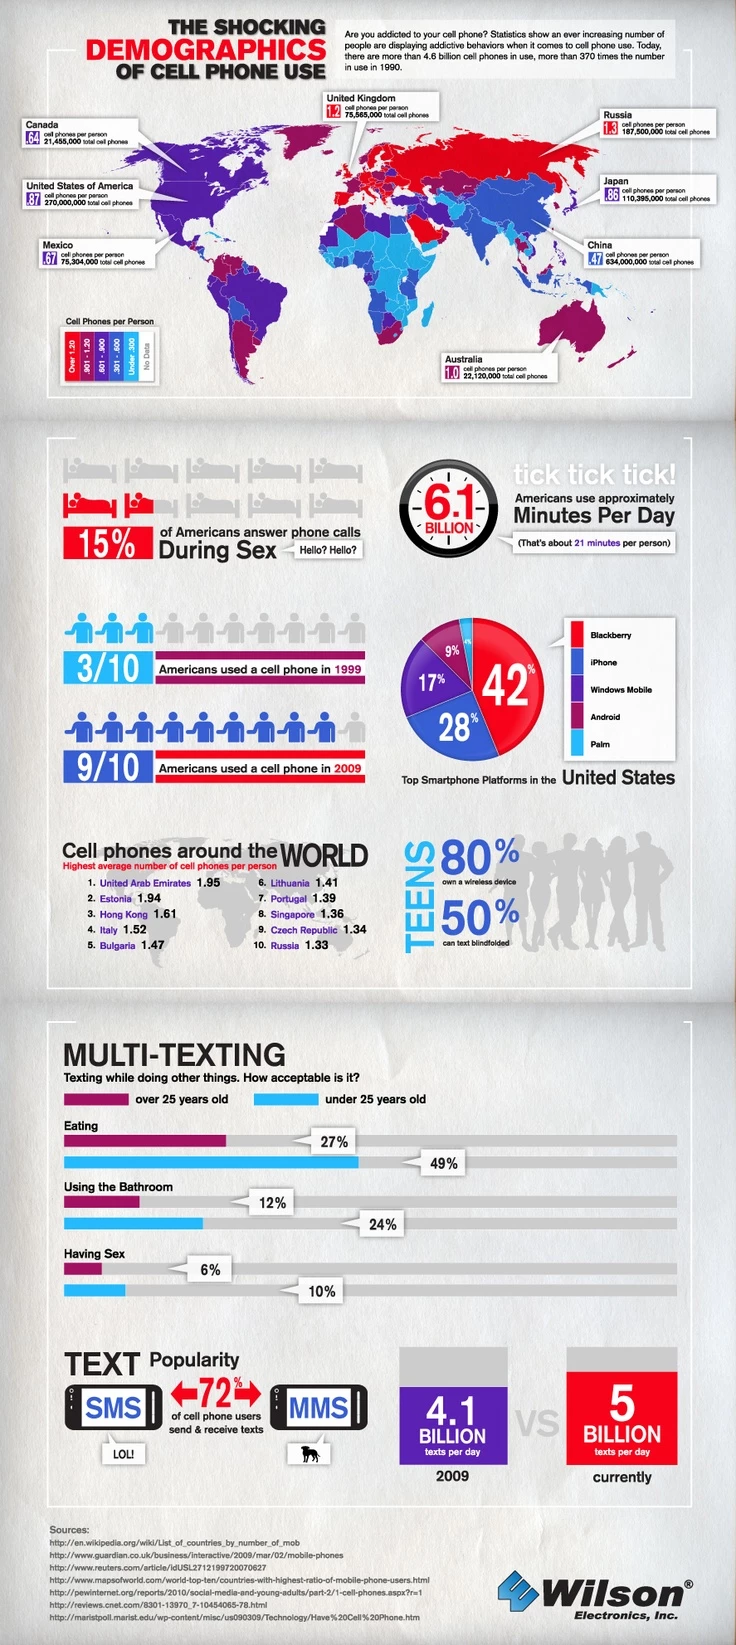
- Overview: A behavior-rich infographic highlighting global trends in mobile use, multitasking, and platform loyalty.
- Strategic Function: Helps UX teams and campaign strategists anticipate mobile behavior by region and audience type.
- Best for: App designers, mobile-first marketers, or product teams exploring user friction.
- Agency Play: Integrate into mobile UX audits, onboarding strategy packages, or app launch plans.
2. Behavioral Trends & Customer Experience
- Offer To: Clients who are trying to reduce churn, optimize journeys, or improve retention.
- Pain Point Addressed: Prospects who need to visualize gaps in satisfaction, align CX strategy, or build trust through data.
Customer Satisfaction Statistics
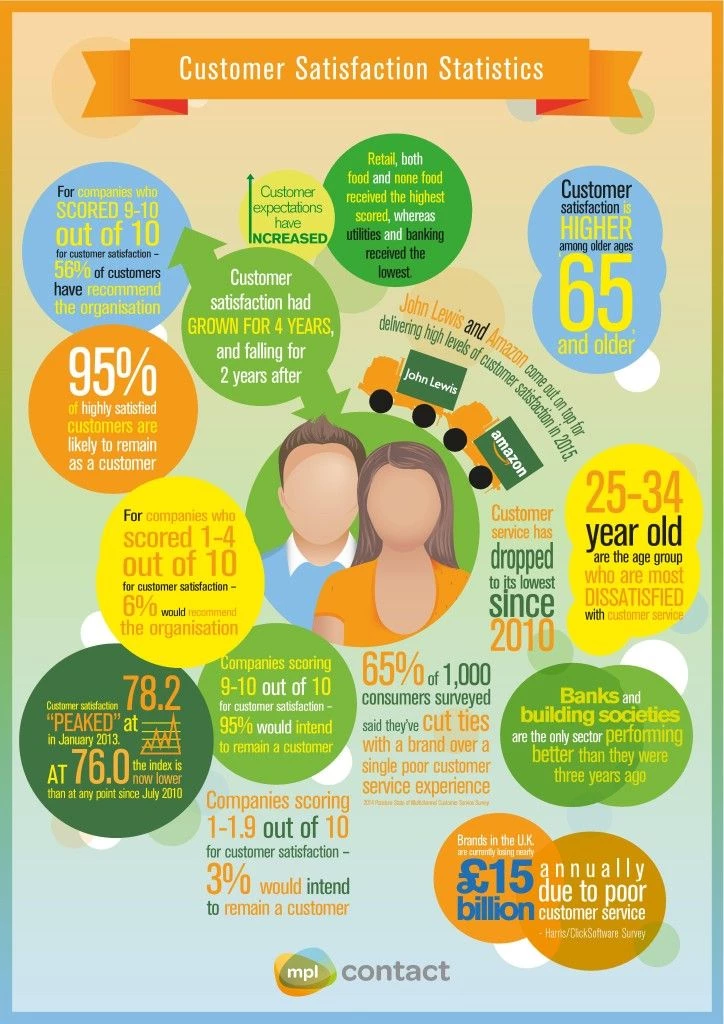
- Overview: Visualizes customer sentiment and loyalty patterns based on age group, purchase cycle, and retention tier.
- Strategic Function: Helps CX teams identify who stays, who churns, and where to prioritize investment.
- Best for:Retention strategy sessions, product feedback loops, and post-launch analysis.
- Agency Play: Use in quarterly performance reports, loyalty strategy proposals, or churn mitigation pitches.
Productize as part of a retention analytics report, bundled into customer experience audit services, or offered as a premium insight add-on in CRM optimization packages.
SaleCycle Client Satisfaction Survey
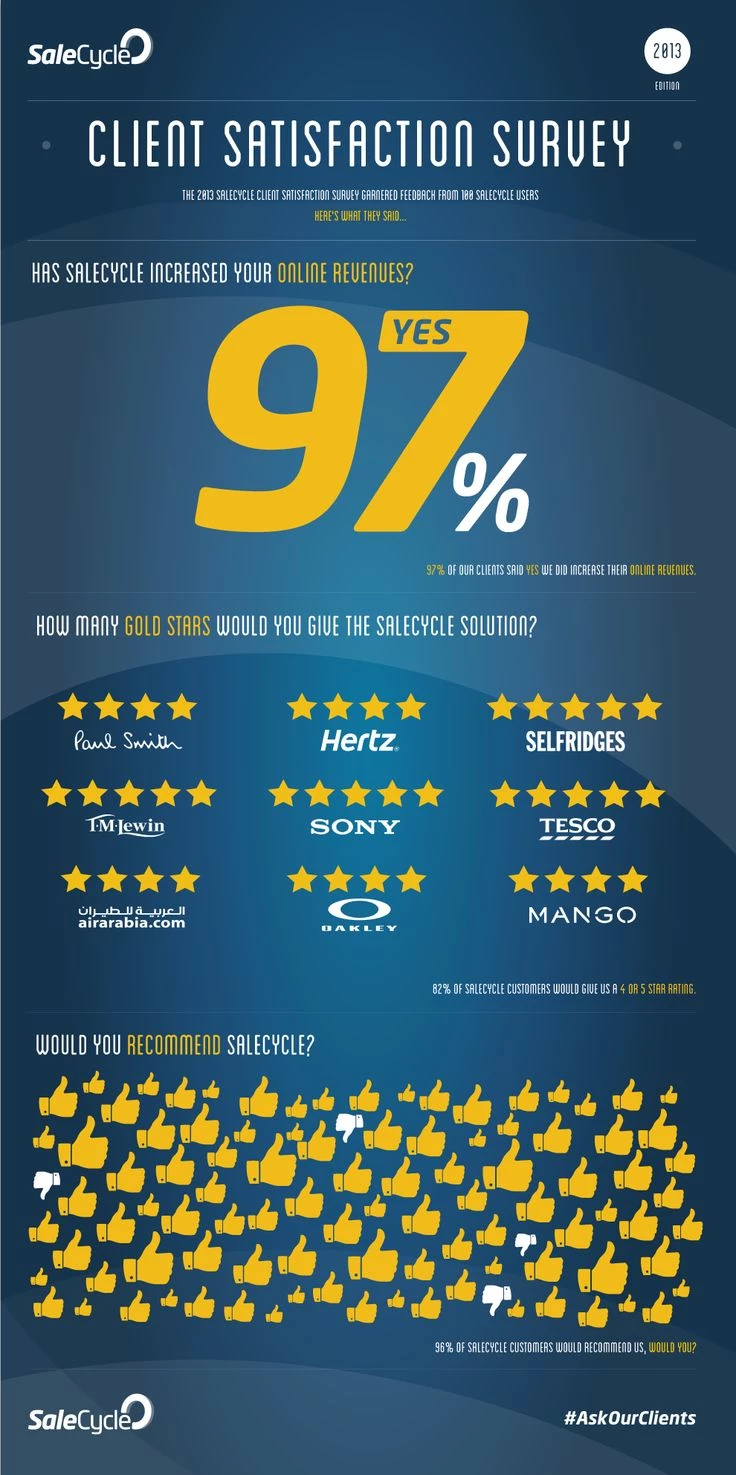
SaleCycle
- Overview: A stat-driven NPS-style infographic showcasing client trust, retention, and referral intent.
- Strategic Function: Offers social proof and credibility for sales teams and client success groups.
- Best for: QBRs, inbound sales decks, or case study storytelling.
- Agency Play: Include in renewal proposals, trust-building marketing kits, or reputation management collateral.
Package this as part of a sales enablement toolkit or offer it as a data visualization module within testimonial and review campaigns.
Bad Service Blues (Accenture)
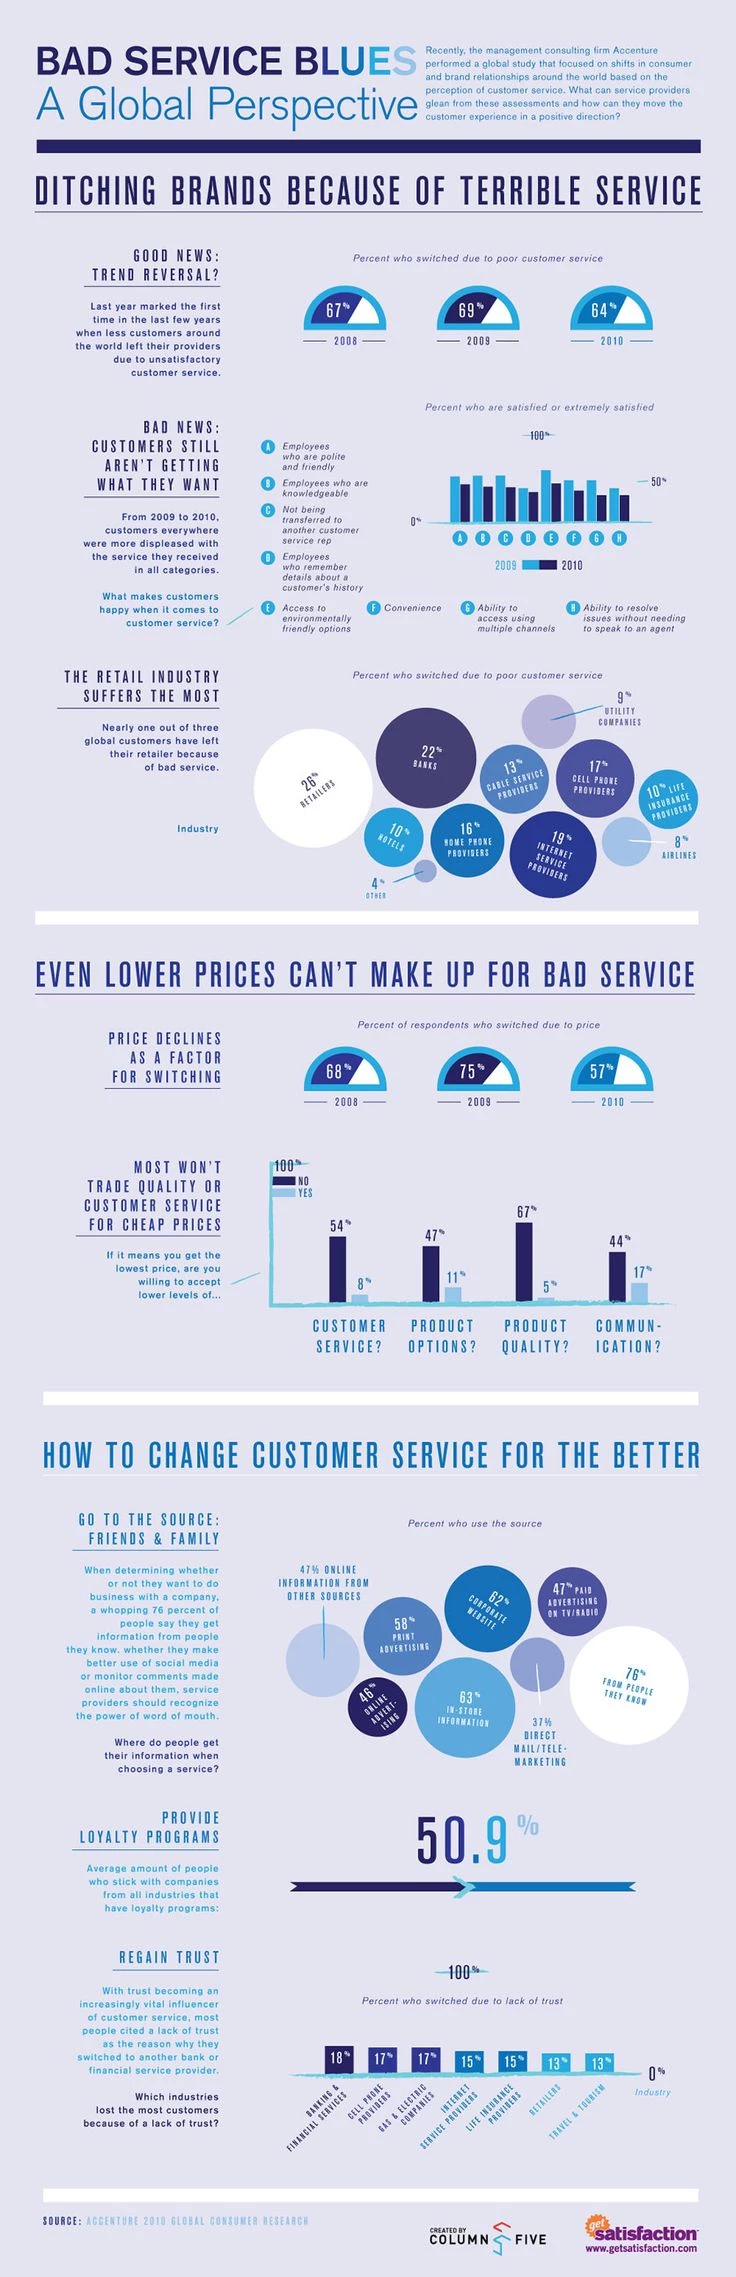
- Overview: Maps the psychological and operational reasons customers leave brands, including data by industry.
- Strategic Function: Supports redesign of touchpoints and loyalty initiatives based on emotional friction.
- Best for: Service blueprinting, CX transformation, or training and onboarding.
- Agency Play: Use as a framework to upsell customer retention strategy or loyalty program design.
Offer as a diagnostic infographic in customer audit packages or embed in onboarding decks for long-term service retainer clients.
Millennials vs Gen Z – Social Media Use
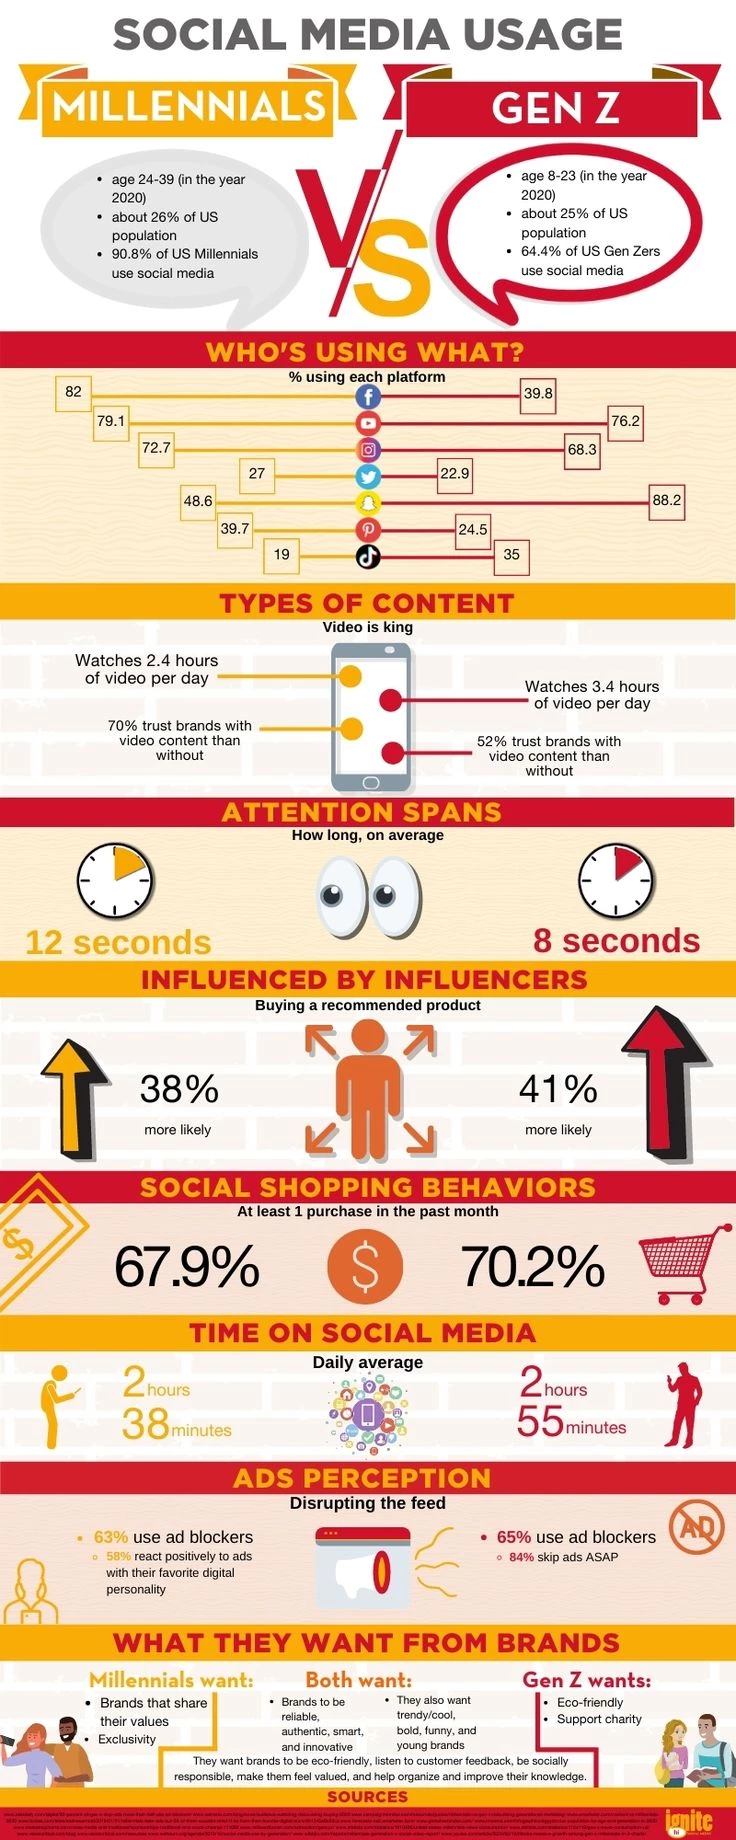
- Overview: A side-by-side behavioral profile of platform preferences, media trust, and digital habits.
- Strategic Function: Helps campaign strategists map channel mix and content format by generation.
- Best for: Social media agencies, creative teams, or performance marketers.
- Agency Play: Use in media buying strategies, content calendars, or youth audience playbooks.
Repurpose the comparative format for A/B audience profiling deliverables and offer clients dual-view infographics that contrast markets, age groups, or behavioral segments to guide budget allocation and creative direction.
3. Demographic Shifts & Market Forecasting
- Offer To: Prospects who are expanding markets, launching future-focused messaging, or adapting to global shifts.
- Pain Point Addressed: Businesses that need to visualize external market forces or plan long-term brand strategy.
When stats matter, design them to speak volumes.
Demographic Shifts: The World in 2030
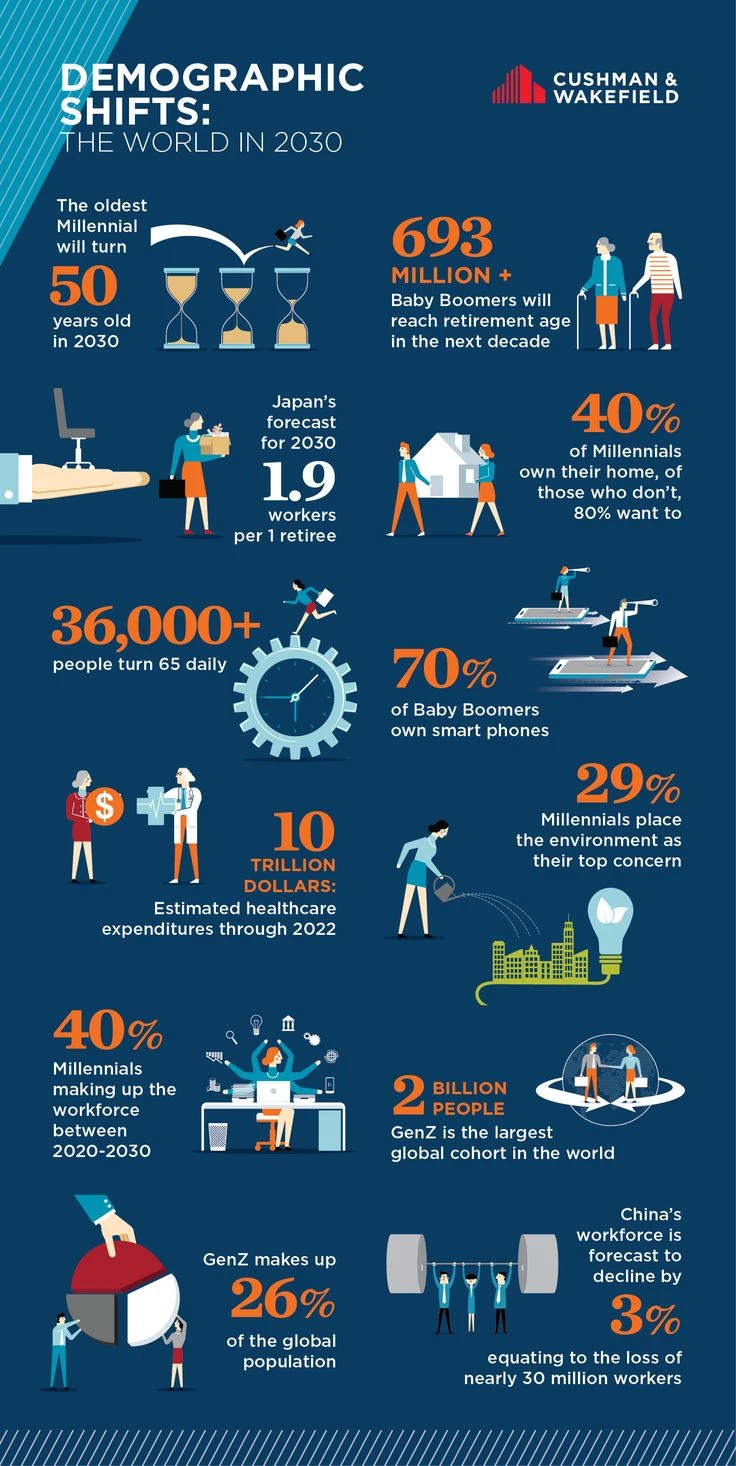
- Overview: A high-level projection of aging trends, workforce shifts, and environmental perspectives by global region.
- Strategic Function: Informs future planning, policy messaging, and long-term brand evolution.
- Best for: Corporate foresight teams, ESG storytelling, or macro-strategy decks.
- Agency Play: Use to open keynote decks, anchor thought leadership, or forecast creative direction.
Package as a branded foresight asset or sell as part of a future trends report service. Ideal for agencies offering strategic consulting, ESG communication, or executive presentation support to enterprise clients.
National Demographic Fact Sheet Snapshot
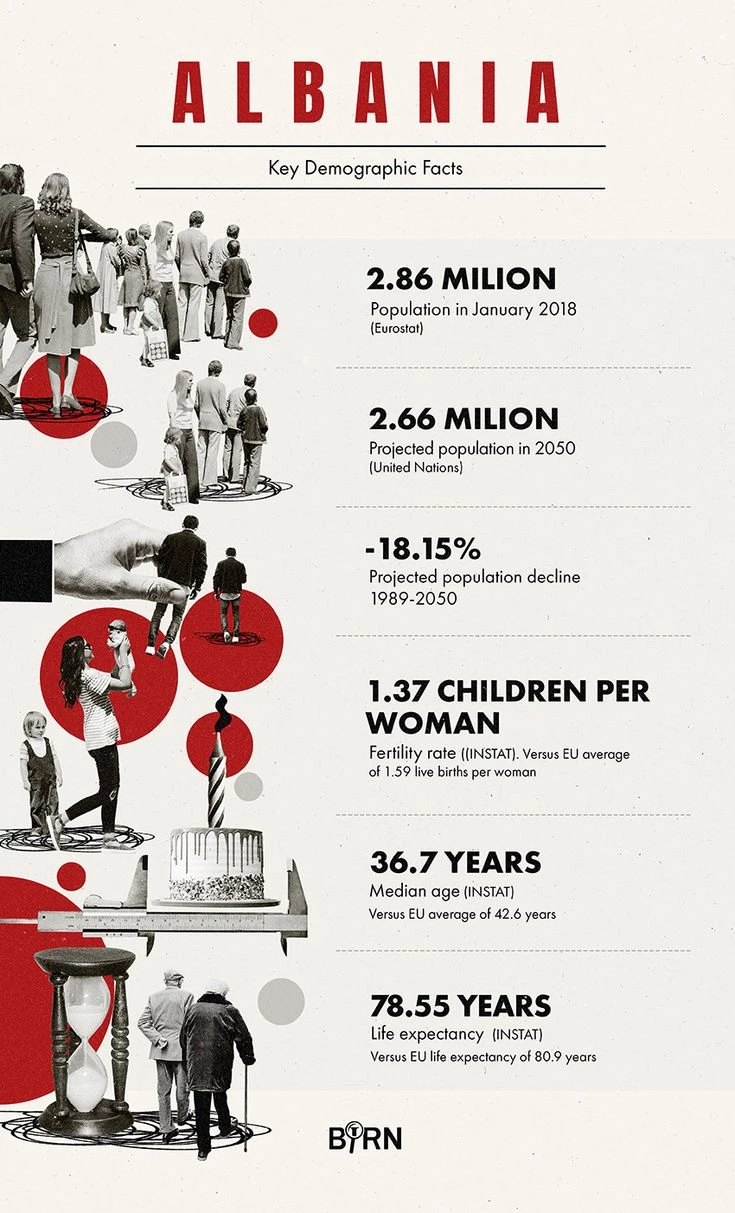
- Overview: A stark, minimalistic infographic that visualizes a country's population decline, fertility rate, median age, and life expectancy trends in comparison to EU averages.
- Strategic Function: Helps contextualize demographic pressure points that may influence economic, labor, and healthcare planning.
- Best for: Policy think pieces, regional development proposals, or international investment outlooks.
- Agency Play: Offer as part of geo-targeted audience research or as support material for market entry planning.
Integrate into whitepapers or demographic insight reports for NGOs, government bids, or institutional consulting clients.
Population & Migration Flows
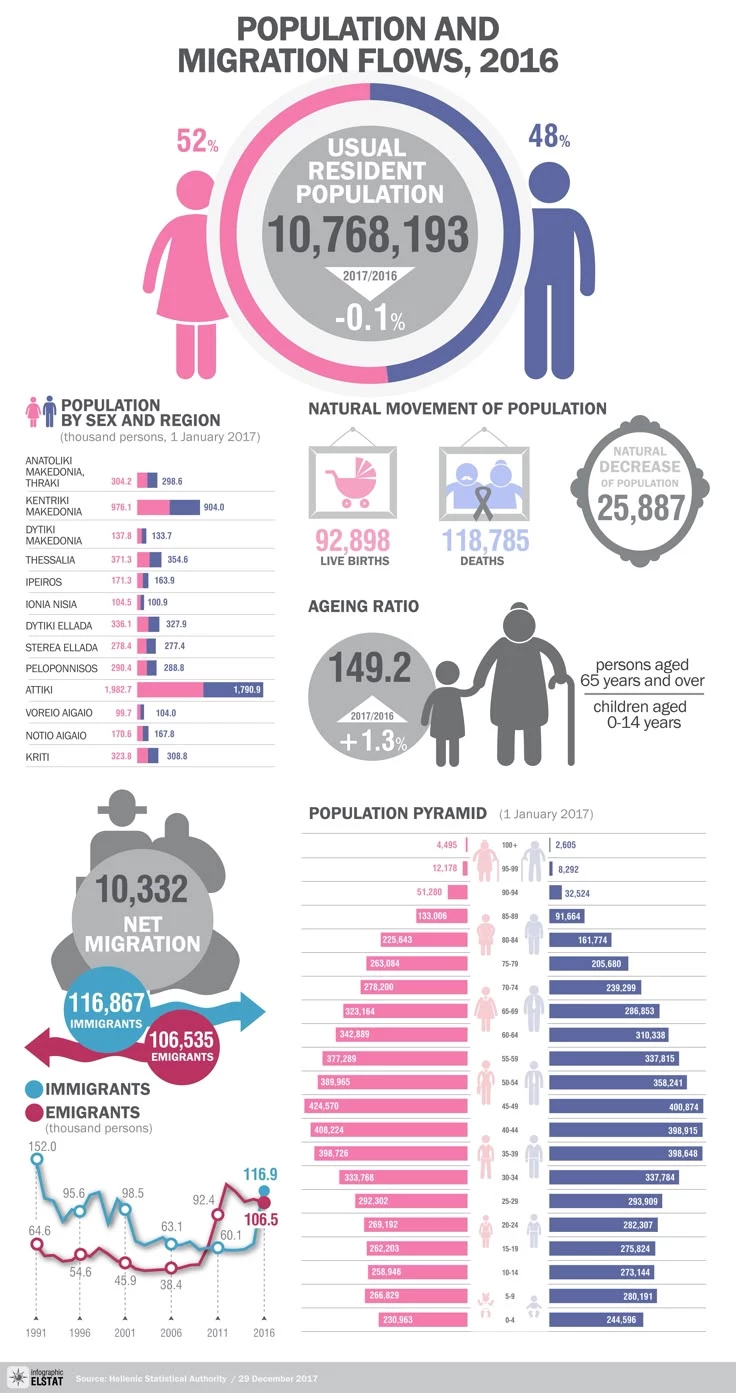
- Overview: An expansive infographic detailing gender breakdowns, natural population changes, migration trends, and aging population ratios.
- Strategic Function: Enables audience segmentation and long-term planning in response to shifting workforce and migration patterns.
- Best for: Public sector tenders, nonprofit demographic outreach, or EU-funded projects.
- Agency Play: Embed in pitch decks or visual reports for international agencies working in education, labor mobility, or social services.
Sell as a custom demographic insights package for regional media campaigns, civic awareness drives, or local economic development plans.
Regional Market Demographics Overview
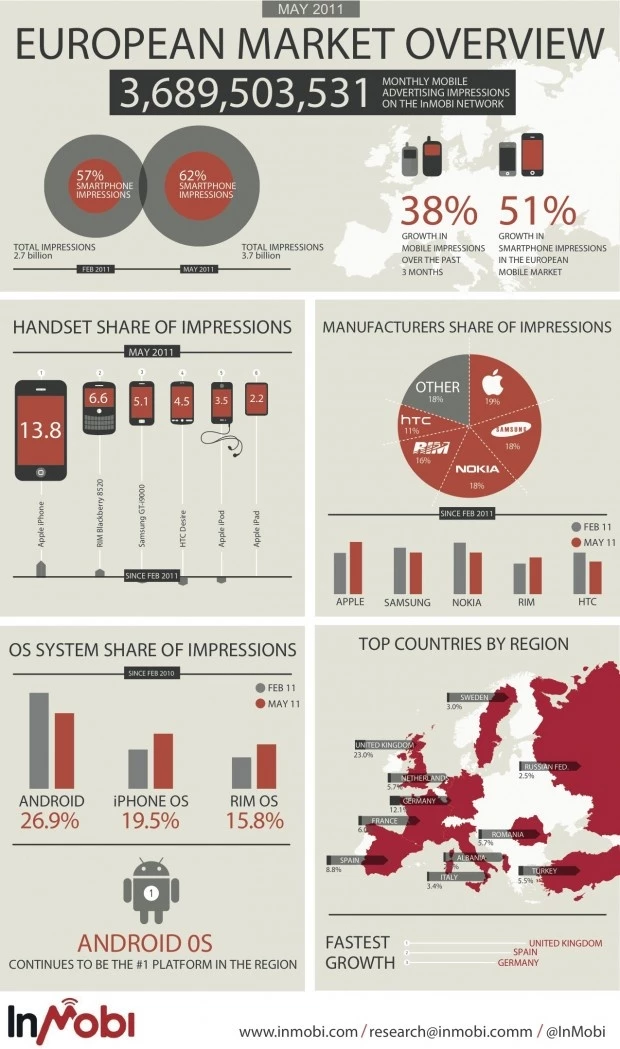
- Overview: A 2011 data-rich snapshot of mobile ad impressions across Europe, segmented by handset, OS, manufacturer, and country.
- Strategic Function: Helps identify regional user behavior, device penetration, and ad market maturity to guide media buying and ad format optimization.
- Best for: Cross-market ad strategies, platform prioritization, and regional expansion campaigns.
- Agency Play: Offer as a foundational dataset for European GTM (go-to-market) briefs, paid media proposals, or client onboarding in telecom and app sectors.
Turn into a plug-and-play market insights module for clients targeting regional audiences. Upsell as part of international market feasibility studies or localized persona development packages.
The People, Politics & Culture
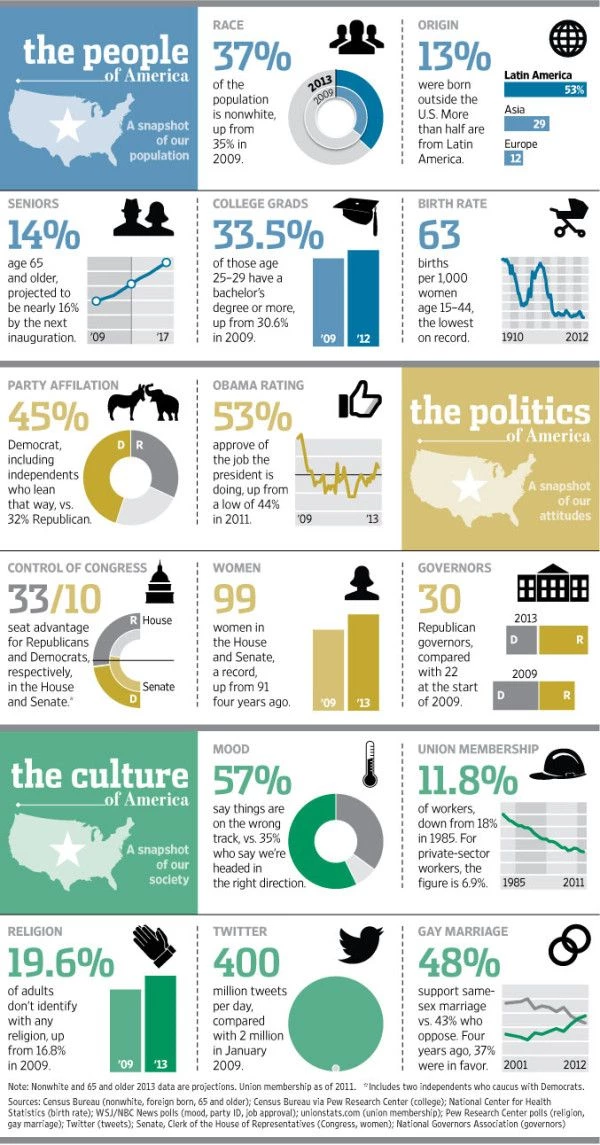
- Overview: Breaks down American values and beliefs across race, religion, education, and party lines in a modular visual layout.
- Strategic Function: Equips brands to communicate with cultural sensitivity and relevance by understanding how social, political, and cultural identities shape behavior.
- Best for: Advocacy campaigns, non-profit funding proposals, public policy messaging, region-specific storytelling, or civic engagement planning.
- Agency Play: Use in donor-facing strategy decks, grassroots mobilization assets, or as part of nonprofit pitch decks, or mission-driven social content strategies.
Utilize this as a foundation for social issue positioning, CSR narrative development, or state-by-state voter or donor outreach mapping.
Voter Behavior & Demographic Turnout Infographic
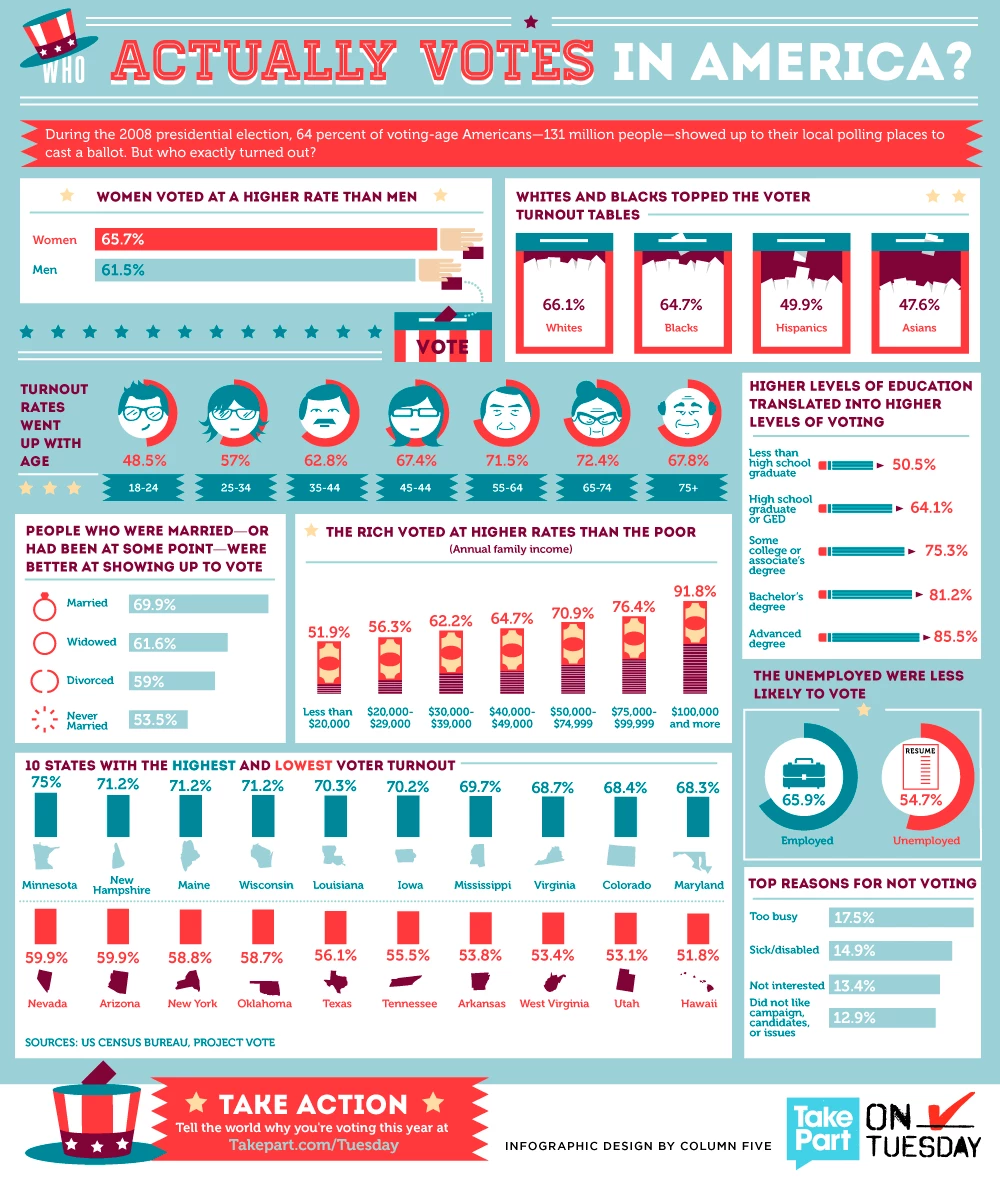
- Overview: This infographic breaks down voter turnout across key demographic indicators—age, income, education, and employment—using election data as a behavioral benchmark.
- Strategic Function: Equips political strategists and public affairs teams with granular insights on voter motivation and turnout likelihood, informing message calibration and regional media targeting.
- Best for: Government communications, lobbying groups, PR or campaign strategy firms, or political data vendors.
- Agency Play: Offer as part of an audience intelligence toolkit for electoral targeting or legislative influence campaigns. Use to validate messaging strategy in pre-rollout pitch decks for public-sector clients.
Convert into a recurring deliverable for government affairs retainers or election cycle insight reports. Ideal for upselling campaign strategy workshops, voter psychographic profiling, or targeted ad campaign planning.
4. Market Positioning & Sales Enablement
- Offer To: Clients who are raising capital, building sales narratives, or differentiating against competitors.
- Pain Point Addressed: The need to show market traction, category leadership, or ESG (Environmental, Social, and Governance) credibility.
See how top brands turn complex data into converting, compelling visuals.
Enterprise Adoption Overview
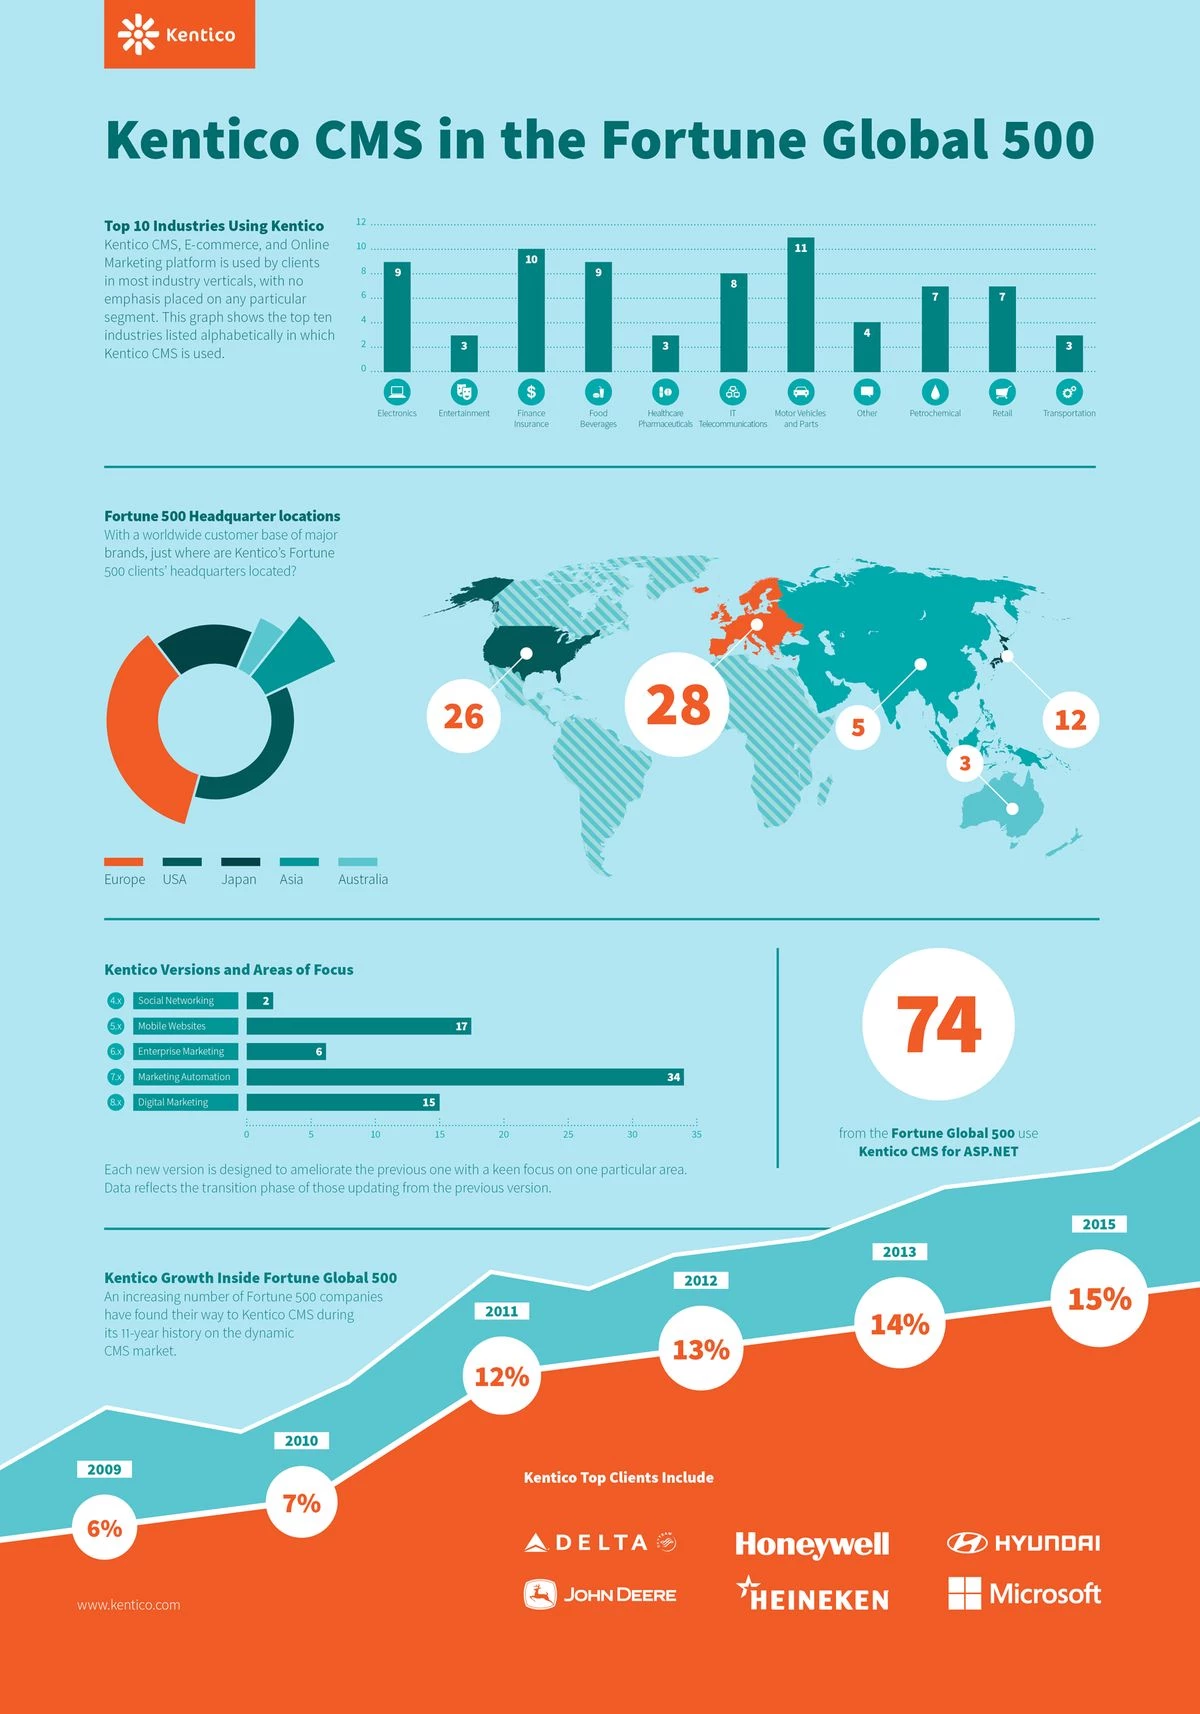
- Overview: This infographic breaks down the adoption of Kentico CMS among Fortune Global 500 companies by industry, geography, and product feature sets. It also maps growth over time and highlights client concentration.
- Strategic Function: Equips agencies with a visual proof point to demonstrate enterprise software traction and tech adoption trends by region and use case.
- Best for: B2B SaaS pitch decks, product marketing collateral, and enterprise sales enablement assets.
- Agency Play: Leverage as a template for mapping client or partner success stories in tech verticals. Can also be used in case study visuals, sales leave-behinds, or VC update reports.
Sell as a branded adoption map or CMS impact tracker for B2B clients. Upsell in GTM strategy packages, SaaS explainer campaigns, or Fortune 500 growth showcases.
Travel Infographic
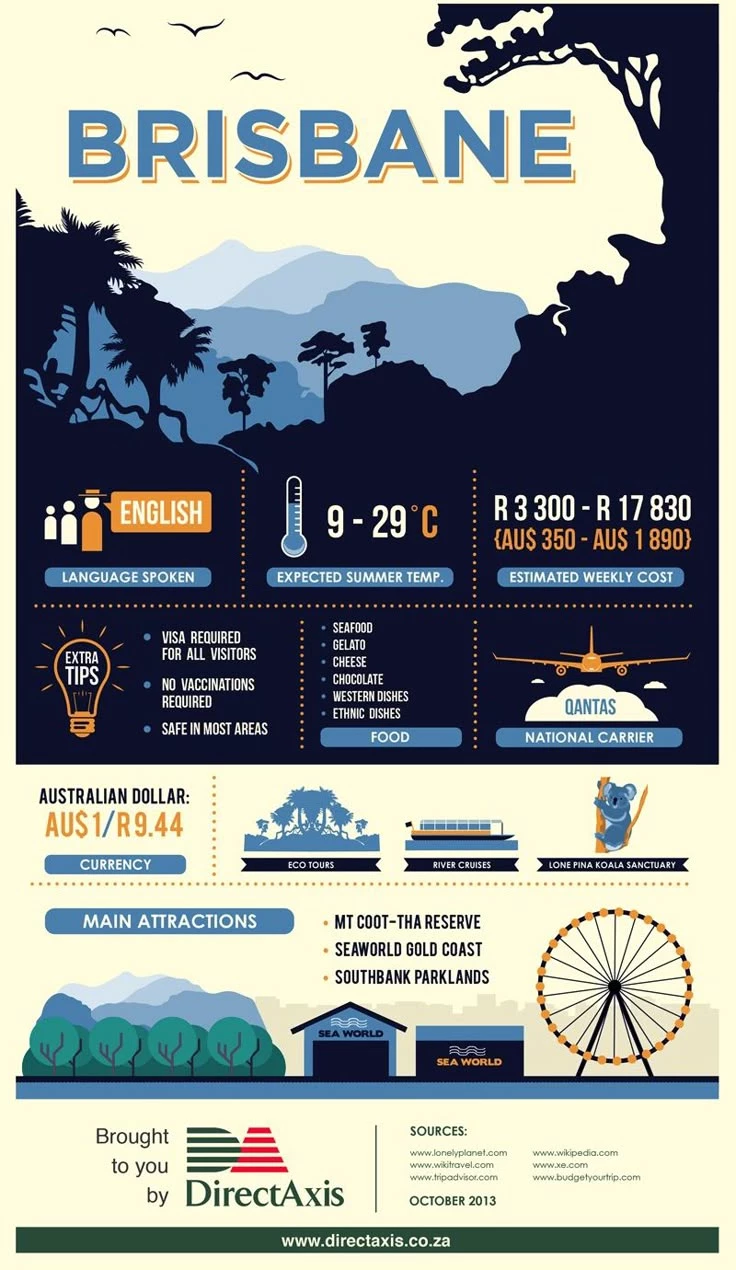
- Overview: A destination guide featuring culture, climate, and currency for inbound travelers.
- Strategic Function: Positions cities or regions through tourism-friendly storytelling.
- Best for:City rebrands, travel campaigns, or global relocation content.
- Agency Play: Use in hospitality creative, tourism board bids, or relocation partner decks.
Sell as part of city branding packages or destination marketing materials. Can also be productized as templated infographics for regional DMOs (destination marketing organizations).
City Startup Snapshot Infographic

- Overview: Visualizes the entrepreneurial ecosystem of Downtown Denver, highlighting startup volume, workforce size, funding activity, and local rankings.
- Strategic Function: Builds civic pride while reinforcing Denver’s market appeal to founders, VCs, and tech talent.
- Best for: Startup ecosystem decks, city branding campaigns, or regional economic reports.
- Agency Play: Use in city-led innovation initiatives, relocation marketing, or to pitch media coverage for local government and economic councils.
Monetize as a branded city performance infographic for economic development boards or as a content asset for regional venture summits, coworking spaces, or accelerator programs.
Global Brand Valuation Infographic
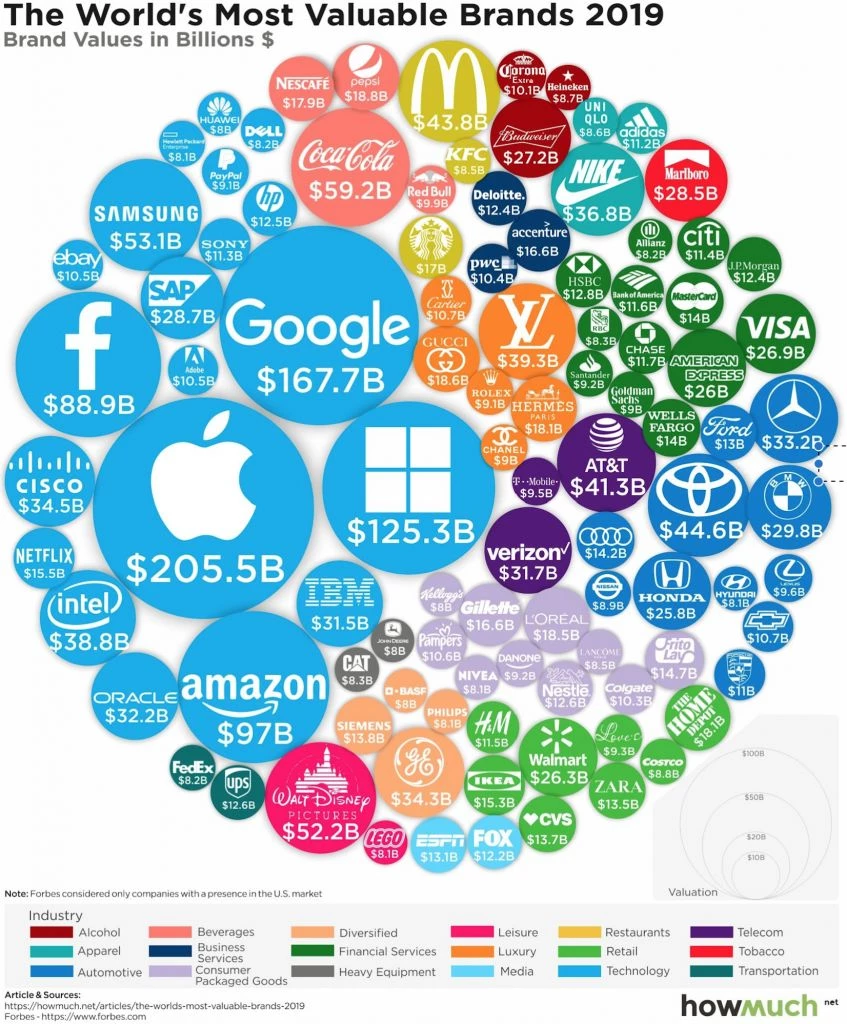
- Overview: Visualizes the relative brand value of top global companies across industries, using scaled bubble charts to represent billions in brand equity.
- Strategic Function: Provides a macro-level view of brand dominance, enabling competitive analysis, investor storytelling, and brand benchmarking across verticals.
- Best for: Executive-level pitch decks, investor reports, brand strategy presentations, or category dominance assessments.
- Agency Play: Use as a foundation for positioning clients against market leaders, or include in market scoping decks to highlight growth potential.
Productize this format into category-specific visualizations (e.g. fintech, luxury, SaaS) and bundle into quarterly brand equity trackers, C-suite dashboards, or thought leadership reports.
Strategic Role of Demographic Infographics in Modern Marketing
A 2024 study published in Strategic Decision Insights found that data visualization plays a “decisive role” in how tech companies allocate resources, communicate insights cross-functionally, and accelerate executive decision cycles. In all case studies, visual reporting led to faster strategic alignment, especially in high-stakes, time-sensitive initiatives.
Agencies that treat demographic infographics as design elements miss the bigger opportunity: these visuals are strategic engines driving performance across the entire marketing lifecycle.
According to a University of Wisconsin Parkside analysis, data visualization empowers marketers to translate complex information into digestible, persuasive content. In digital environments, this isn’t optional — it’s essential.
Companies that expertly apply data visualization see a 44% increase in engagement metrics, according to a 2024 Statista report cited by MarTech & MarOps. Yet while 72% of marketers use visualization tools, fewer than half know how to fully leverage them.
That capability gap presents a positioning edge for agencies that do. Demographic infographics now influence:
• Segmentation & targeting: Visual tools help quickly identify audience clusters and behavioral patterns, enabling hyper-personalized marketing.
• Content strategy: Agencies can publish infographic-rich content that not only educates but differentiates.
• Website & UX design: Interactive visuals improve user journeys and conversions.
• Campaign optimization: KPI dashboards and real-time visuals speed up pivot decisions.
• Stakeholder communication: Clean visuals improve executive buy-in and reduce friction in reporting and strategy alignment.
As CMOs become more data-driven and data analysts more embedded in marketing workflows, the role of demographic visualization moves from “nice to have” to revenue-critical.
Why Demographic Infographics Work in Business Contexts
According to the picture superiority effect, the human brain processes visual information up to 60,000 times faster than text, making images dramatically more memorable than paragraphs of data. That alone justifies their use in fast-paced campaigns and data-rich reports.
But it’s not just theory. A 2023 study published in the Journal of Research in Social Science, Economics and Management (JRSSEM) found that infographics significantly expand campaign reach, enhance brand reputation, and influence consumer behavior more cost-effectively than many traditional content formats.
For agencies, that’s a compelling case for integrating infographic design into your core offerings, especially when you’re pitching storytelling, audience insights, or campaign ideation. When done right, infographics become brand-building tools with measurable upside.
Build smarter dashboards. Start with the right tools.
Best Practices for Designing Demographic Infographics
While data is the foundation, layout and delivery determine whether your infographic drives decisions—or gets ignored.
Use these proven design practices to maximize clarity, trust, and impact:
- Prioritize hierarchy: Lead with the most critical insight. Use size, contrast, and placement to guide the eye from “what’s important” to “what’s supportive.”
- Color with intent: Apply color theory strategically. Blue = trust. Green = growth. Red = urgency. Avoid over-saturation.
- Balance text with visuals: Stick to short phrases. Let icons, symbols, and percentages carry the story when possible.
- Embed source credibility: Cite your data visibly and transparently—especially for external or high-stakes presentations.
- Design for scan-ability: Assume your infographic will be viewed in less than 10 seconds on mobile. Use visual chunking, bold headlines, and modular blocks.
- Format for repurposing: Create in flexible dimensions so it can be broken down into carousels, one-pagers, or social assets without redesign.
- Format for SEO:
- 62.6% of all searches on Google Web Search are image-based, making visual assets a major driver of discoverability.
- Only 25% of ranking pages are currently optimized for images, meaning infographic SEO is still a competitive edge.
Pro Tip: Want your infographic to show up in search? Compress your final file under 1MB, include alt text, and publish it alongside an optimized page description using relevant terms like demographics infographic, buyer persona template, or audience segmentation chart.
Why This Matters for Agencies
For agencies, demographic infographics have moved well beyond surface-level design.
They're now critical tools in the sales and strategy stack, used to win over stakeholders, clarify audience insights, and strengthen the mid-funnel.
Their real value lies in how they accelerate decisions and anchor trust in data.
Here's why that matters now more than ever:
• Visual Strategy is a New Revenue Line: Smart agencies are turning infographic design into standalone offerings, especially for discovery, onboarding, and campaign reporting.
• Clients Want Clarity Over Creativity: CMOs increasingly expect visuals that map to business outcomes (audience alignment, message clarity, journey mapping), not just aesthetics.
• Pitch Differentiation That Scales: Agencies using customized infographics in pitch decks and sales enablement often close faster, with stronger stakeholder resonance.
• Reusable Assets = Higher Margins: Infographics that live across decks, social, and CX reports create long-tail value, without long-tail production time.
Distribution Strategy: How to Make Your Infographic Work Harder
Even the best infographic won’t deliver results unless it’s distributed with purpose.
Here’s how to extend the lifecycle of your demographic infographic:
- Repurpose into micro-content: Slice it into Instagram carousels, LinkedIn posts, and email header graphics.
- Include in lead-nurture assets: Pair with gated reports, whitepapers, or onboarding PDFs.
- Pitch it as thought leadership: Use it to support data-backed opinion pieces or keynotes.
- Add it to sales collateral: Personalize it for different segments or regions in pitch decks.
- Integrate into analytics reporting: Use it to visualize survey data or insights from CRM exports.
Agency Insight: Infographics are especially valuable in mid-funnel content. They compress data and signal credibility without requiring video production or long-form copywriting.
Demographic Infographics: Wrap Up
The value of data lies in what it enables, not in how much you can show. Demographic infographics, when done right, aren’t about simplification—they’re about precision. They let your audience see patterns faster, make decisions quicker, and buy in sooner.
Demographic infographics do more than clarify. They convert insight into inventory. For agencies, they offer a rare intersection of utility and scalability: once created, they don’t just inform a single meeting; they circulate, resurface, and often outlast the campaign itself.
That makes them more than deliverables; they’re assets clients reuse, reference, and request again. In a business where most outputs expire quickly, this format holds its value. Treat it accordingly.
![]()
Demographic infographics don't just simplify data. They turn insights into action. Designed well, they accelerate decisions and improve how teams communicate, pitch, and plan.
That’s why brands need partners who blend design expertise with business insight.
Want to find the experts shaping the future of data-driven design?
Our team ranks agencies worldwide to help you find a qualified partner. Visit our Agency Directory for the top graphic design companies, as well as:
- Top Branding Agencies
- Top Creative Agencies
- Top Market Research Companies
- Top Digital Marketing Agencies
- Best Boutique PR Agencies
Our design experts also recognize the most innovative design projects across the globe. Visit our Awards section to see the best & latest in print design.
Demographic Infographics: FAQs
What is a demographic infographic?
A demographic infographic is a visual tool that presents audience data—such as age, income, location, or behavior—in a clear, engaging format. It helps simplify complex information for faster decision-making and clearer targeting.
What types of businesses benefit most from demographic infographics?
Any brand that targets specific audience segments. That includes DTC, SaaS, healthcare, higher ed, and nonprofit organizations—especially those pitching to stakeholders or aligning internal teams.
What tools can I use to create demographic infographics?
Tools like Canva, Venngage, and Adobe Illustrator are common choices. Use templates designed for data visualization and customize them based on your brand’s hierarchy, palette, and tone.
How do I source data for demographic infographics?
You can use data from surveys, CRMs, Google Analytics, census data, platform insights (e.g., Meta, TikTok), or purchase market research from firms like Statista or Pew Research.