
Data teams are trying to shorten the gap between data and decisions, but most companies are still stuck between static dashboards, manual reports, and disconnected tools.
I tested the AI data analytics tools that stood out and selected the ones that performed well beyond basic demos. These are the tools I would shortlist by use case.
AI Data Analytics Tools: Key Findings
- Julius AI, ChatGPT, Claude, Microsoft Copilot, Gemini, and Tableau Pulse show how AI data analysis is becoming easier to access without a full BI or data science setup, with natural-language queries, spreadsheet analysis, file uploads, and automated KPI insights available to individual analysts and smaller teams.
- ThoughtSpot, Databricks, Snowflake Cortex AI, Qlik, and DataRobot reflect the enterprise side of the market, where conversational analytics increasingly relies on governed data, shared business definitions, predictive models, and AI agents.
- AI analytics adoption is already high in data-heavy industries. About 65% of healthcare organizations use AI for data analytics and data science, while 68% of financial services companies focus their AI efforts on data analytics.
More Than 50% of Organizations Use AI for Analytics Insights
AI data analytics is already becoming a regular part of how businesses work with information.
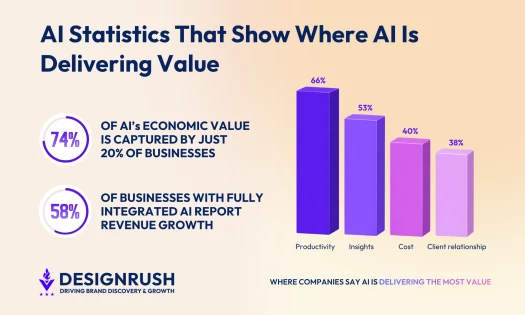
More than half of organizations surveyed by Gartner use AI tools to generate automated insights and support natural-language queries for analytics or AI development.
Gartner also predicts that 75% of new analytics content will be contextualized for intelligent applications through generative AI by 2027, suggesting AI will play a much bigger role in how businesses interpret and use data over the next few years.
The numbers are also high in industries that rely heavily on data. 65% of healthcare organizations use AI for data analytics and data science, and 68% of financial services companies focus their AI efforts on data analytics, according to DesignRush’s AI statistics report.
These tools can take on a wide range of analytical tasks. They can clean datasets, uncover patterns, answer questions in plain language, flag anomalies, build forecasts, and help you make sense of large amounts of information faster.
The right use case will look different for every team.
Marketing teams may use AI to review campaign performance without spending hours building reports. Sales teams can look for customer trends or sharpen forecasts. Data specialists may need predictive modeling, anomaly detection, or software that connects directly with cloud warehouses and enterprise data systems.
That is also why a long feature list does not automatically make a tool the right choice. Before committing to a platform, consider:
- What you need to analyze: Reporting, forecasting, customer behavior, anomaly detection, predictive modeling, or another specific use case
- Where your data lives: Spreadsheets, CRMs, databases, cloud warehouses, and any other systems the platform needs to access
- Who will use it: Business users may prefer natural-language queries and no-code workflows. Analysts may need SQL, Python, or more advanced modeling options.
- How quickly you need answers: Real-time monitoring, one-off analysis, and scheduled reporting each place different demands on a tool
- How much control you need: Permissions, governance, security, and a clear way to check AI-generated findings all become more important once the tool is part of day-to-day decision-making
The best AI for data analysis is the one that fits how your team works, where your data sits, and the kinds of decisions you need to make with it.



1. ThoughtSpot: Best for Conversational Enterprise BI
For enterprise teams that need conversational analytics across large cloud data environments.
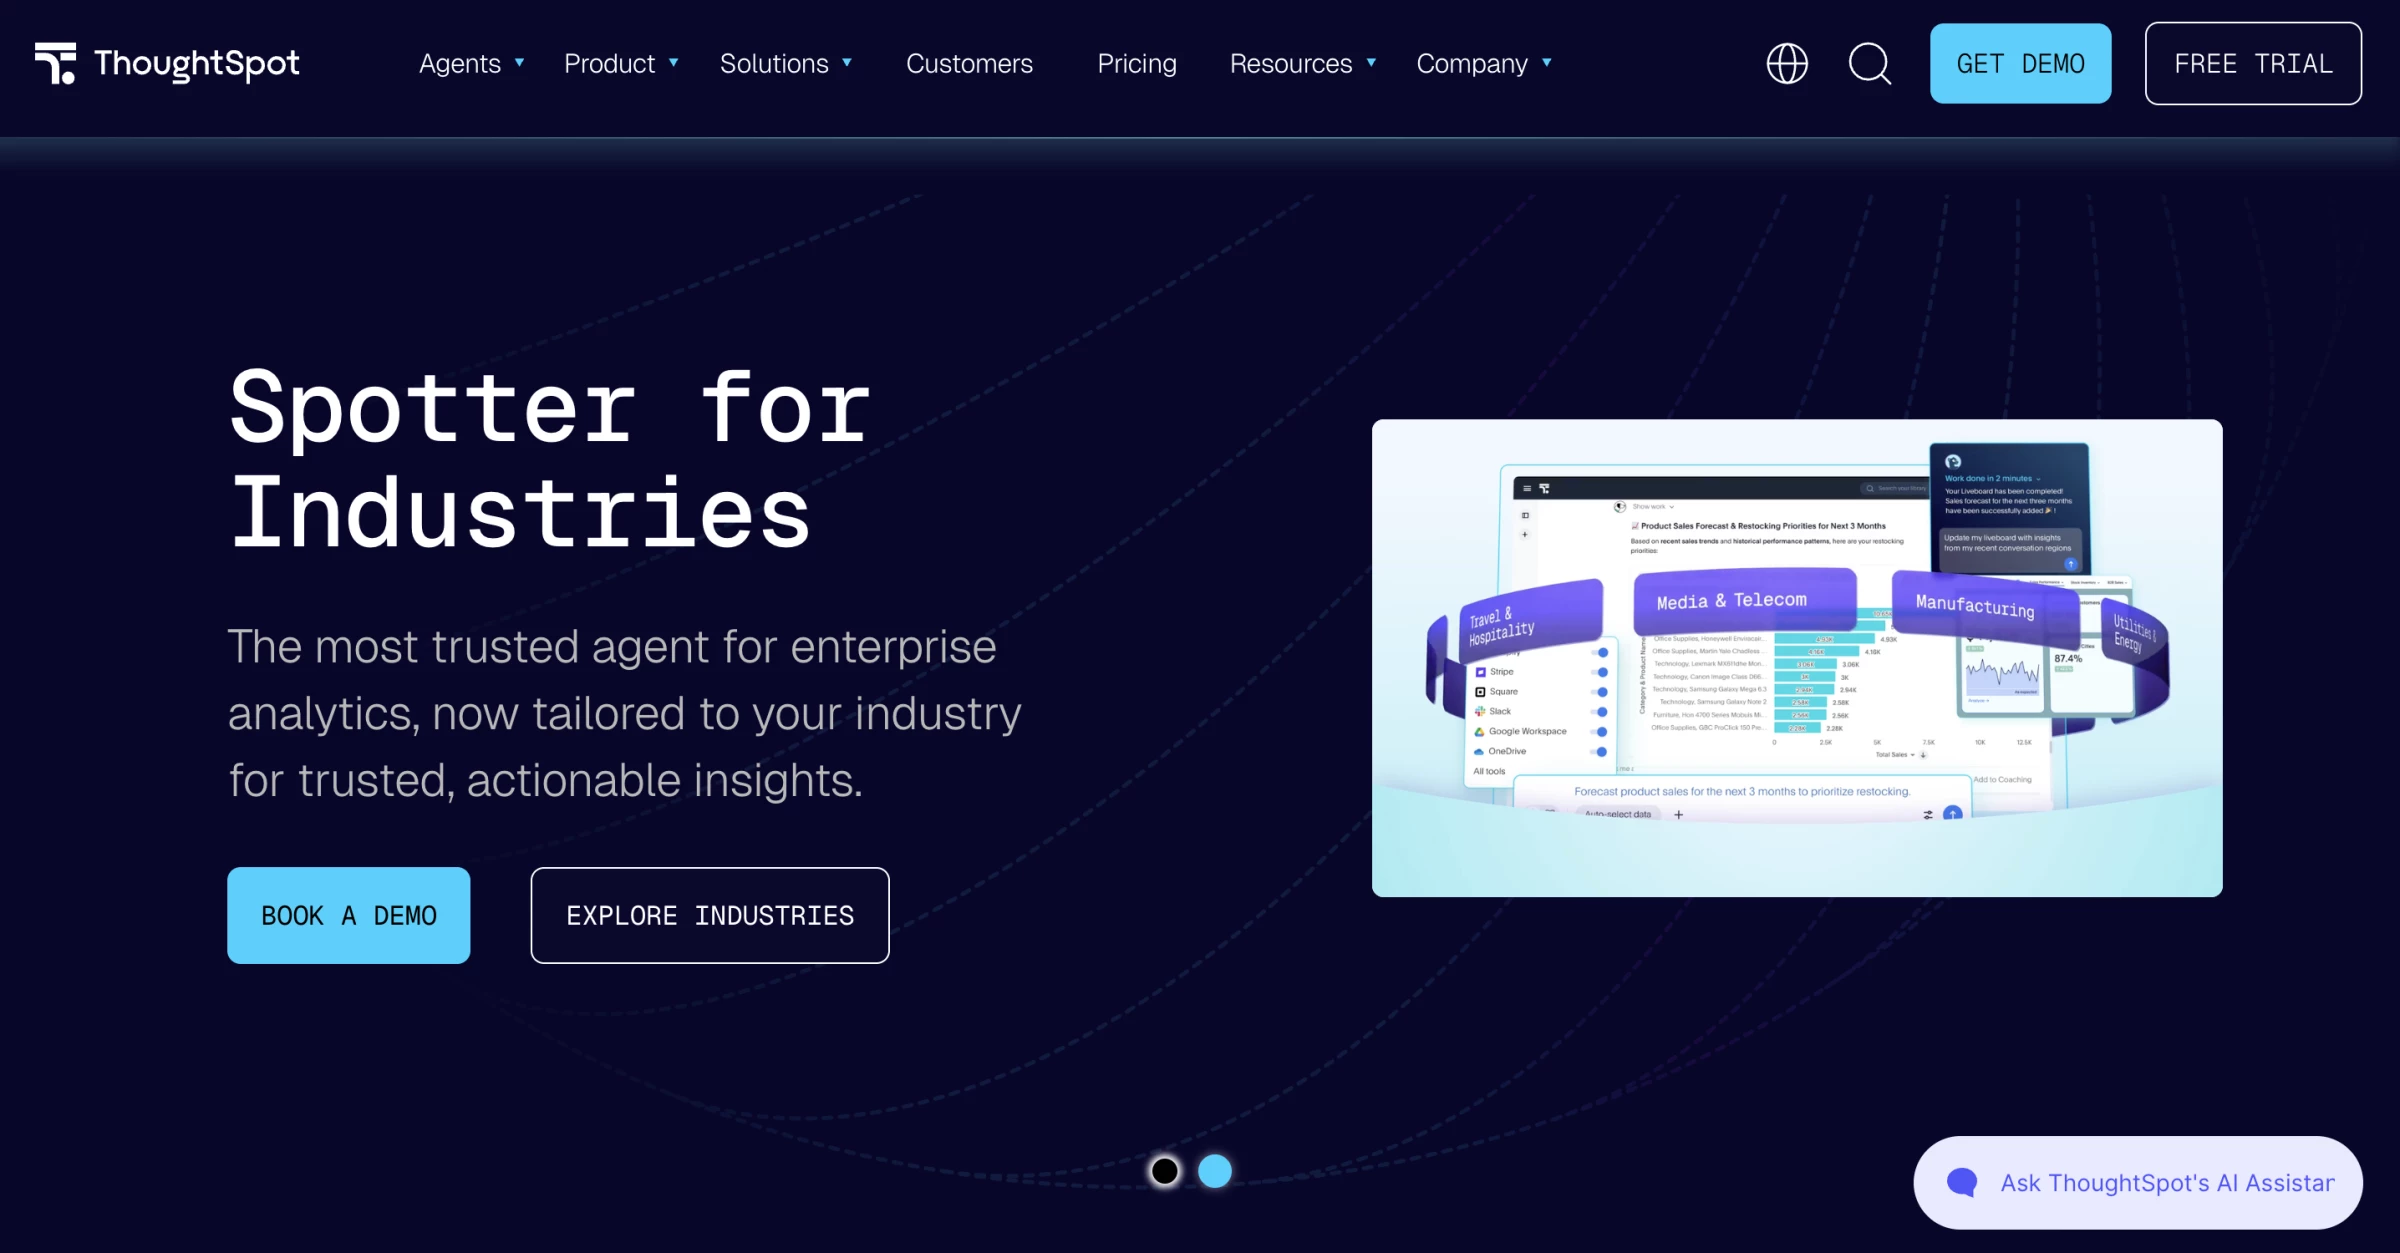
I would shortlist ThoughtSpot for enterprise teams that already have a strong cloud data setup and want business users to ask plain-English questions across trusted data.
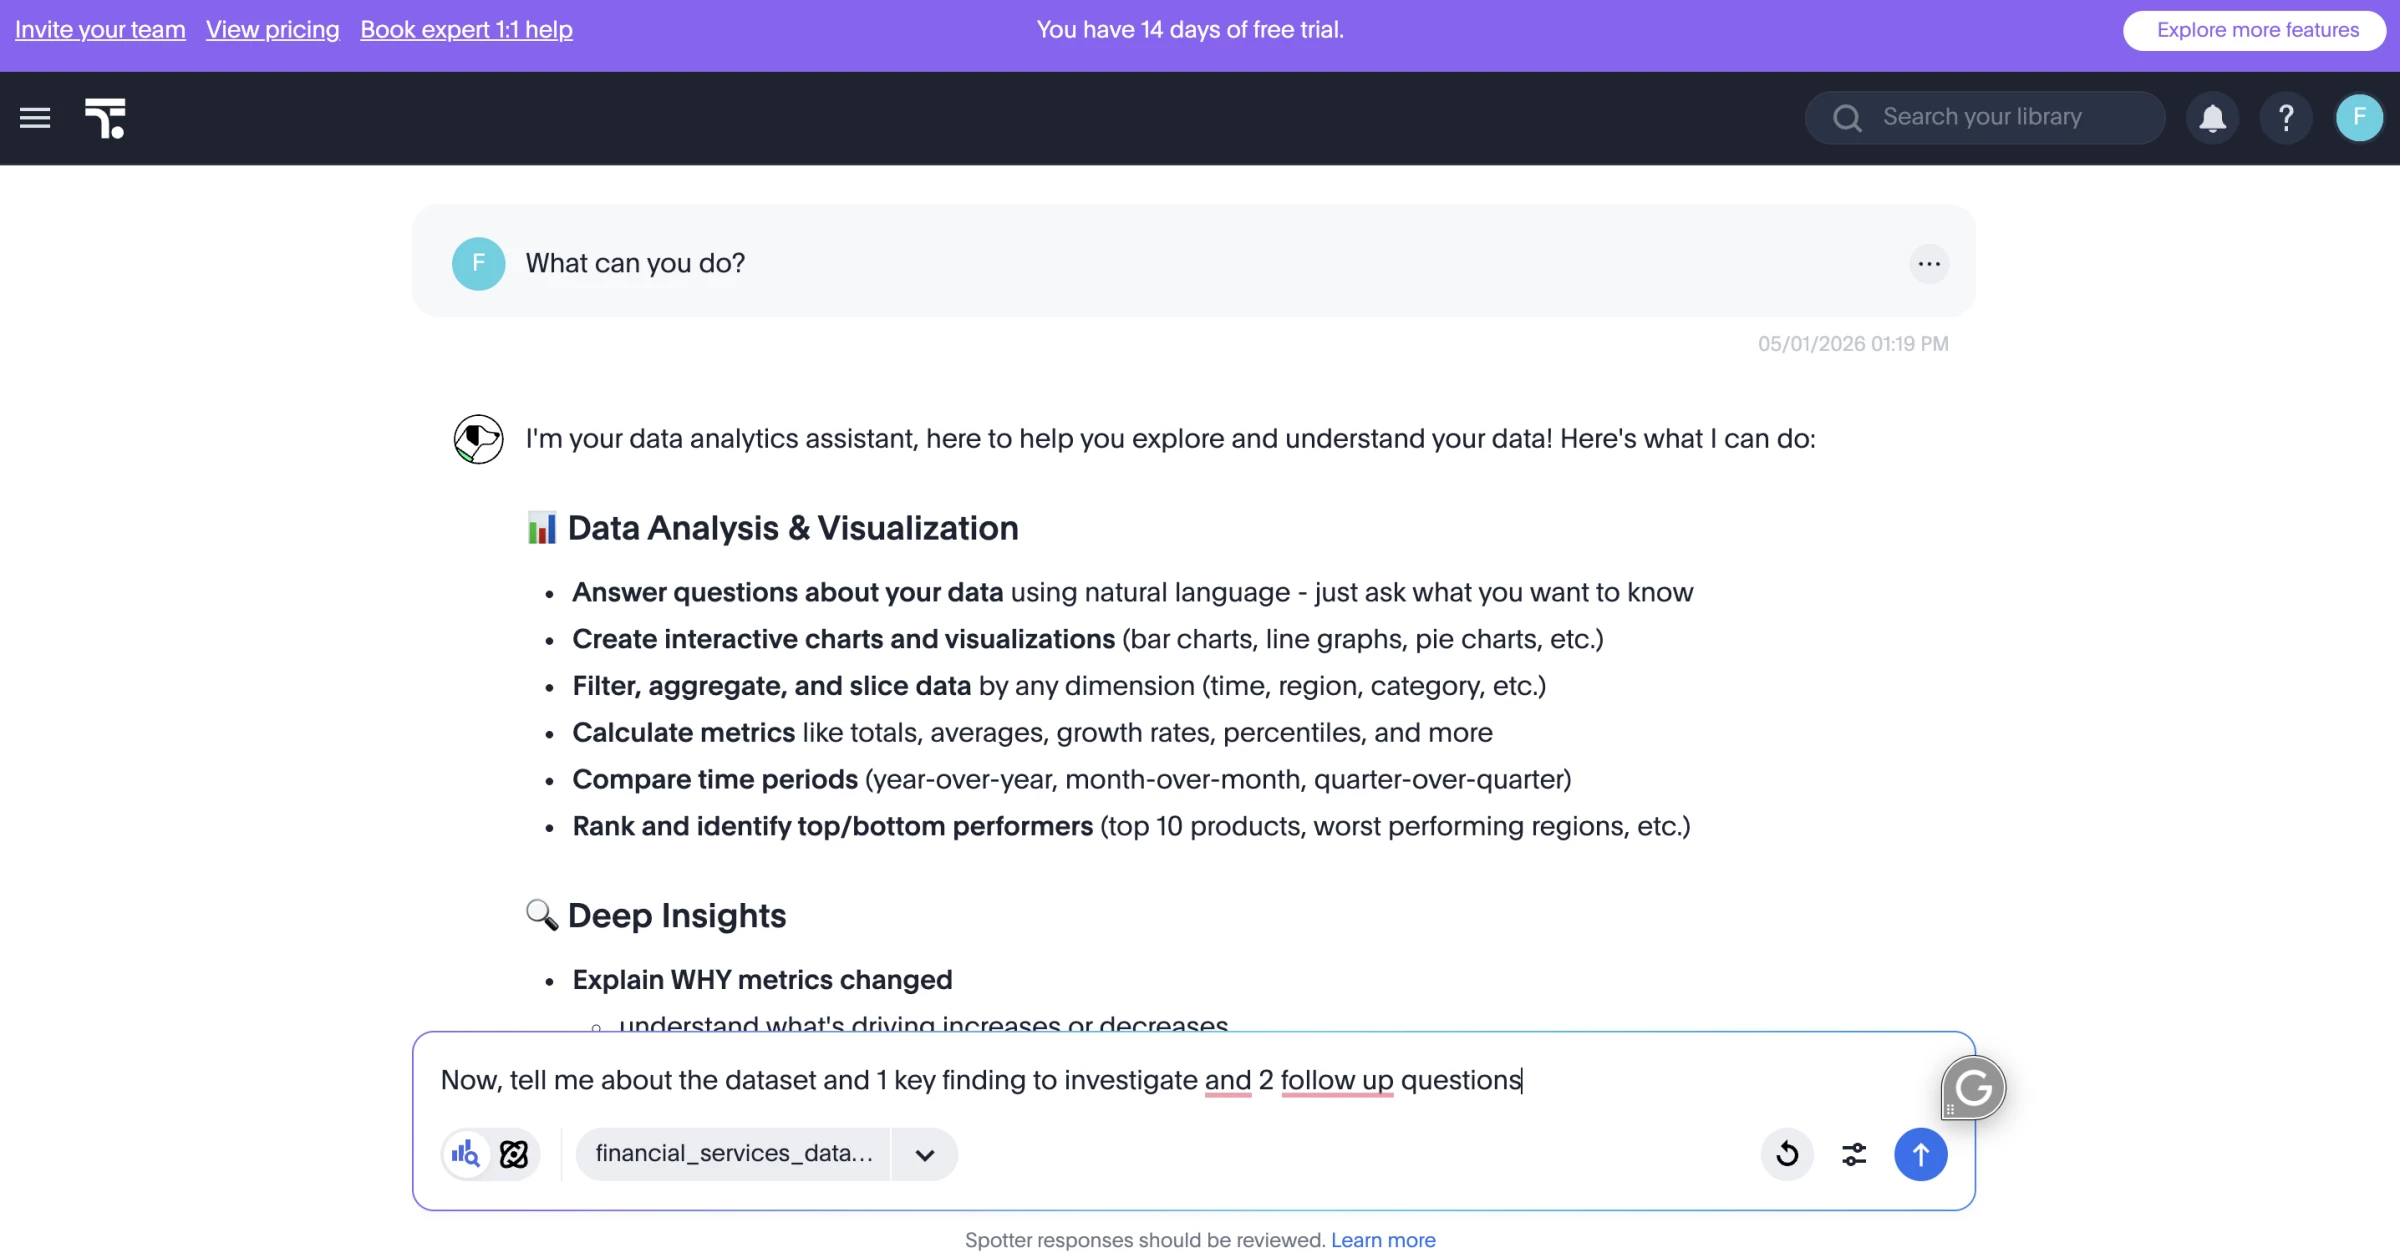
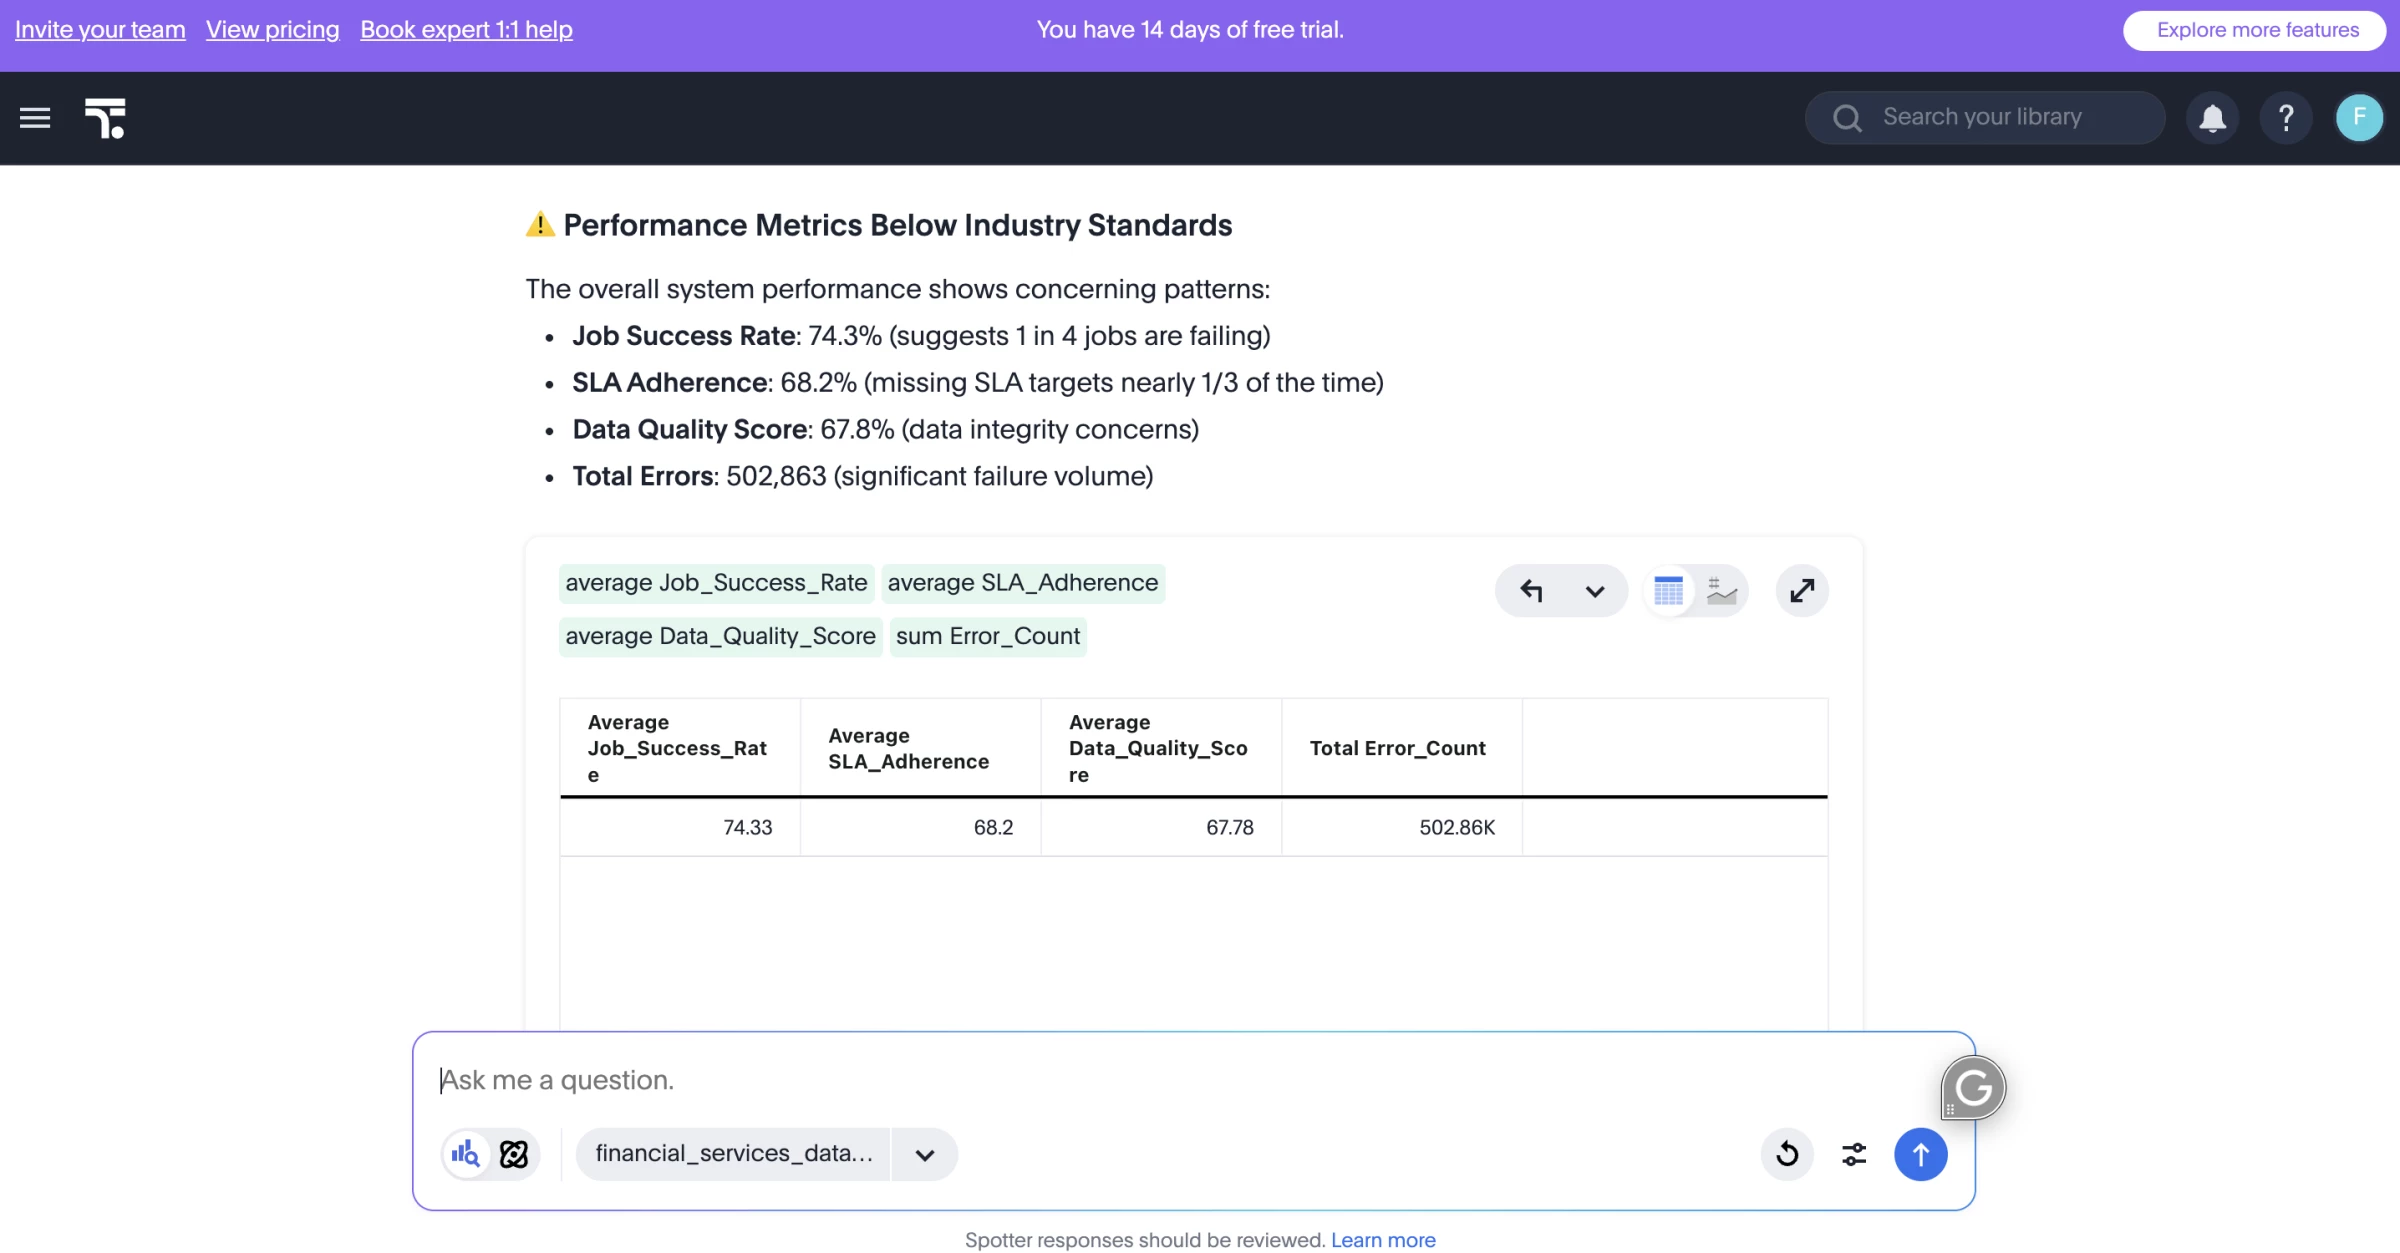
Instead of building another static dashboard, I could ask questions in plain English through Spotter, ThoughtSpot’s AI agent, and use it to explore trends, drill into metrics, and surface answers from connected business data.
Key Features
- Spotter AI agent: Answers natural-language questions and supports follow-up analysis
- Liveboards: Interactive dashboards for KPI monitoring and deeper exploration
- Direct data connections: Works with Snowflake, Databricks, BigQuery, Redshift, and other databases
- Semantic modeling: Keeps joins, calculations, metrics, and business definitions consistent
- Embedded analytics: Adds AI-powered analytics and dashboards inside apps and portals
Pros
- Makes enterprise data easier for nontechnical users to explore
- Supports large and complex cloud data environments
- Useful for self-service analytics
- Connects directly with major enterprise data platforms
Cons
- Needs clean, well-modeled data to work well
- Not ideal for quick spreadsheet-only analysis
- Setup may require data team support
Pricing
- Essentials: From $25/user/month, billed annually
- Pro: From $50/user/month, billed annually
- Enterprise: Custom pricing
- Embedded Developer: Free for 1 year
What Users Say
Users say ThoughtSpot is strongest when they can use search-style analytics to explore data quickly instead of building reports from scratch.
The main criticism is that ThoughtSpot needs a mature data setup to perform well. Gartner Peer Insights notes that users may need extensive data modeling and NLP coaching to get the most out of it, and a learning curve for advanced functions and some limits around visualization customization.
2. Domo: Best for AI-Powered Executive Dashboards
For companies that need to unify large business datasets, monitor KPIs in real time, and give business teams easier access to analytics.
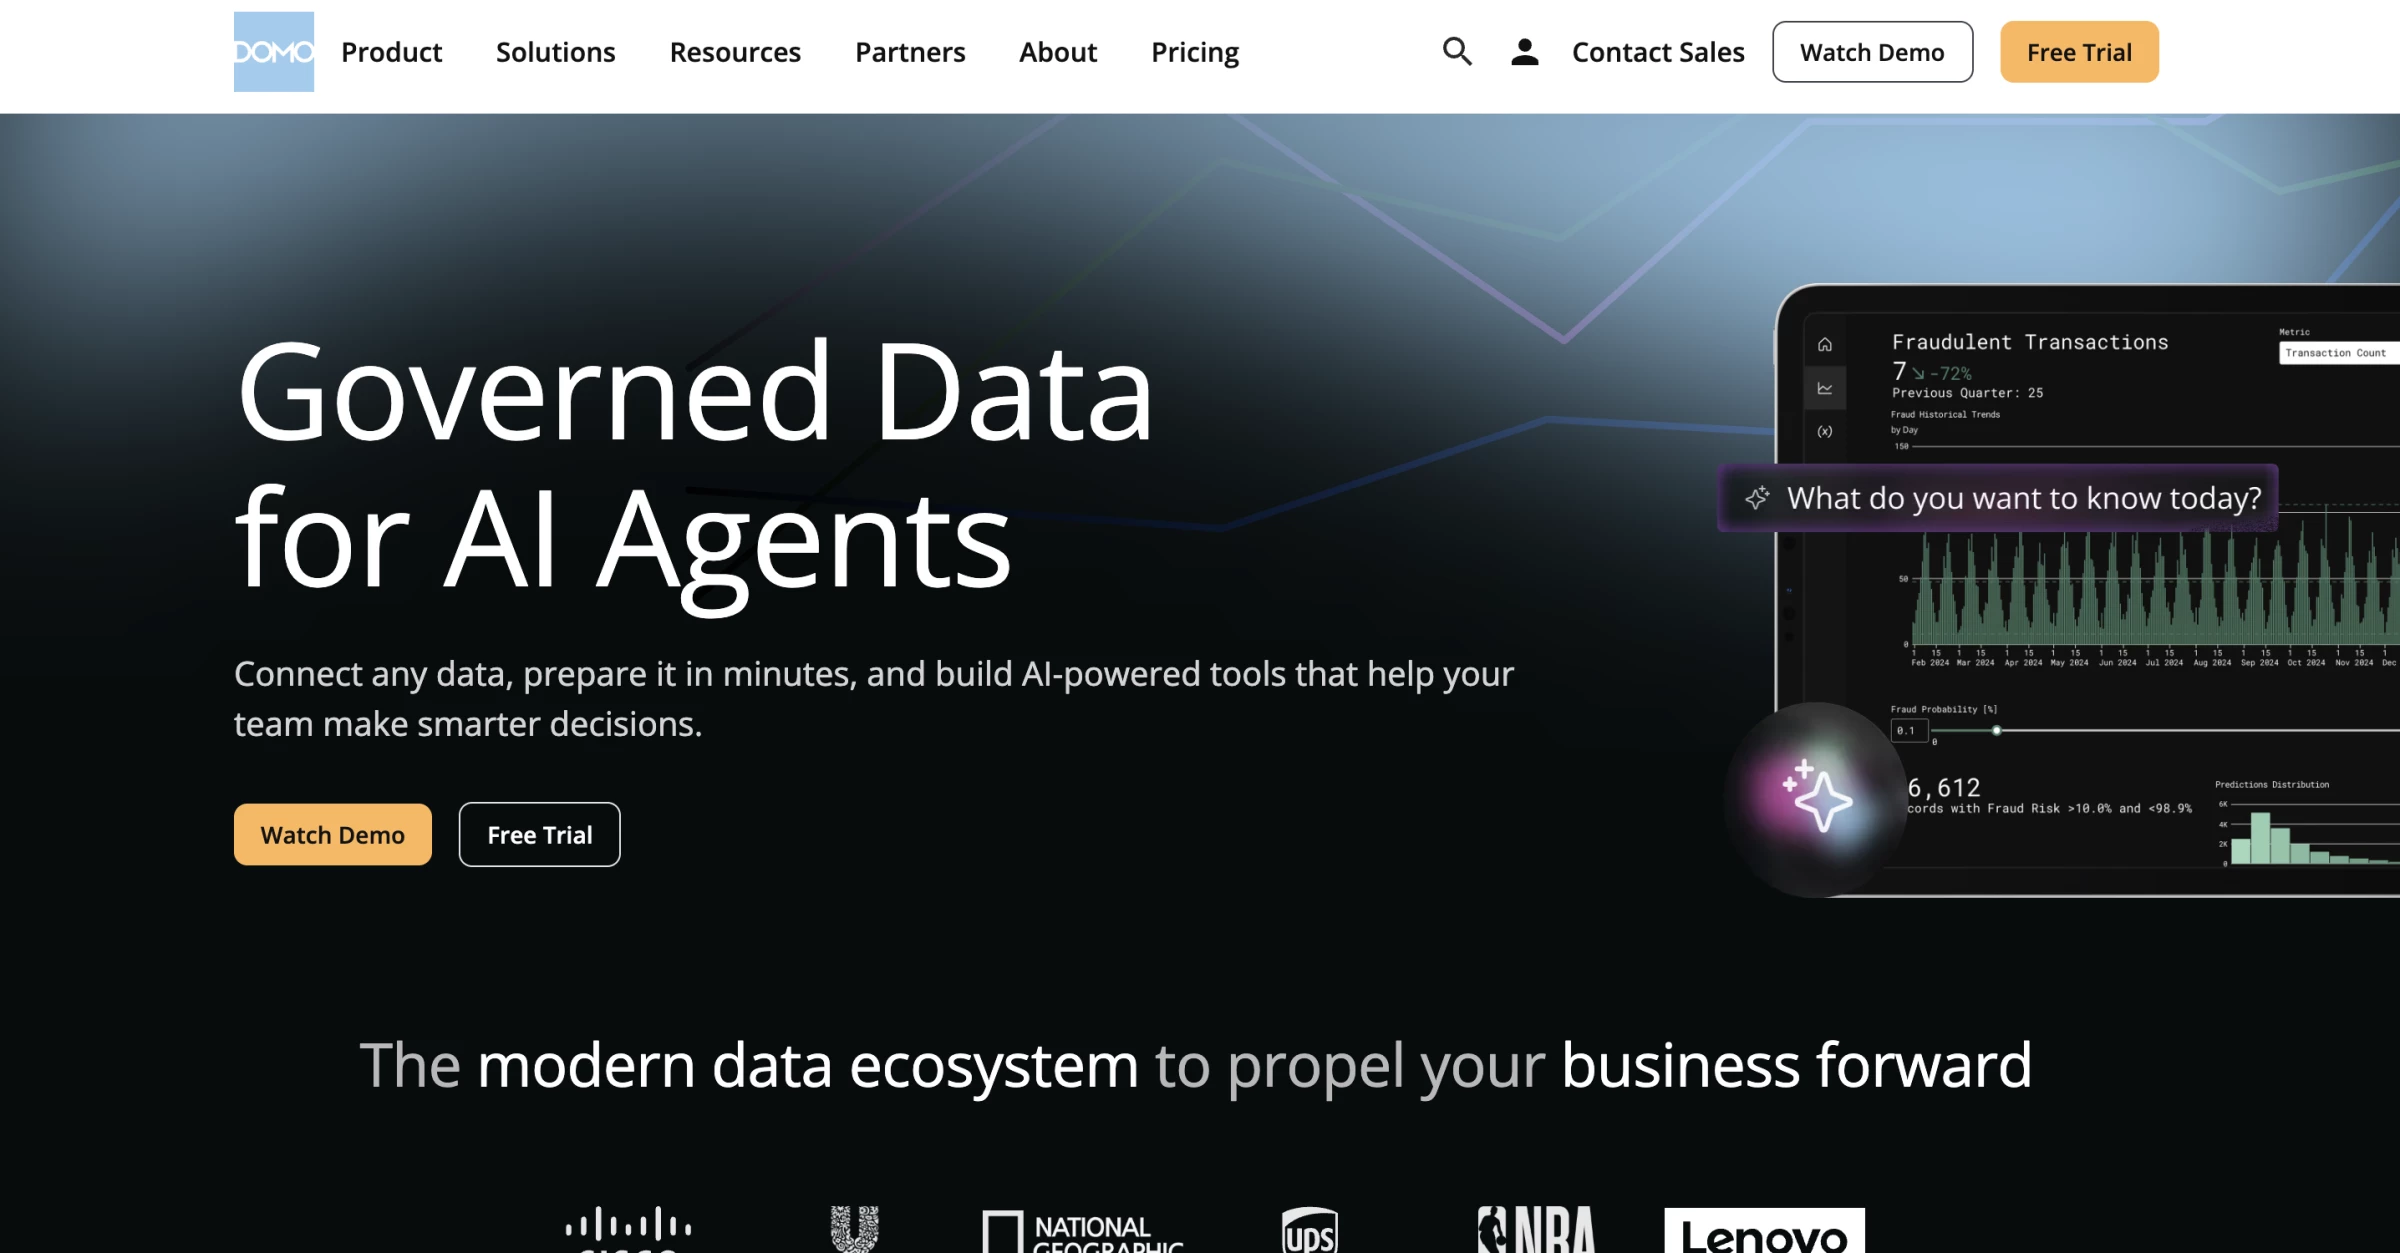
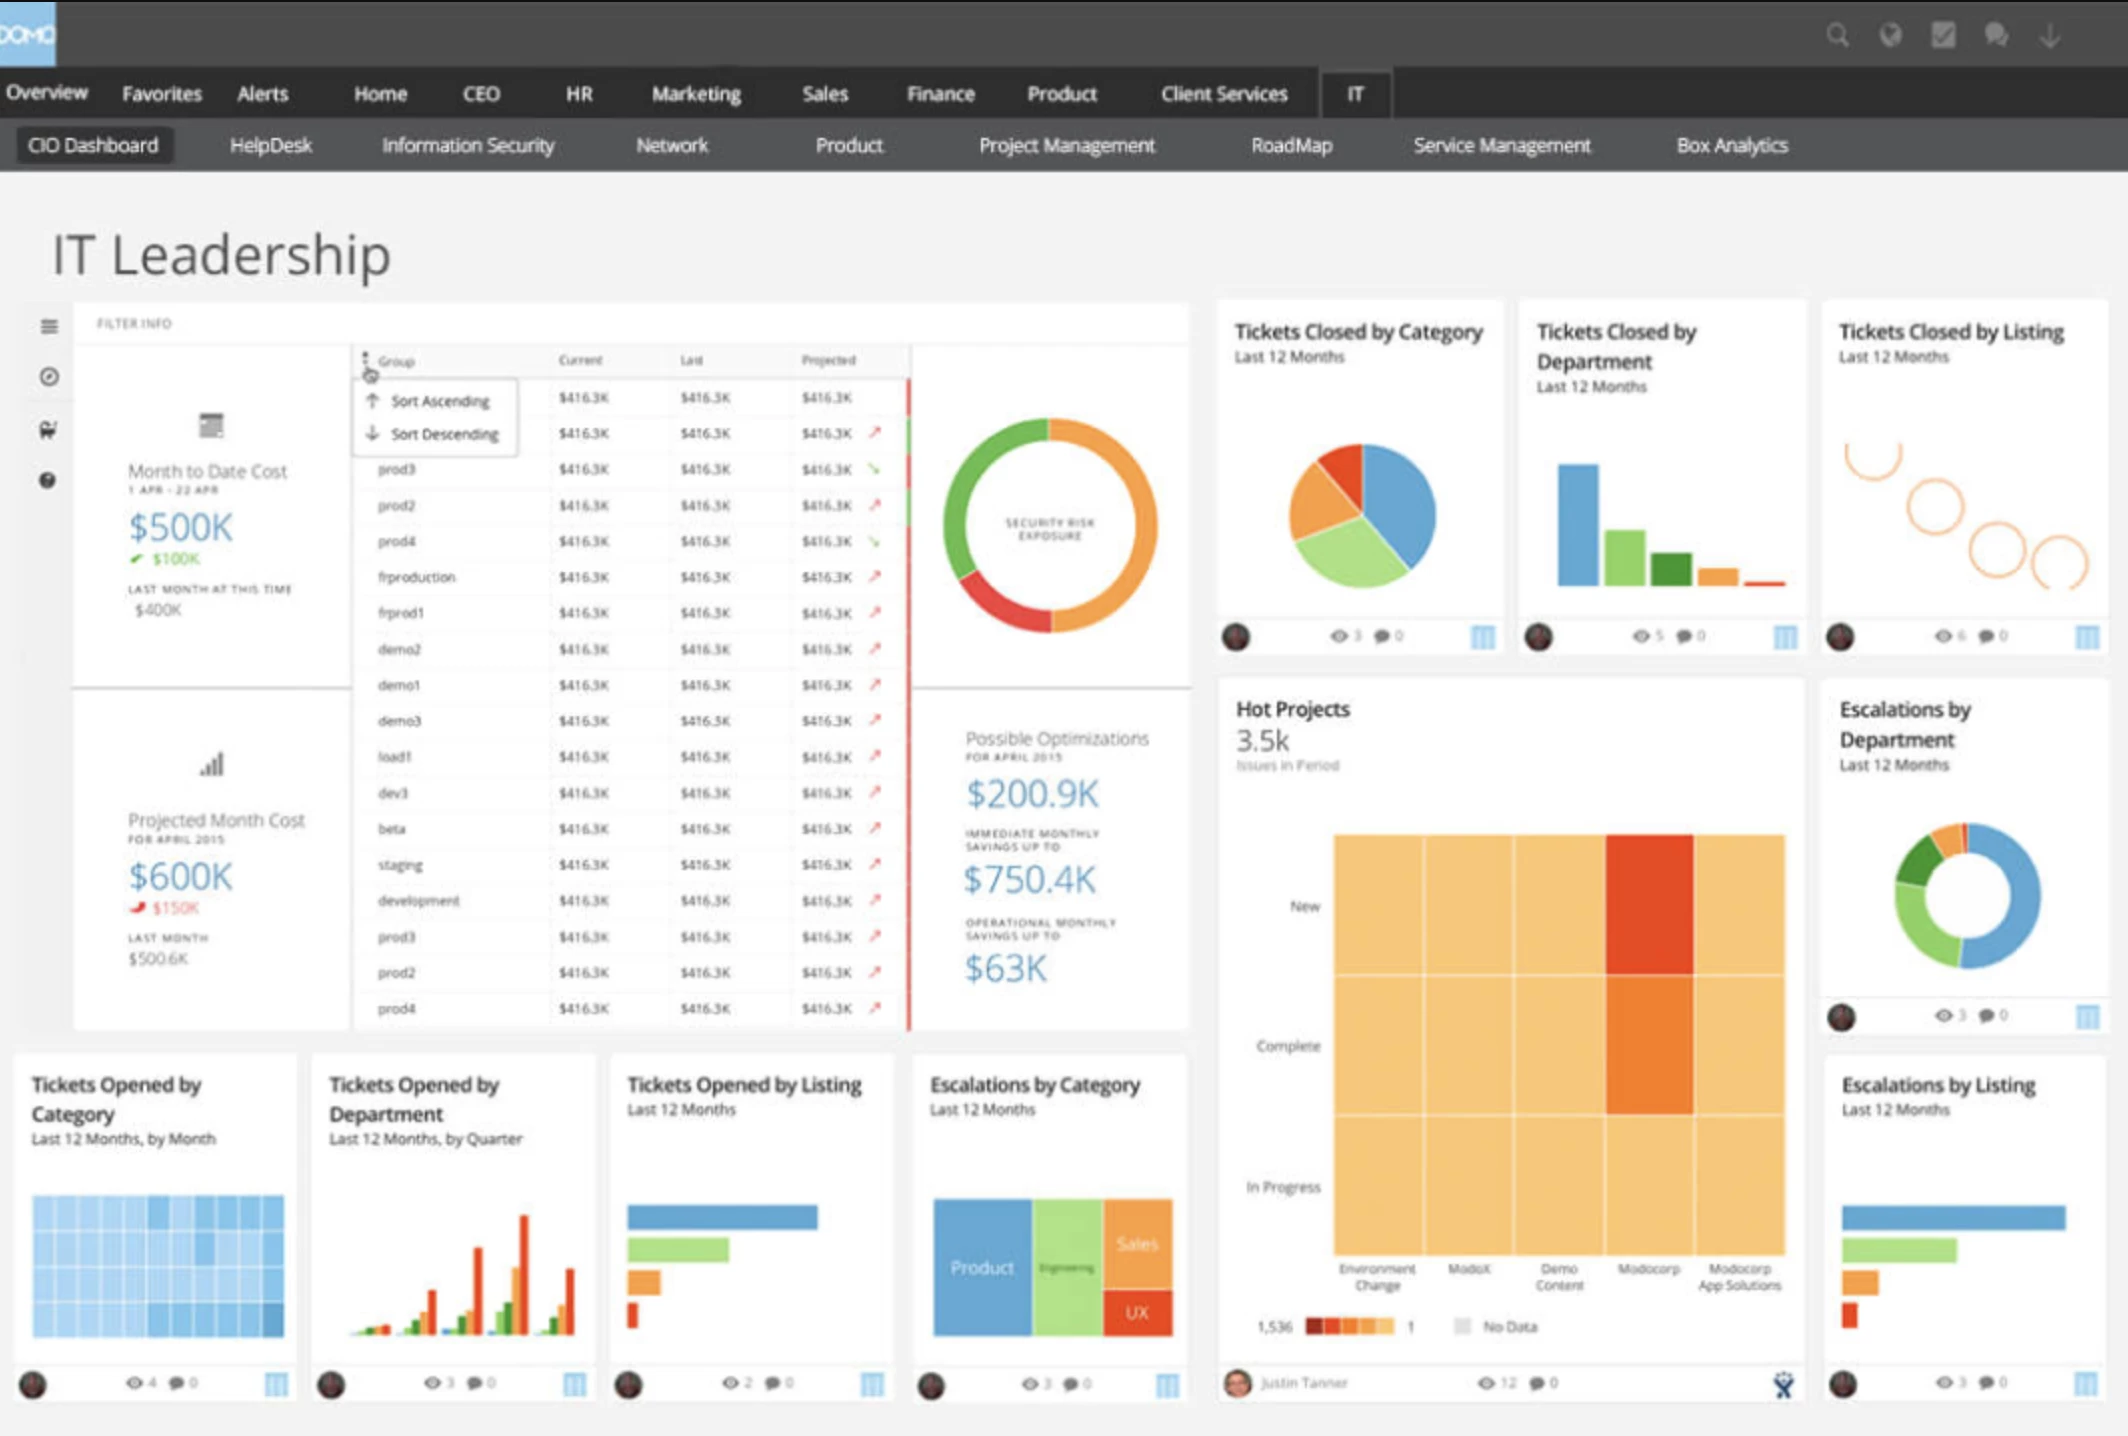
Domo works well for companies that need to consolidate data from multiple business systems into a single platform and keep leadership up to date on key metrics.
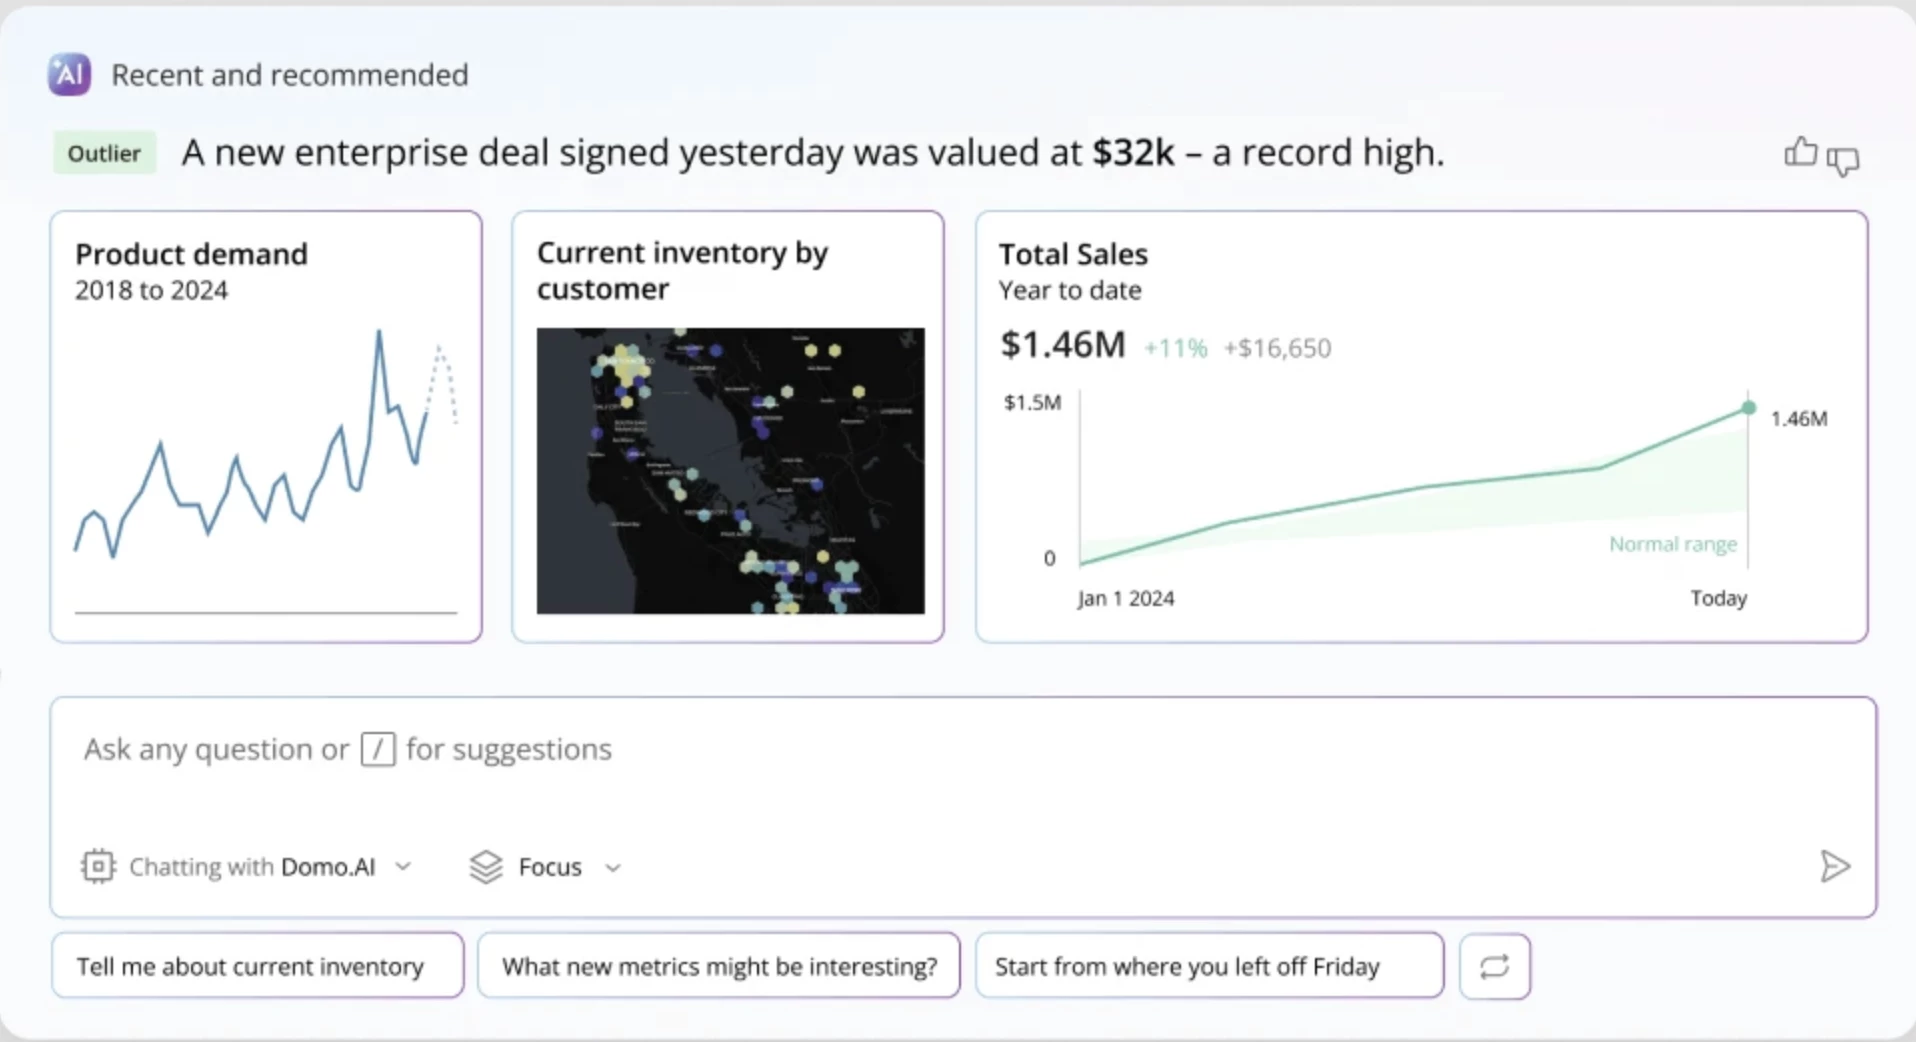
Its dashboards, AI Chat, and custom AI agents give business users several ways to explore performance without relying on a new report for every question.
I’d shortlist it for executive and operational reporting in particular. Domo connects business data via a large library of connectors and includes drag-and-drop ETL tools to clean and transform it before it reaches dashboards, workflows, and AI features.
Key Features
- AI Chat: Lets users ask questions about business data and explore results conversationally
- Custom AI agents: Support data-driven questions, predictions, and automated workflows
- Drag-and-drop ETL: Cleans, joins, and transforms data without heavy coding
- Dashboards and embedded analytics: Turn connected data into visual reports inside Domo or external apps
- Workflows and alerts: Automate recurring processes and notify teams when important metrics change
Pros
- Well suited to executive dashboards and KPI monitoring
- Connects data from a wide range of business systems
- Includes analytics, data preparation, AI, and automation in one platform
- Unlimited users with no per-user charges
Cons
- Setup can become complex when several datasets and systems are involved
- Credit-based pricing can be harder to estimate in advance
- Pricing
- 30-day free trial: Full platform access, unlimited users, onboarding support, and one training session
- Custom pricing: Credit-based pricing tied to actual usage, with unlimited users and no per-user fees
What Users Say
Users say Domo is strongest when teams need to unify data from multiple sources and turn it into dashboards that business users can actually use.
The main complaints are pricing complexity, setup effort, and the learning curve around more advanced workflows.
3. Brandi AI: Best for AI Visibility Analytics
For CMOs and SEO leaders who need to track and improve brand visibility across AI-generated answers.
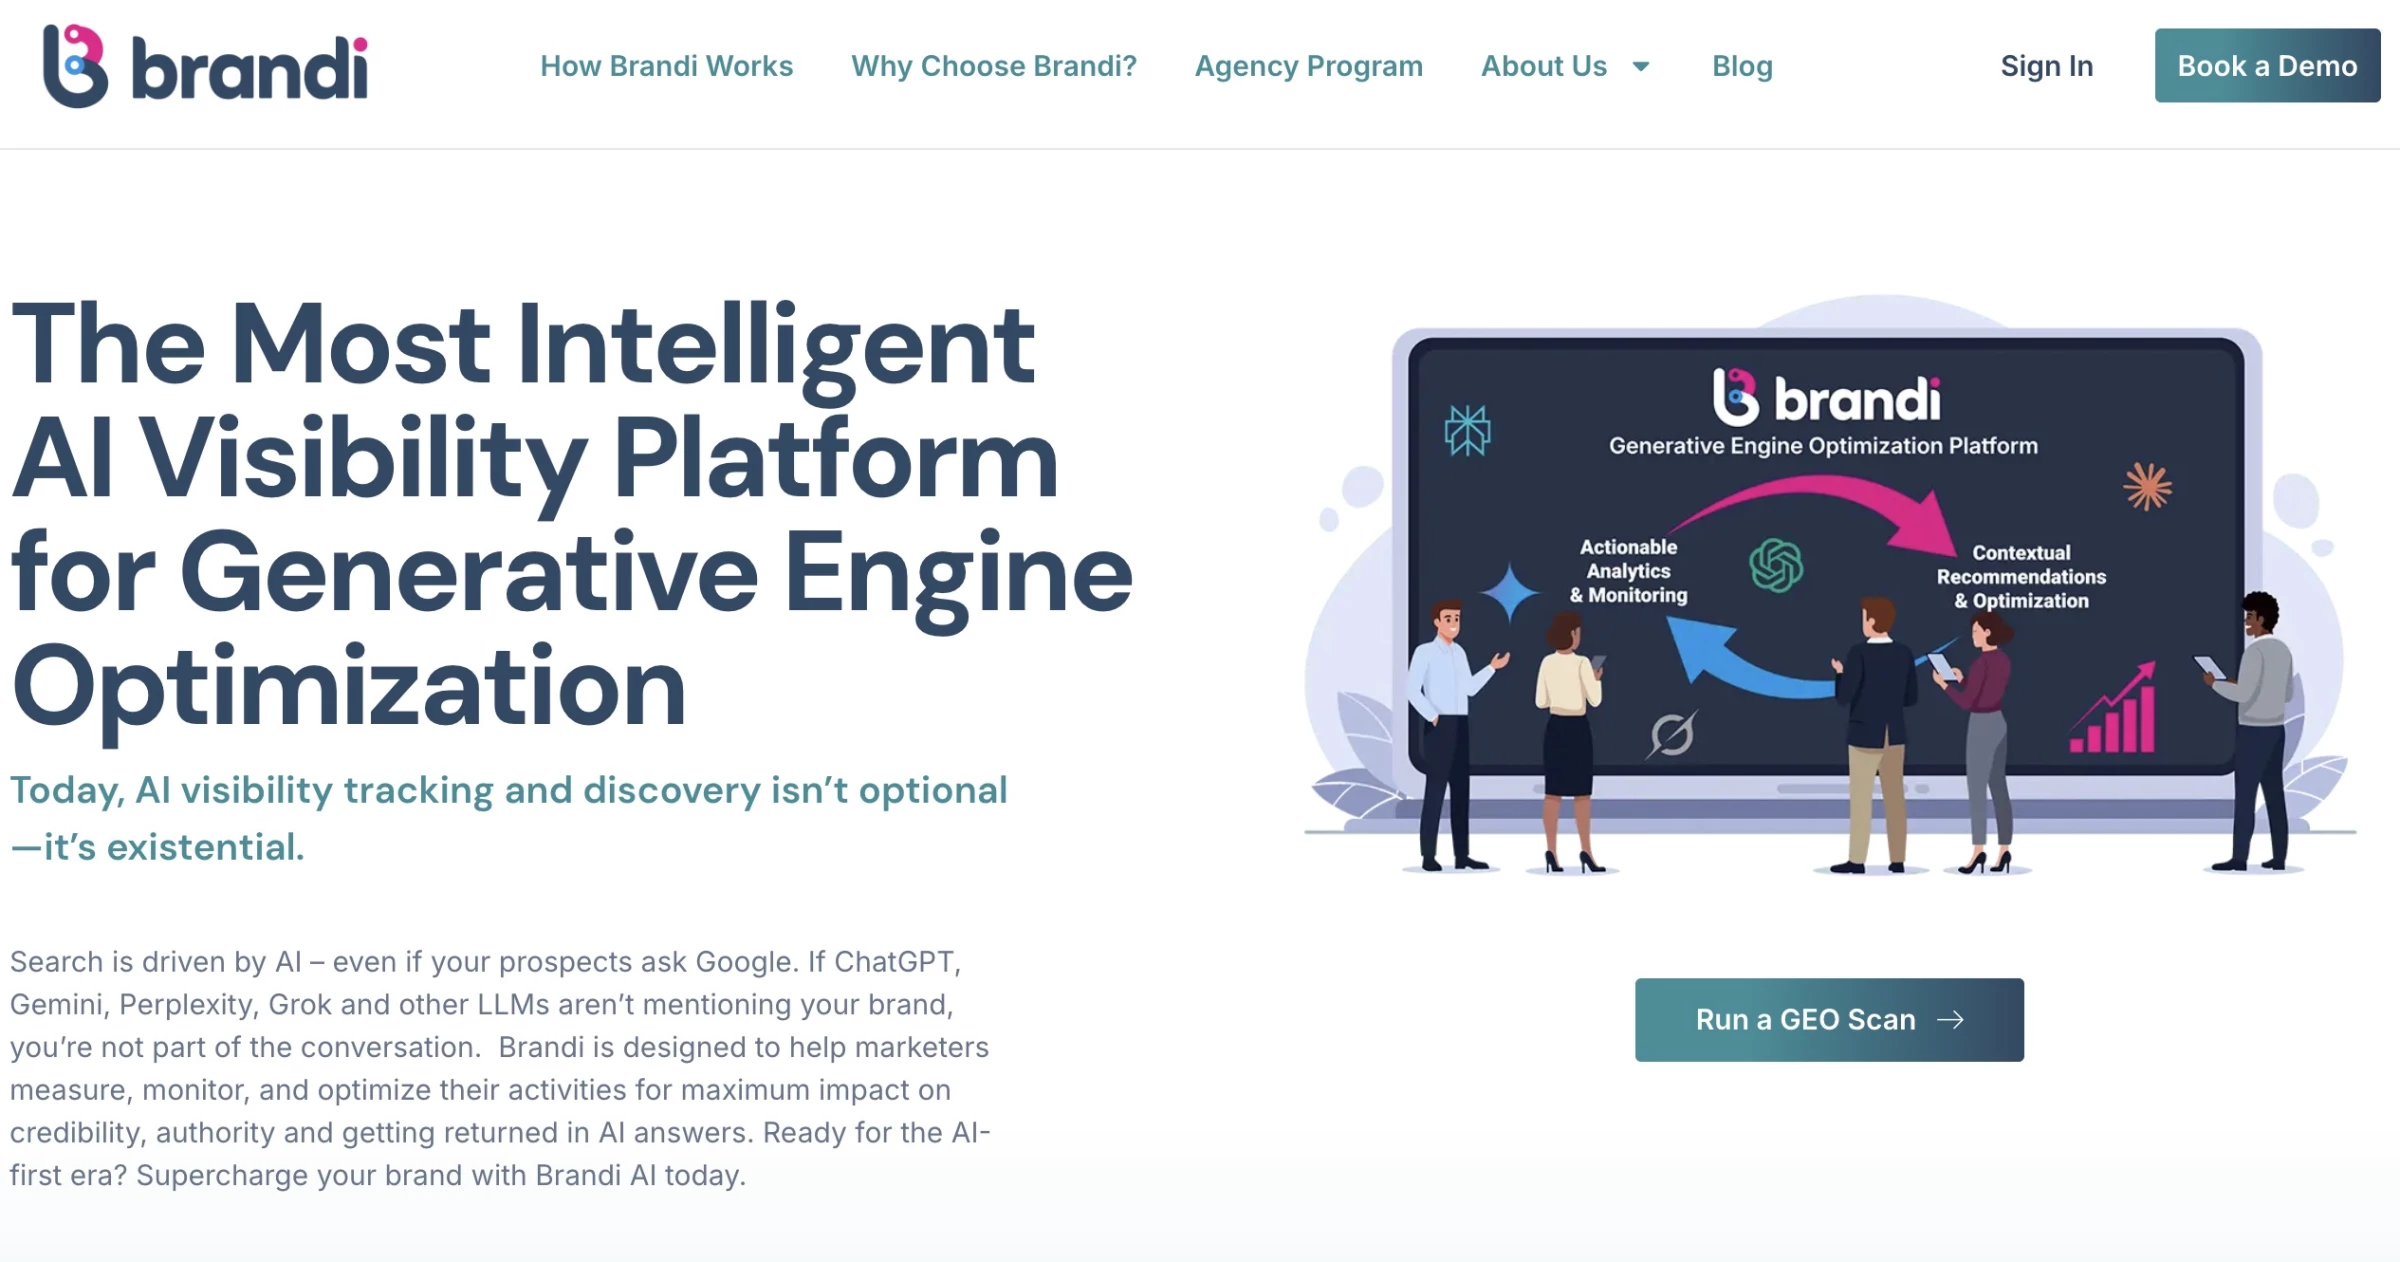
Brandi AI focuses on how brands appear in AI-generated answers, including whether they are mentioned, cited, and positioned favorably relative to competitors.
The platform tracks real buyer questions, benchmarks AI visibility, and provides GEO recommendations that help teams improve how their brand appears in platforms like ChatGPT and Google AI Overviews.
Key Features
- Competitive Market Universe: Benchmarks brand visibility and competitive share of voice in AI-generated answers
- Sentiment Hub: Tracks how AI describes a brand, including sentiment, attributes, and competitive positioning
- GEO recommendations: Identifies messaging and content gaps and suggests ways to improve AI visibility
- Citation and source analysis: Shows which sources influence brand mentions and citations in AI answers
- Global visibility analysis: Tracks AI-generated answers across 15+ languages and regional contexts
Pros
- Built around real buyer questions rather than keyword rankings
- Competitive benchmarking reveals share of voice in AI responses
- Provides actionable GEO recommendations
- Supports multi-language and multi-market analysis
Cons
- May feel niche for teams not focused on AI-driven discovery
- Requires content and SEO alignment to fully maximize value
Pricing
- Starting at $349.99/month
Book a demo with Brandi AI to know more.
What Users Say
From what users share, Brandi AI serves more as a strategy tool for AI visibility than a simple tracker.
People especially like that it goes beyond monitoring and actually gives clear direction on how to improve content for AI visibility.
The trade-off is that it’s not the most lightweight tool. Some users say it can feel a bit much if you’re just experimenting, since it’s built more for teams taking GEO seriously.
Overall, it’s seen as powerful and insight-driven, but best suited for teams ready to act on the data, not just track it.
4. Zuko: Best for Form and Checkout Analytics
For CRO, eCommerce, and lead-generation teams that need to find exactly where users abandon forms, applications, and checkouts.
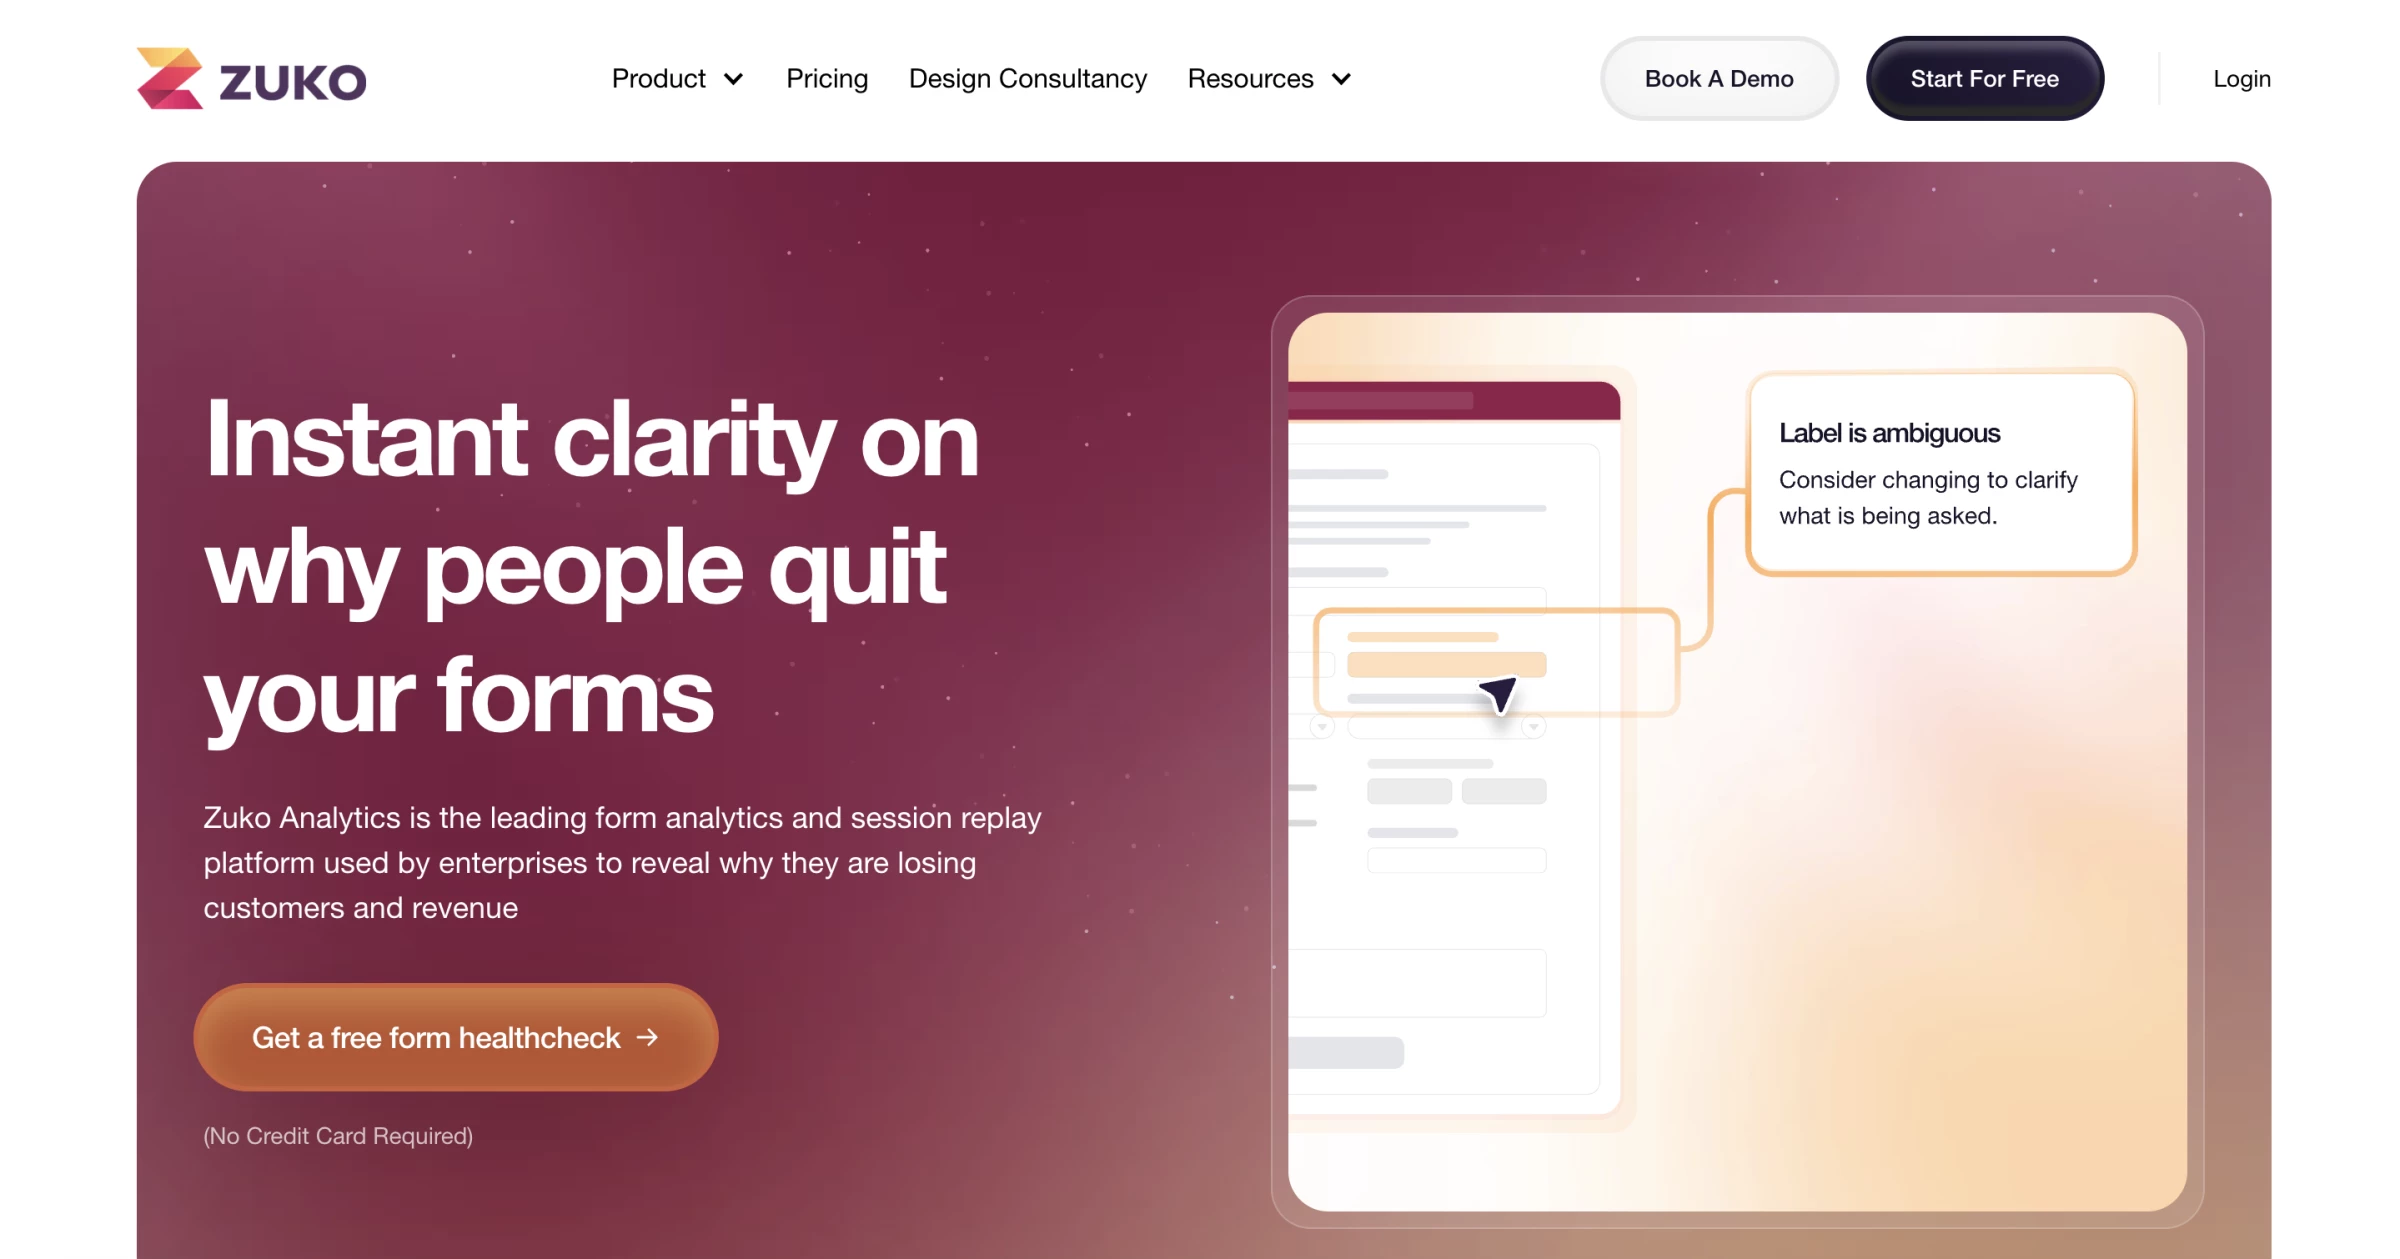
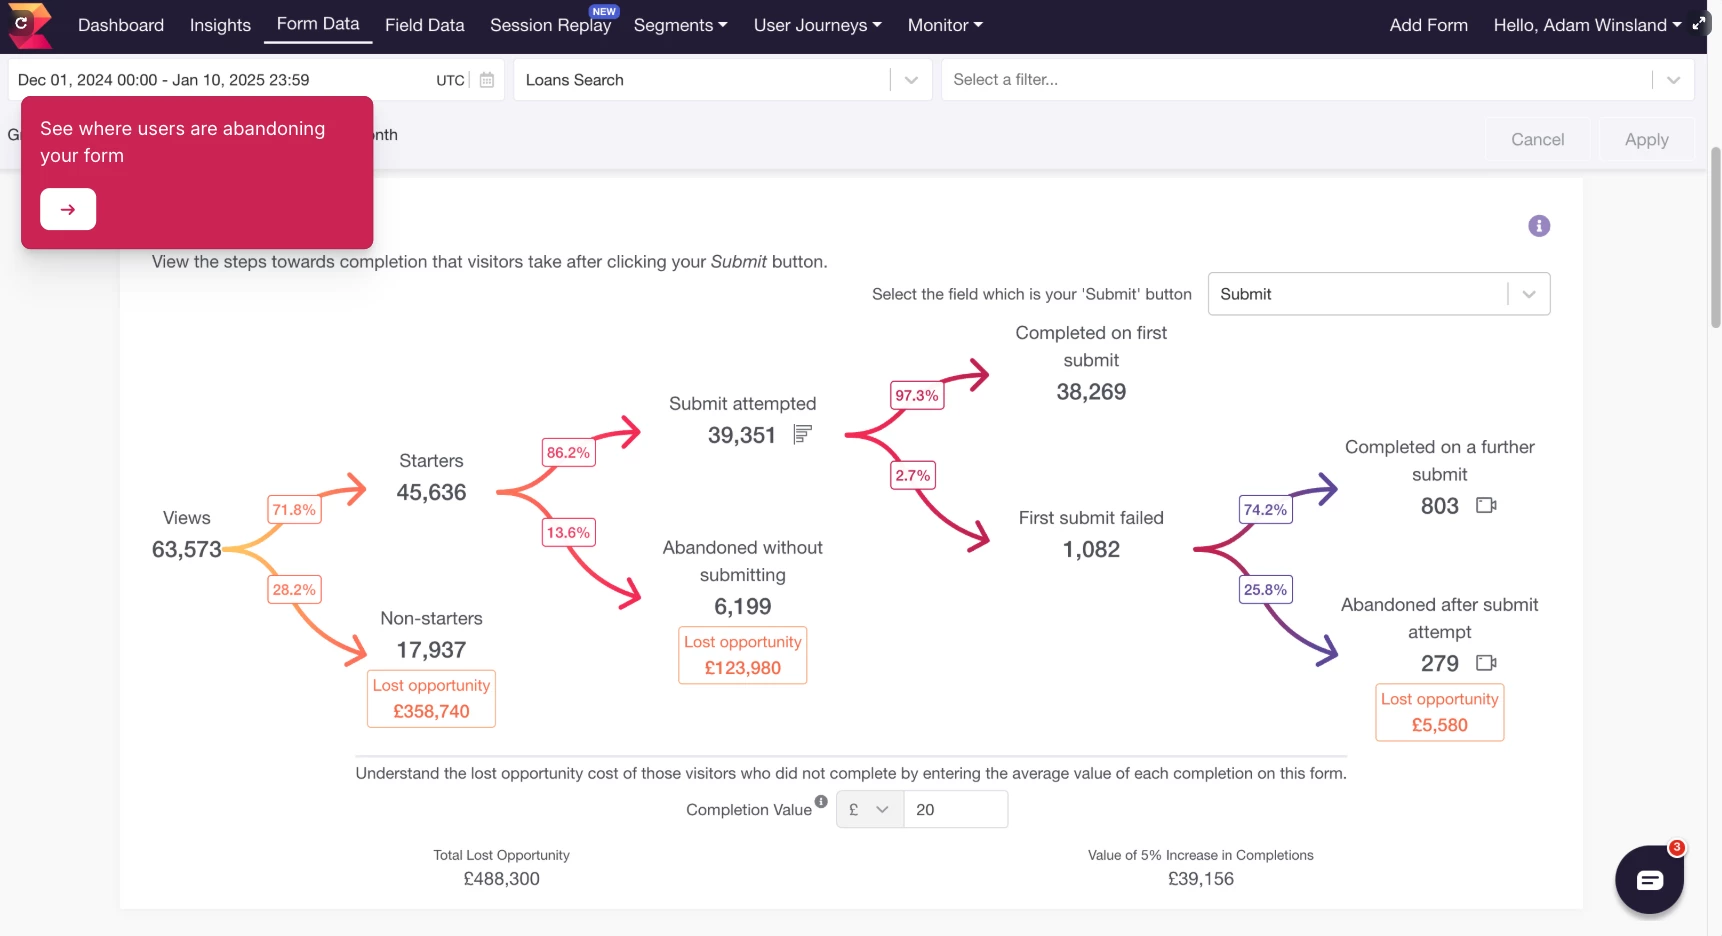
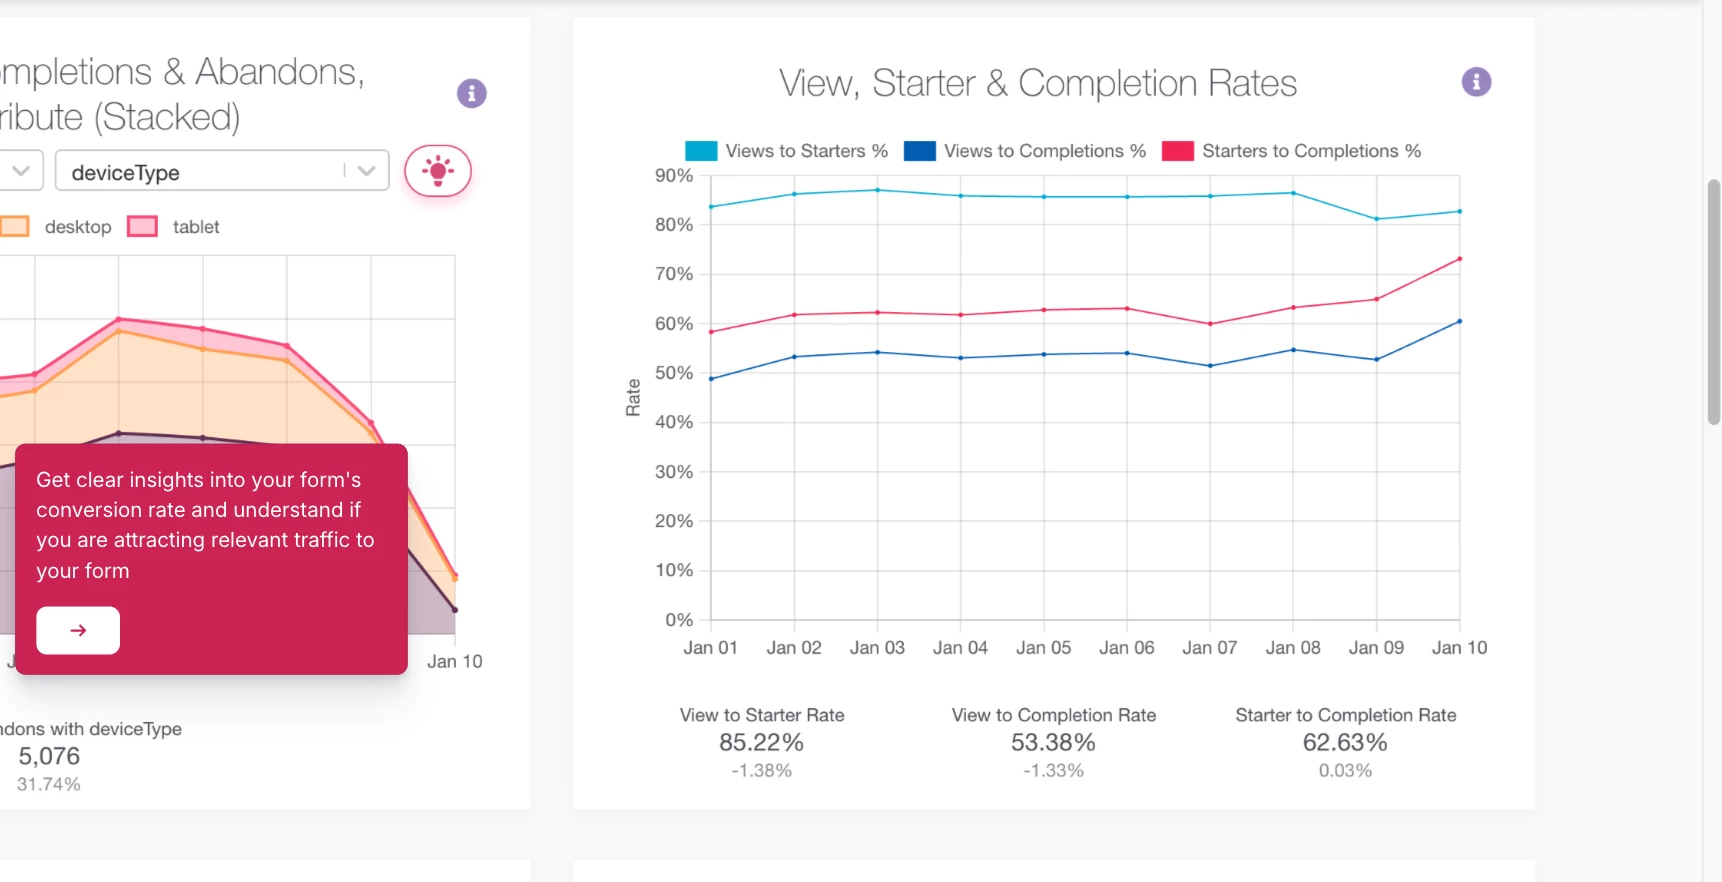
I would use Zuko for one specific problem - users start a form, checkout, quote request, or application, then drop off before completing it.
The platform tracks behavior at the field level, showing where users hesitate, return to fields, trigger errors, or abandon the process. Its newer Agent Score also tests how well forms and checkouts work for AI agents and highlights the points where automated users run into trouble.
Key Features
- Field-level analytics: Tracks starts, completions, abandonments, hesitation, returns, and errors inside forms
- Session Replay: Reconstructs anonymized form journeys to show where users struggle
- Shopify checkout analytics: Tracks step and field drop-off in Shopify checkout flows
- Agent Score: Audits forms and checkouts for AI-agent readiness and flags failure points
- Behavior comparisons: Helps teams compare how converters and abandoners interact with individual fields
Pros
- Gives much deeper form-level insight than general web analytics tools
- Well suited to checkouts, applications, quote forms, and lead-generation flows
- Makes it easier to identify specific fields causing friction
- Adds AI-agent readiness analysis alongside human form behavior
Cons
- Too narrow for general BI reporting
- Less useful for simple, low-stakes contact forms
Pricing
- Up to 5,000 form sessions/month: $70/month
- Up to 10,000 sessions/month: $140/month
- Up to 25,000 sessions/month: $350/month
- Up to 50,000 sessions/month: $700/month
- Enterprise: Custom quote for more than 50,000 sessions/month
- Agent Score: Free basic score; full AI-agent audit and recommendations available separately
Zuko is built for field-level form analysis, so teams that need broader website measurement, GA4 implementation, or attribution may also need a Google Analytics agency.
What Users Say
Users value Zuko for showing what standard analytics tools often miss inside forms and checkouts.
Shopify reviewers say it helps them move past guessing by showing exactly where visitors struggle, turning form behavior into clear insights they can use to fix specific friction points and improve the conversion process.
The main trade-off is scope. Users generally see Zuko as highly effective for form analytics, but not as an all-purpose analytics platform. It is best used alongside broader tools for website analytics, BI, heatmaps, or session replay when teams need context beyond the form itself.
5. Hex: Best for Collaborative Analytics Workflows
For data teams that want SQL, Python, AI-assisted analysis, and business self-service in the same workspace.
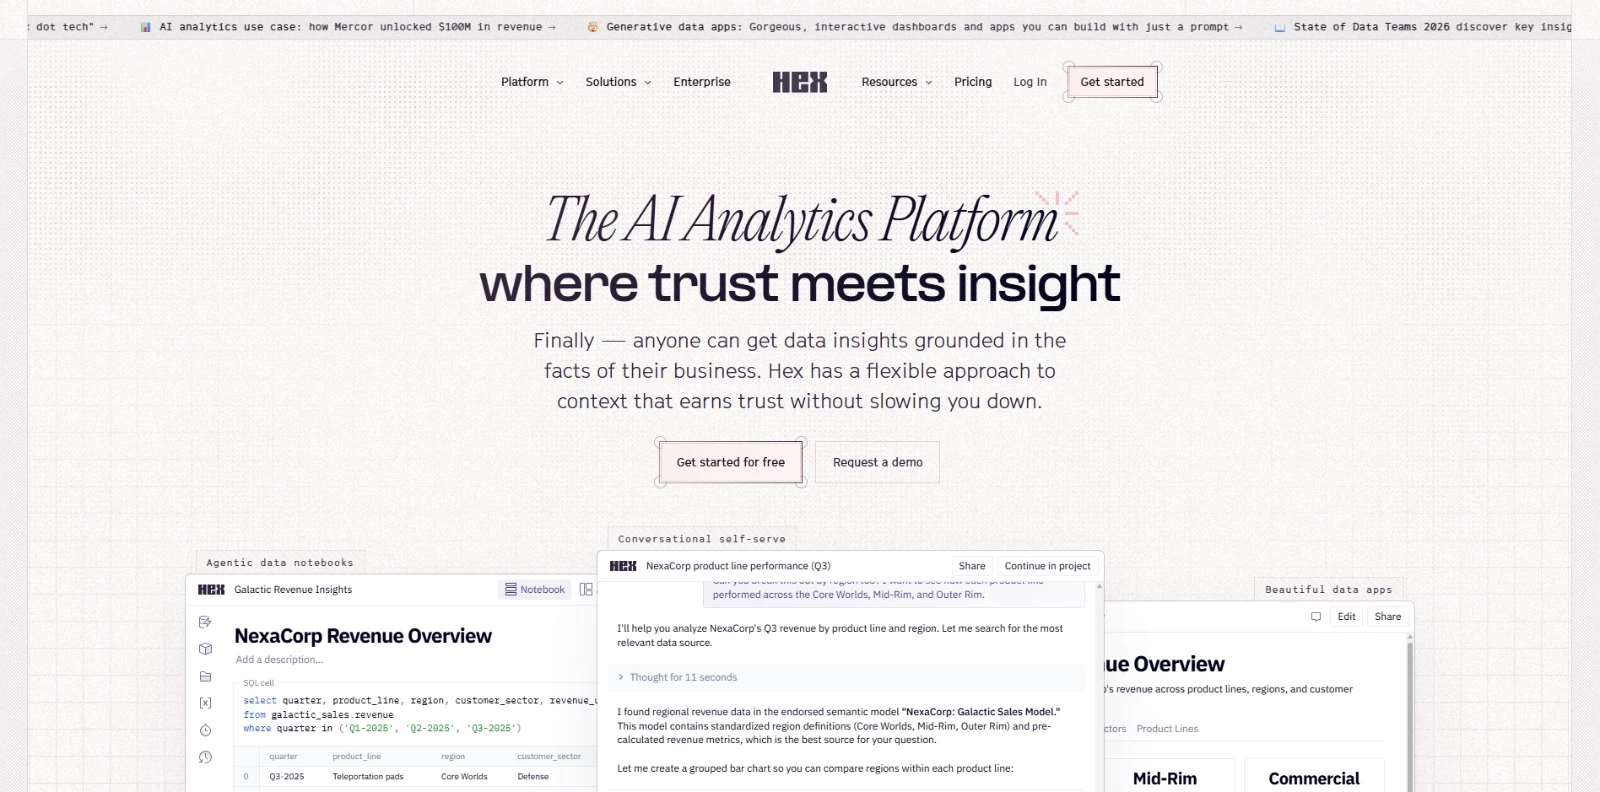
Hex gives analysts and business users different ways to work with the same company data.
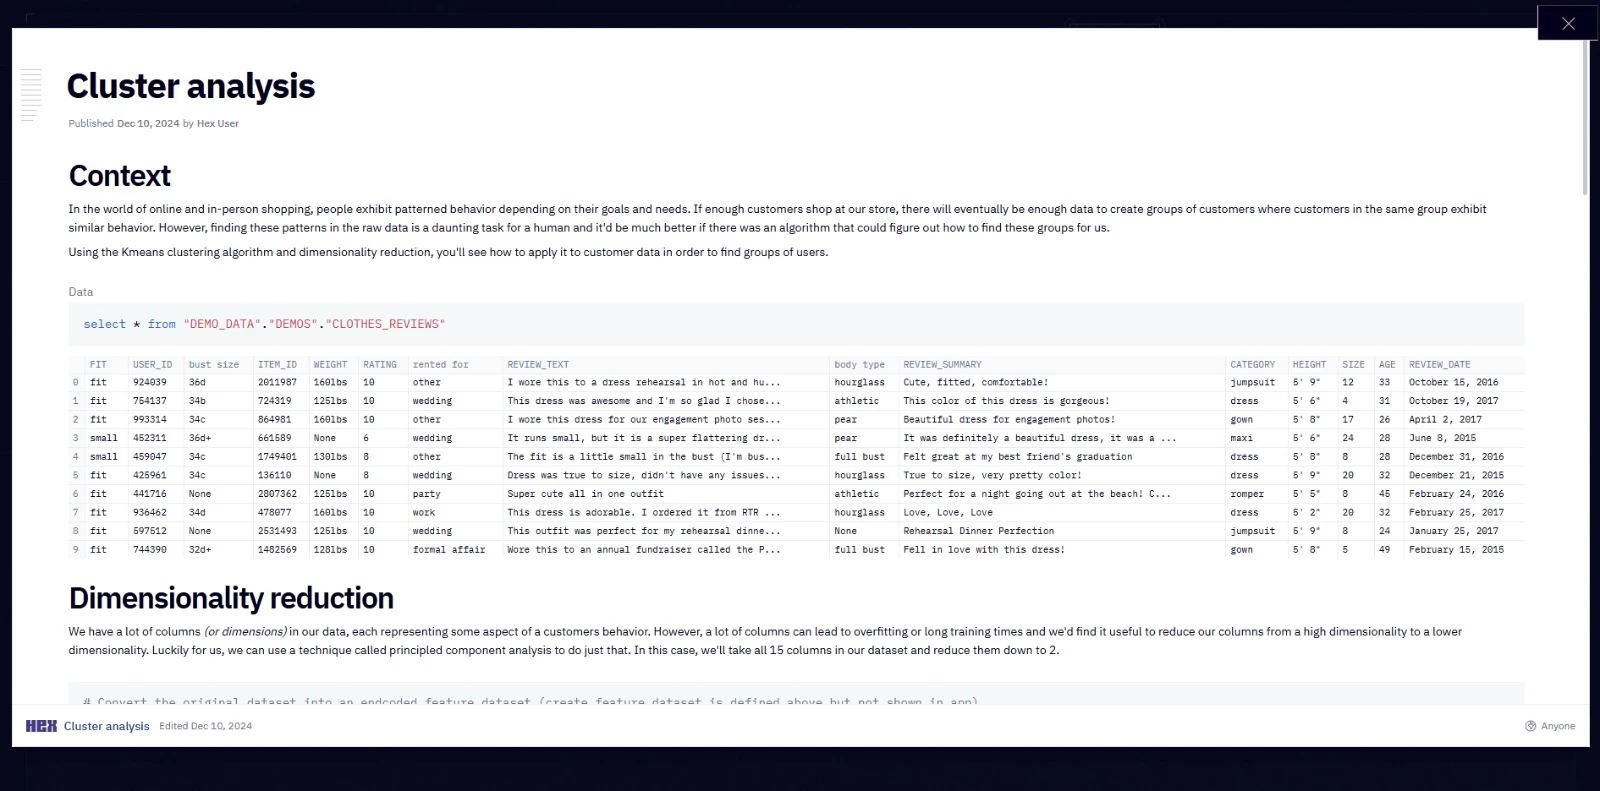
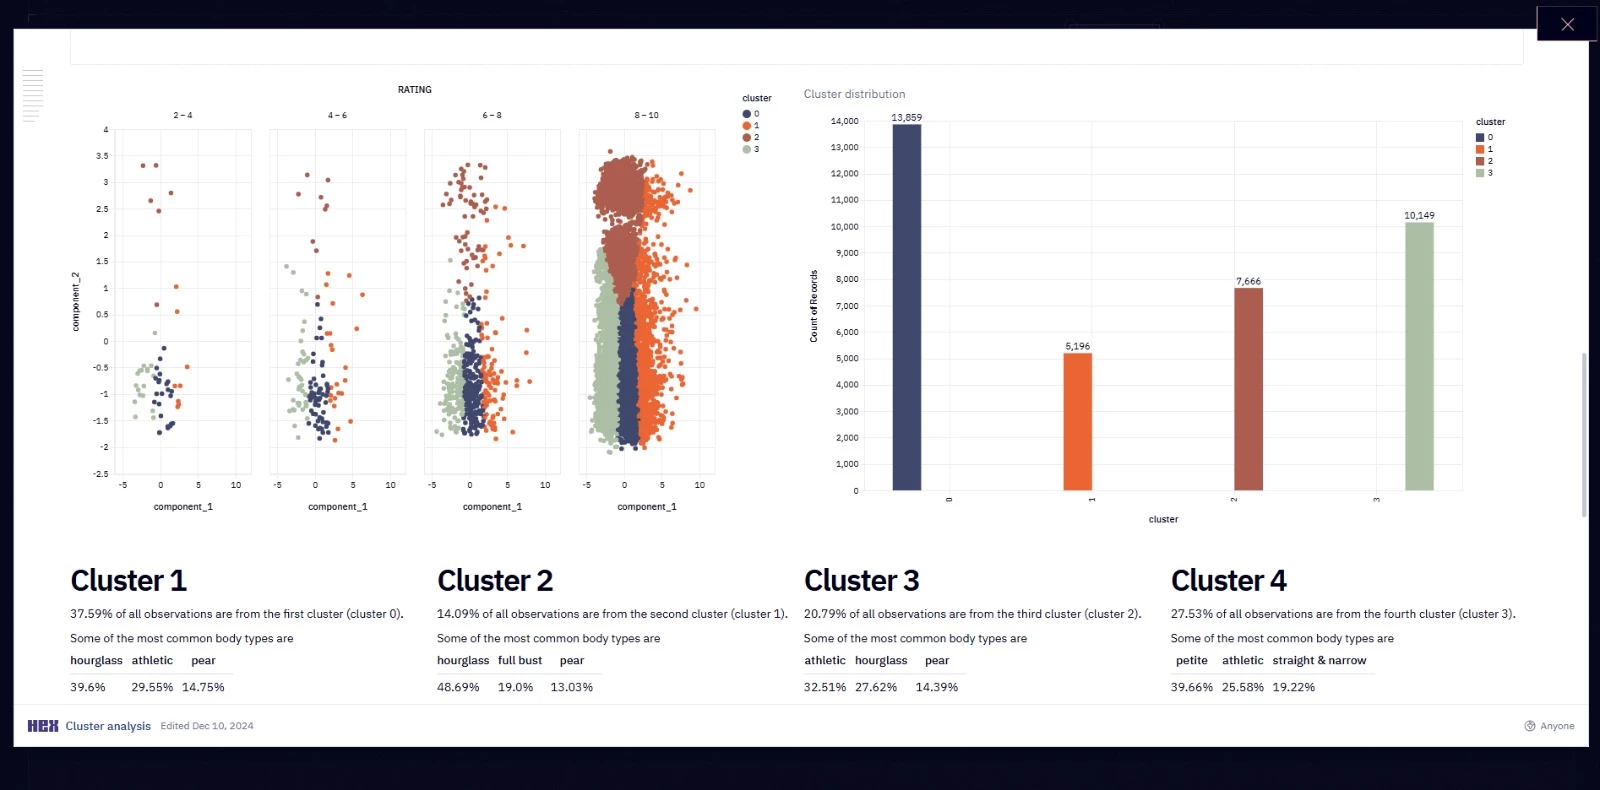
Data practitioners can run deeper analysis in collaborative notebooks, whereas nontechnical users can ask questions in plain language through its conversational analytics tools.
Its AI features are grounded in a shared business context via semantic models, helping teams keep metric definitions and answers consistent as more people use AI to explore data.
Key Features
- Notebook Agent: Assists with deeper analysis inside notebooks using SQL, Python, and connected business data
- Conversational self-service: Lets business users ask data questions in plain language
- Context Studio: Manages semantic models, business context, and AI-agent governance
- Data apps: Turns analyses into interactive dashboards and reports that can be shared with other teams
- Data integrations: Connects with Snowflake, BigQuery, Databricks, Redshift, dbt, and other tools in the data stack
Pros
- Supports SQL, Python, AI agents, and no-code data questions in one platform
- Good fit for collaboration between analysts and business teams
- Connects directly to major cloud warehouses and data tools
- Semantic models help keep AI-generated answers grounded in shared business definitions
Cons
- Some users report slower performance with larger datasets
- Users also mention limitations in certain visualization and customization options
Pricing
- Community: Free
- Professional: $36/editor/month
- Team: $75/editor/month, with a 14-day free trial
- Enterprise: Custom pricing
What Users Say
G2 users frequently praise Hex for its ease of use, SQL and Python capabilities, and flexible approach to data analysis. Reported drawbacks include slower performance with larger datasets and gaps in some advanced features.
6. Databricks: Best for Enterprise Big Data AI Analytics
For enterprise teams that need self-service analytics across large, governed lakehouse data.
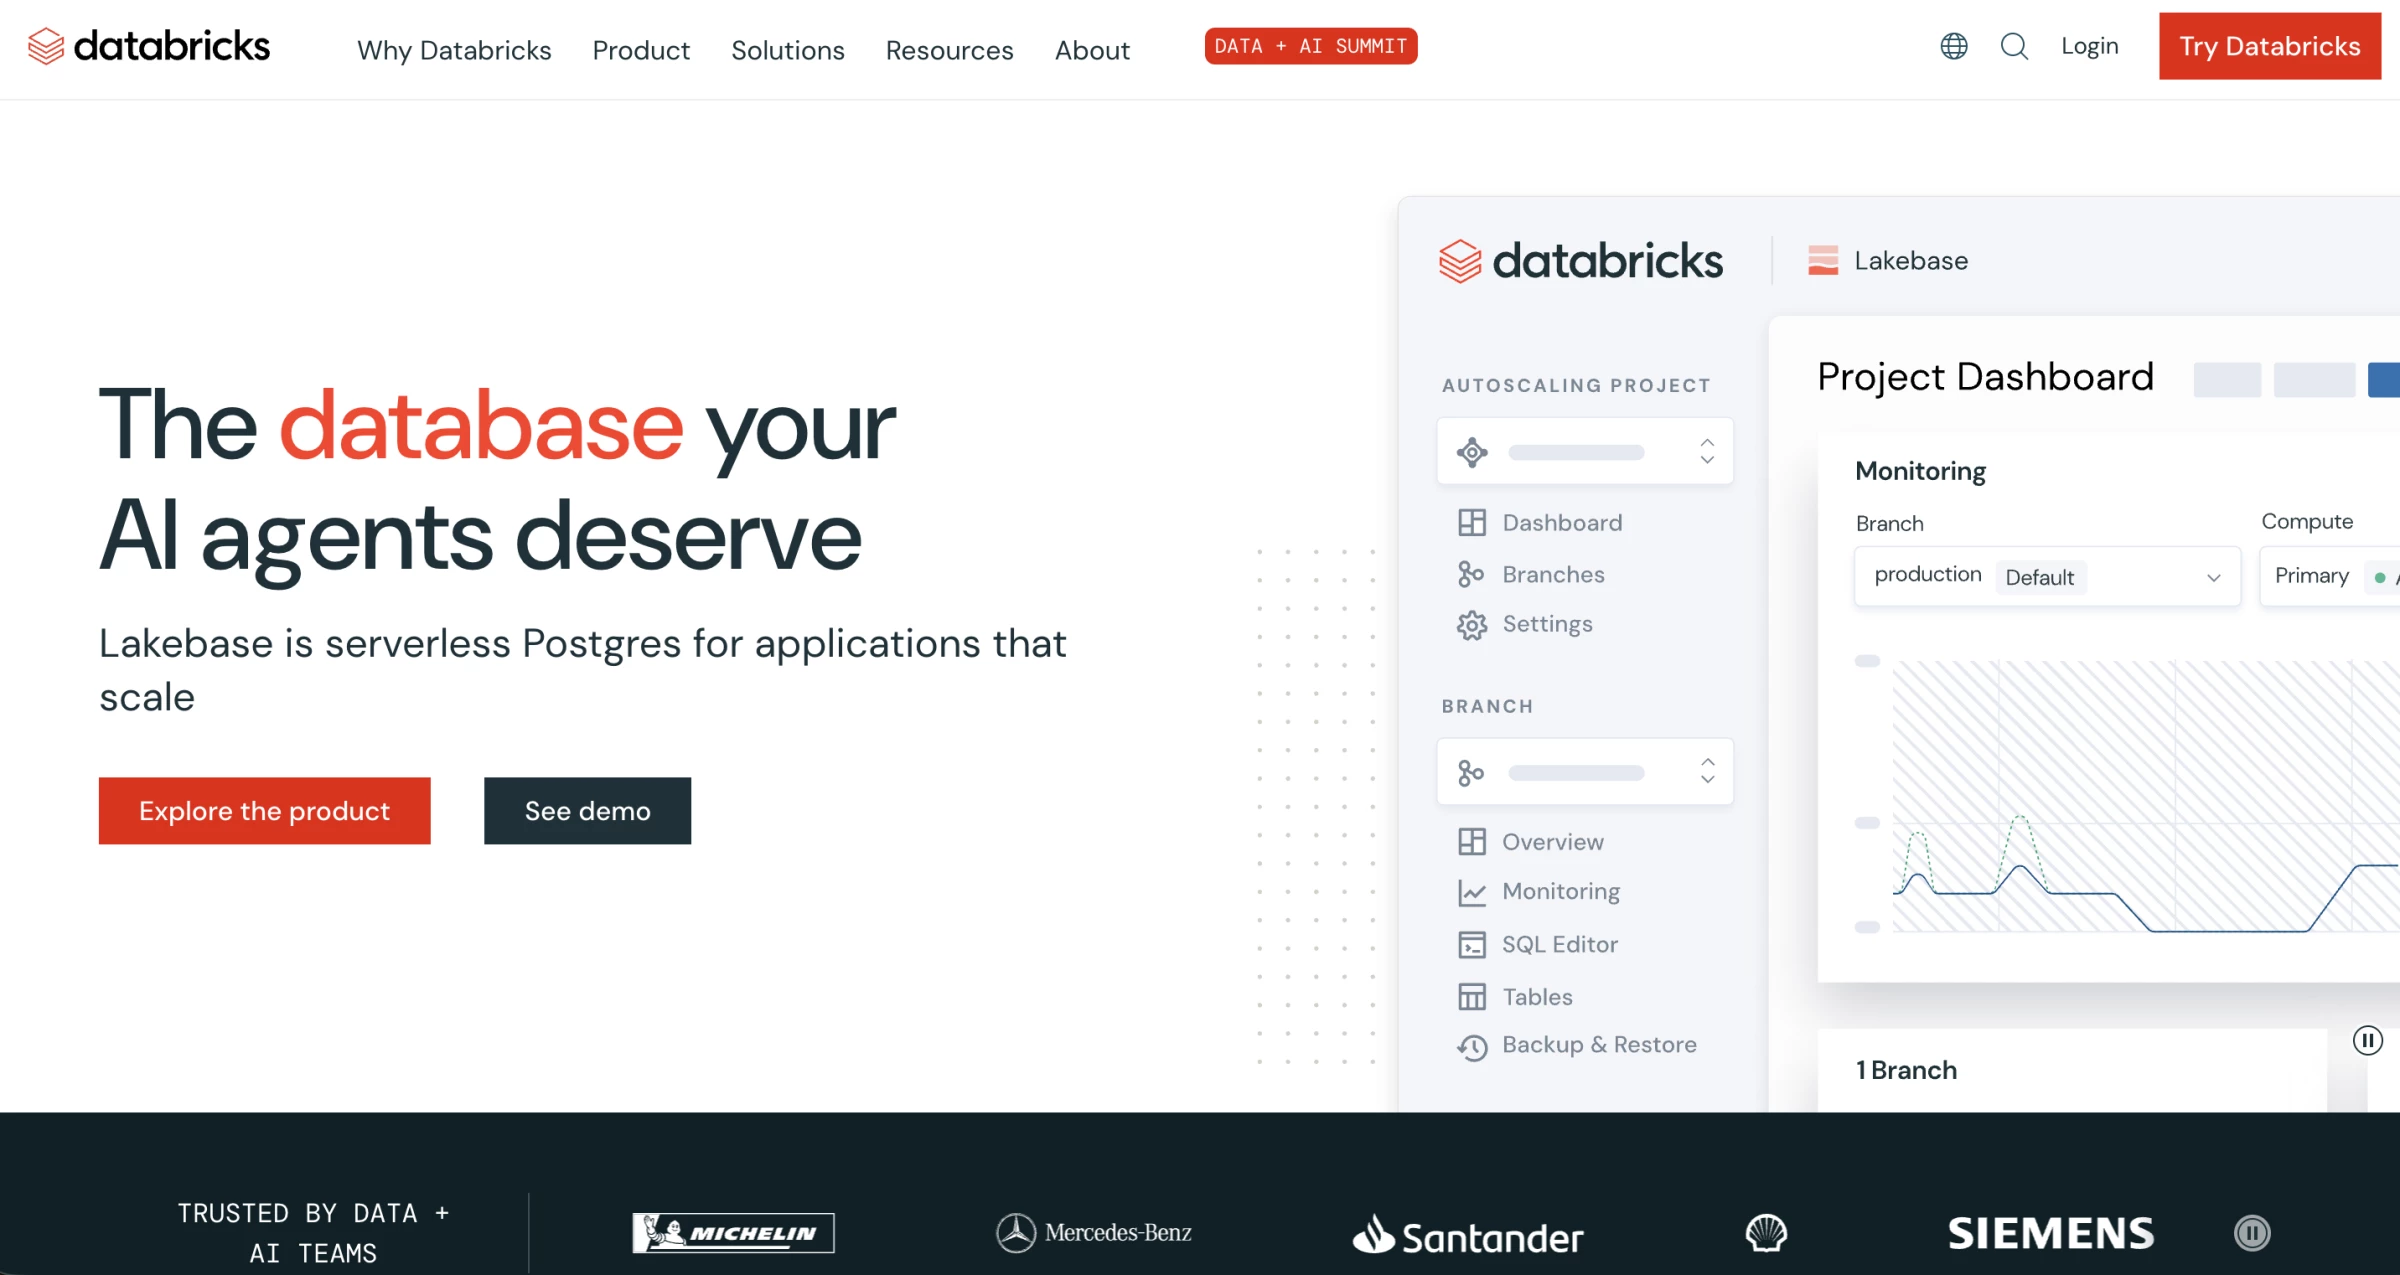
Databricks is a good fit for companies that already manage large datasets in its lakehouse environment and want business users to access that data without relying on SQL or analyst requests for every question.
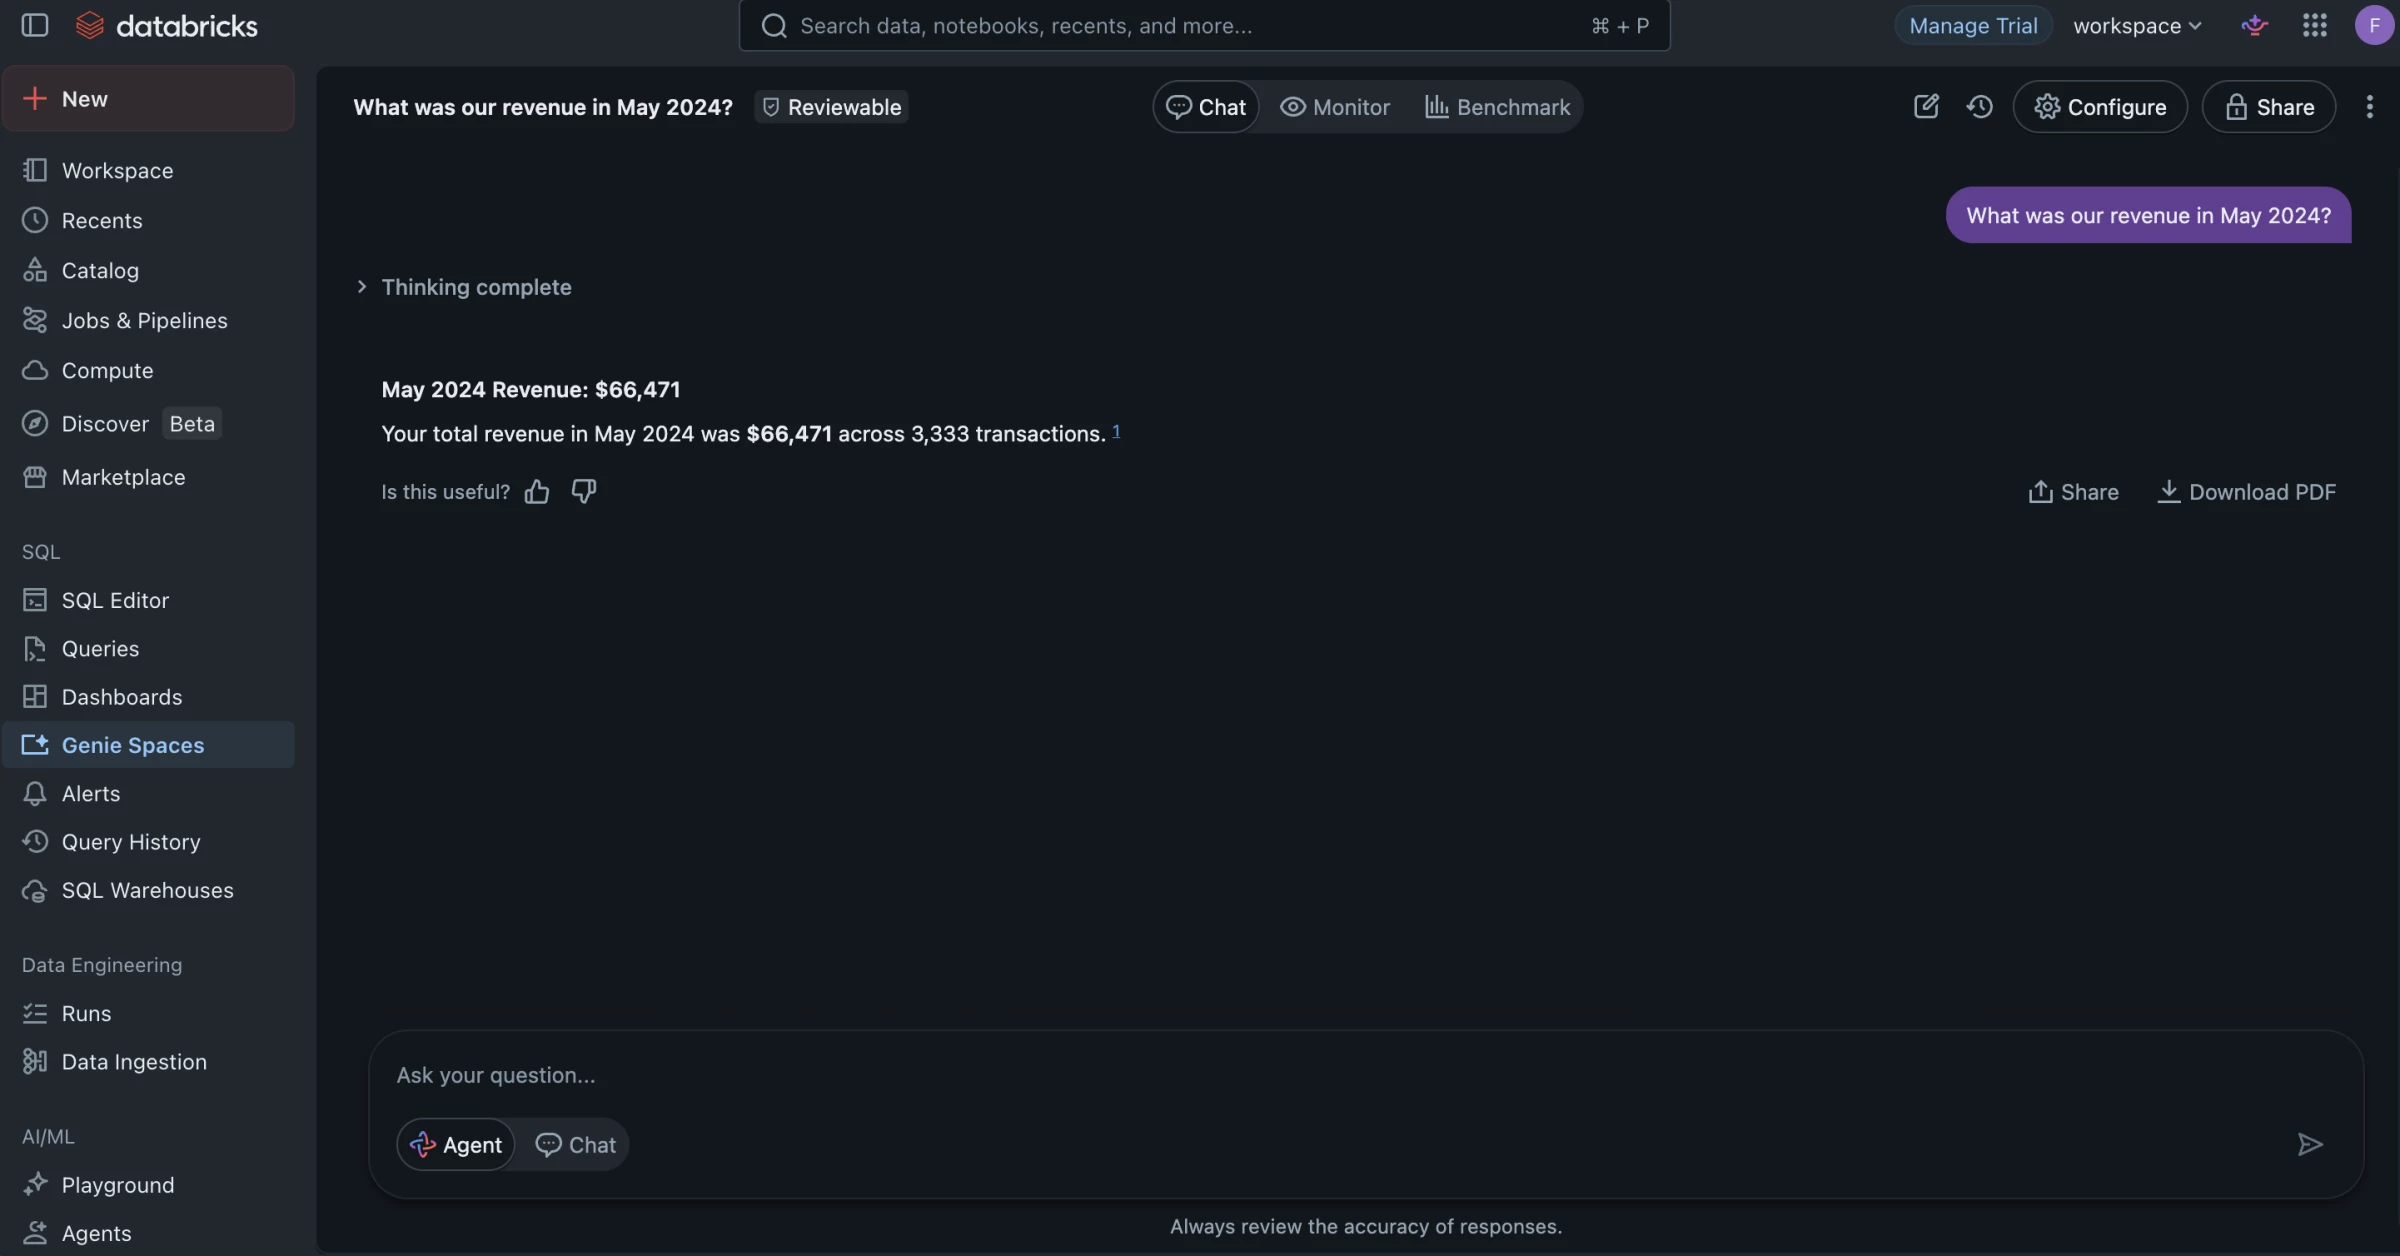
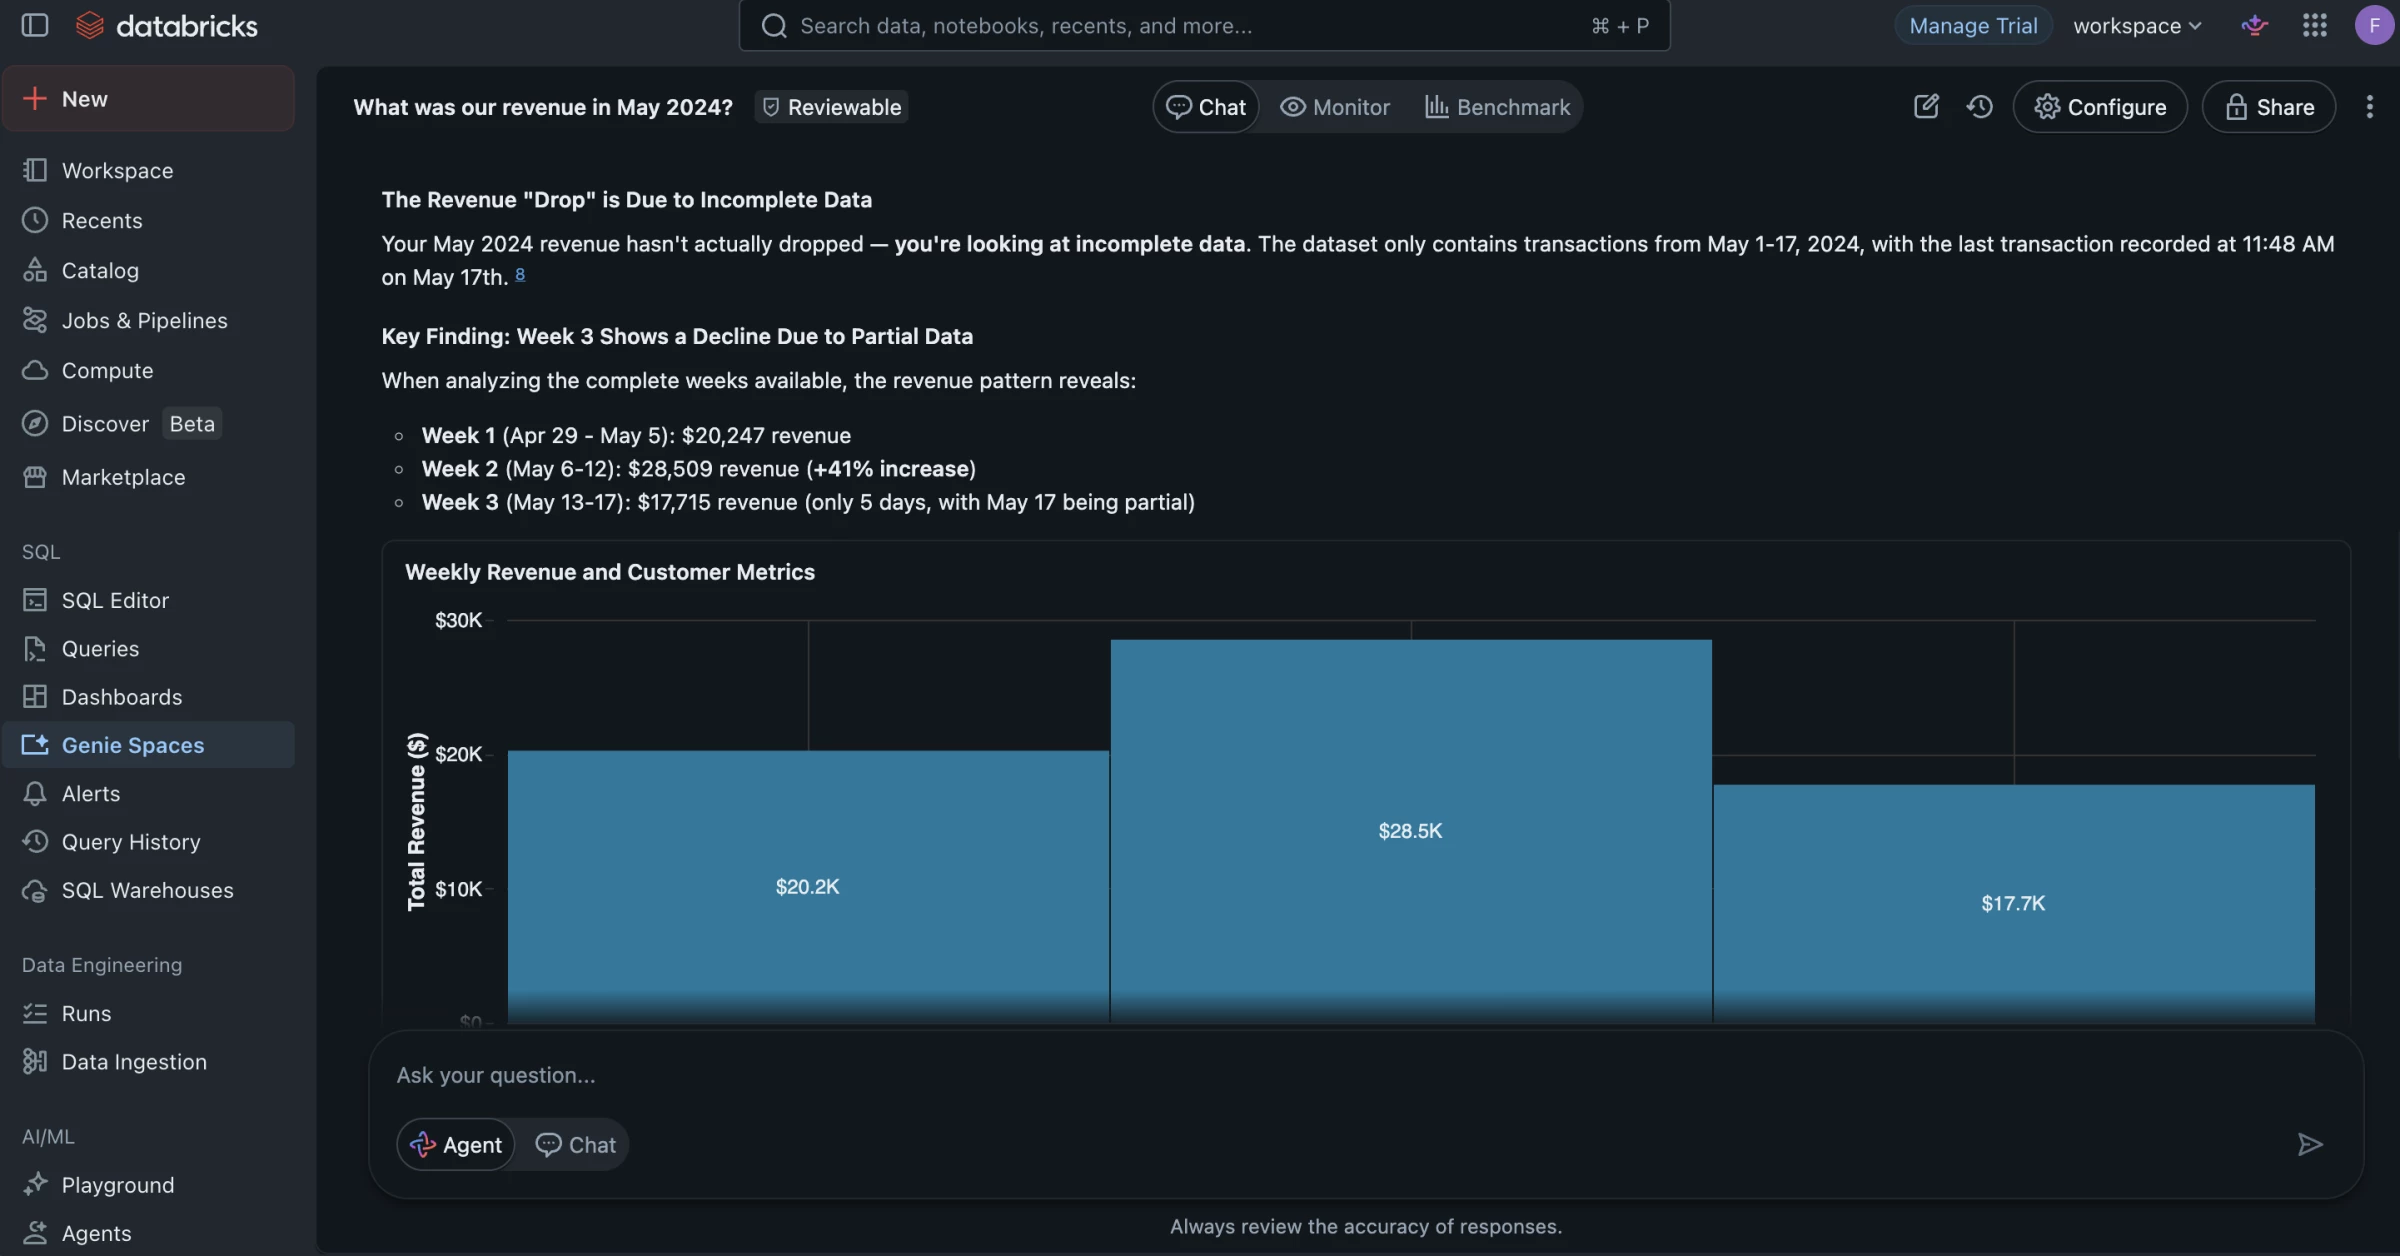
Its newer Genie One experience gives business users one place to ask questions, explore governed insights, and take action using company data and context. Under the hood, Genie Agents can be created for specific analytics use cases, while Unity Catalog keeps access controls and business definitions consistent.
Key Features
- Genie One: Gives business users natural-language access to governed enterprise data and knowledge
- Genie Agents: Provide conversational analytics for specific business use cases
- Genie Ontology: Builds a knowledge graph of business terms, entities, and KPIs to ground answers
- AI/BI Dashboards: Create governed dashboards and visualizations for business users
- Unity Catalog: Manages permissions, governance, and shared business definitions
Pros
- Well suited to large, complex enterprise datasets
- Gives nontechnical users natural-language access to governed data
- Works with structured data and unstructured company knowledge
- Keeps AI analytics, dashboards, governance, and business context in one environment
Cons
- Makes the most sense for organizations already using Databricks
- Requires a well-prepared data environment and clearly defined business context
Pricing
- Genie: Starts at $0.07/DBU beyond free usage
- Data Warehousing: Starts at $0.22/DBU
- Data Engineering: Starts at $0.15/DBU
- AI workloads: Start at $0.07/DBU
- Pay as you go: No upfront commitment; billed according to usage
- Committed Use Contracts: Discounts available for higher usage commitments
- Free trial: Available for the Databricks Data + AI Platform; some trials may include usage credits
What Users Say
Users generally rate Databricks highly for handling large analytics, ML, and data engineering workloads, especially when teams need one place for analytics, machine learning, data engineering, and governance.
The trade-off is that Databricks is not a simple plug-and-play analytics tool. Reviews on Capterra describe it as powerful for data science and machine learning, but better suited to users with technical skills.
7. Snowflake Cortex AI: Best for Governed Enterprise Data
For companies that already use Snowflake and want conversational analytics, AI agents, and unstructured data analysis close to their governed enterprise data.
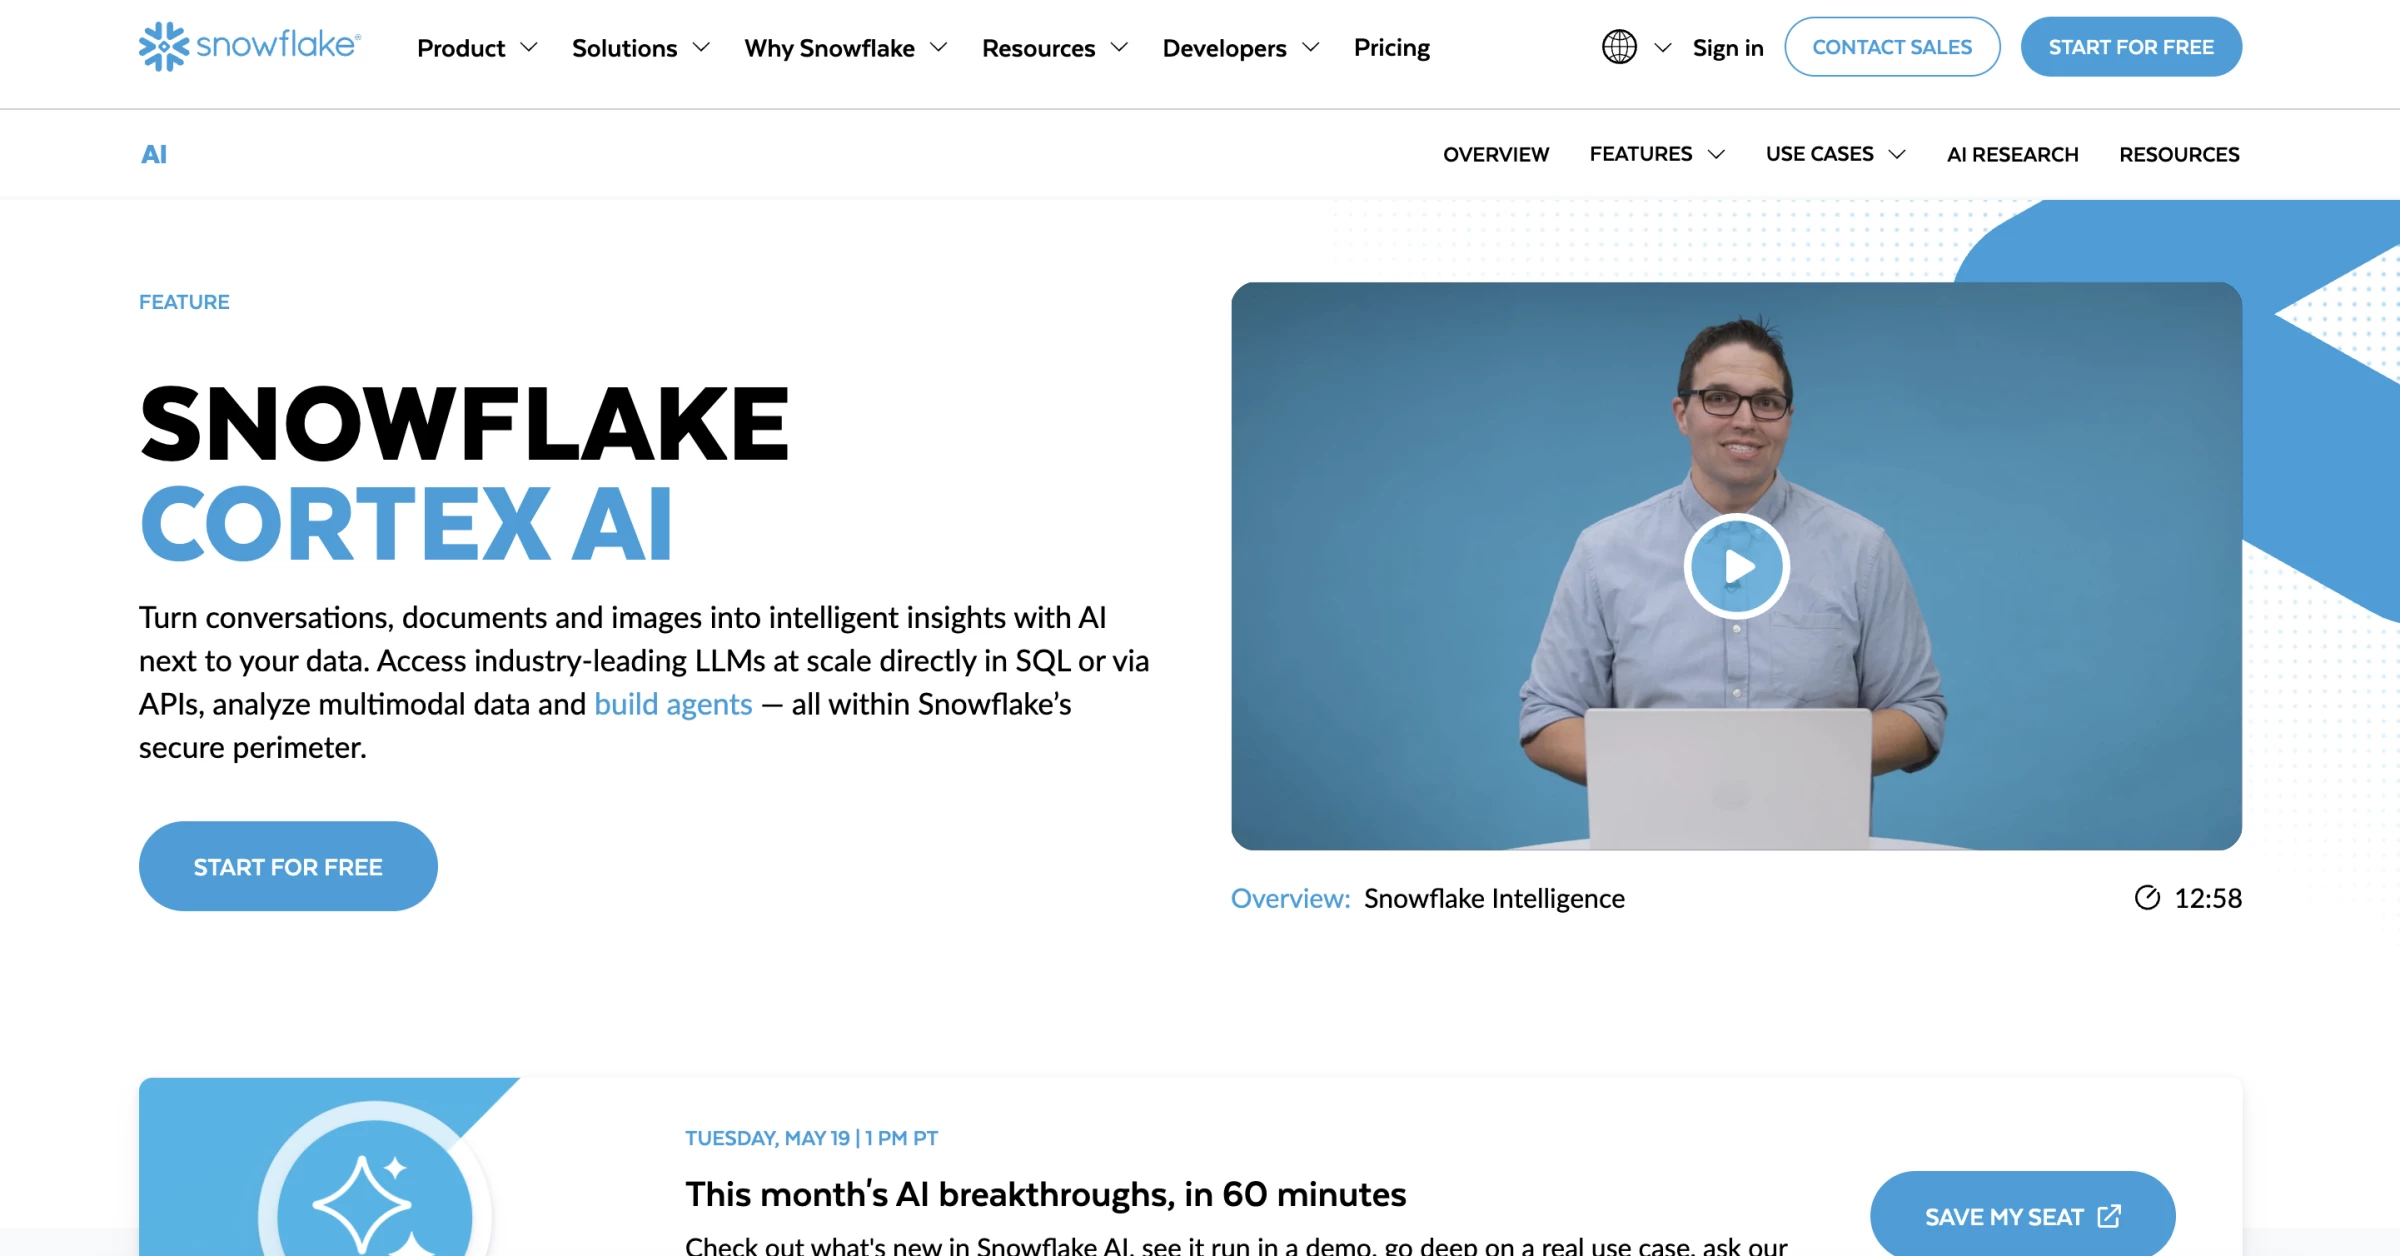
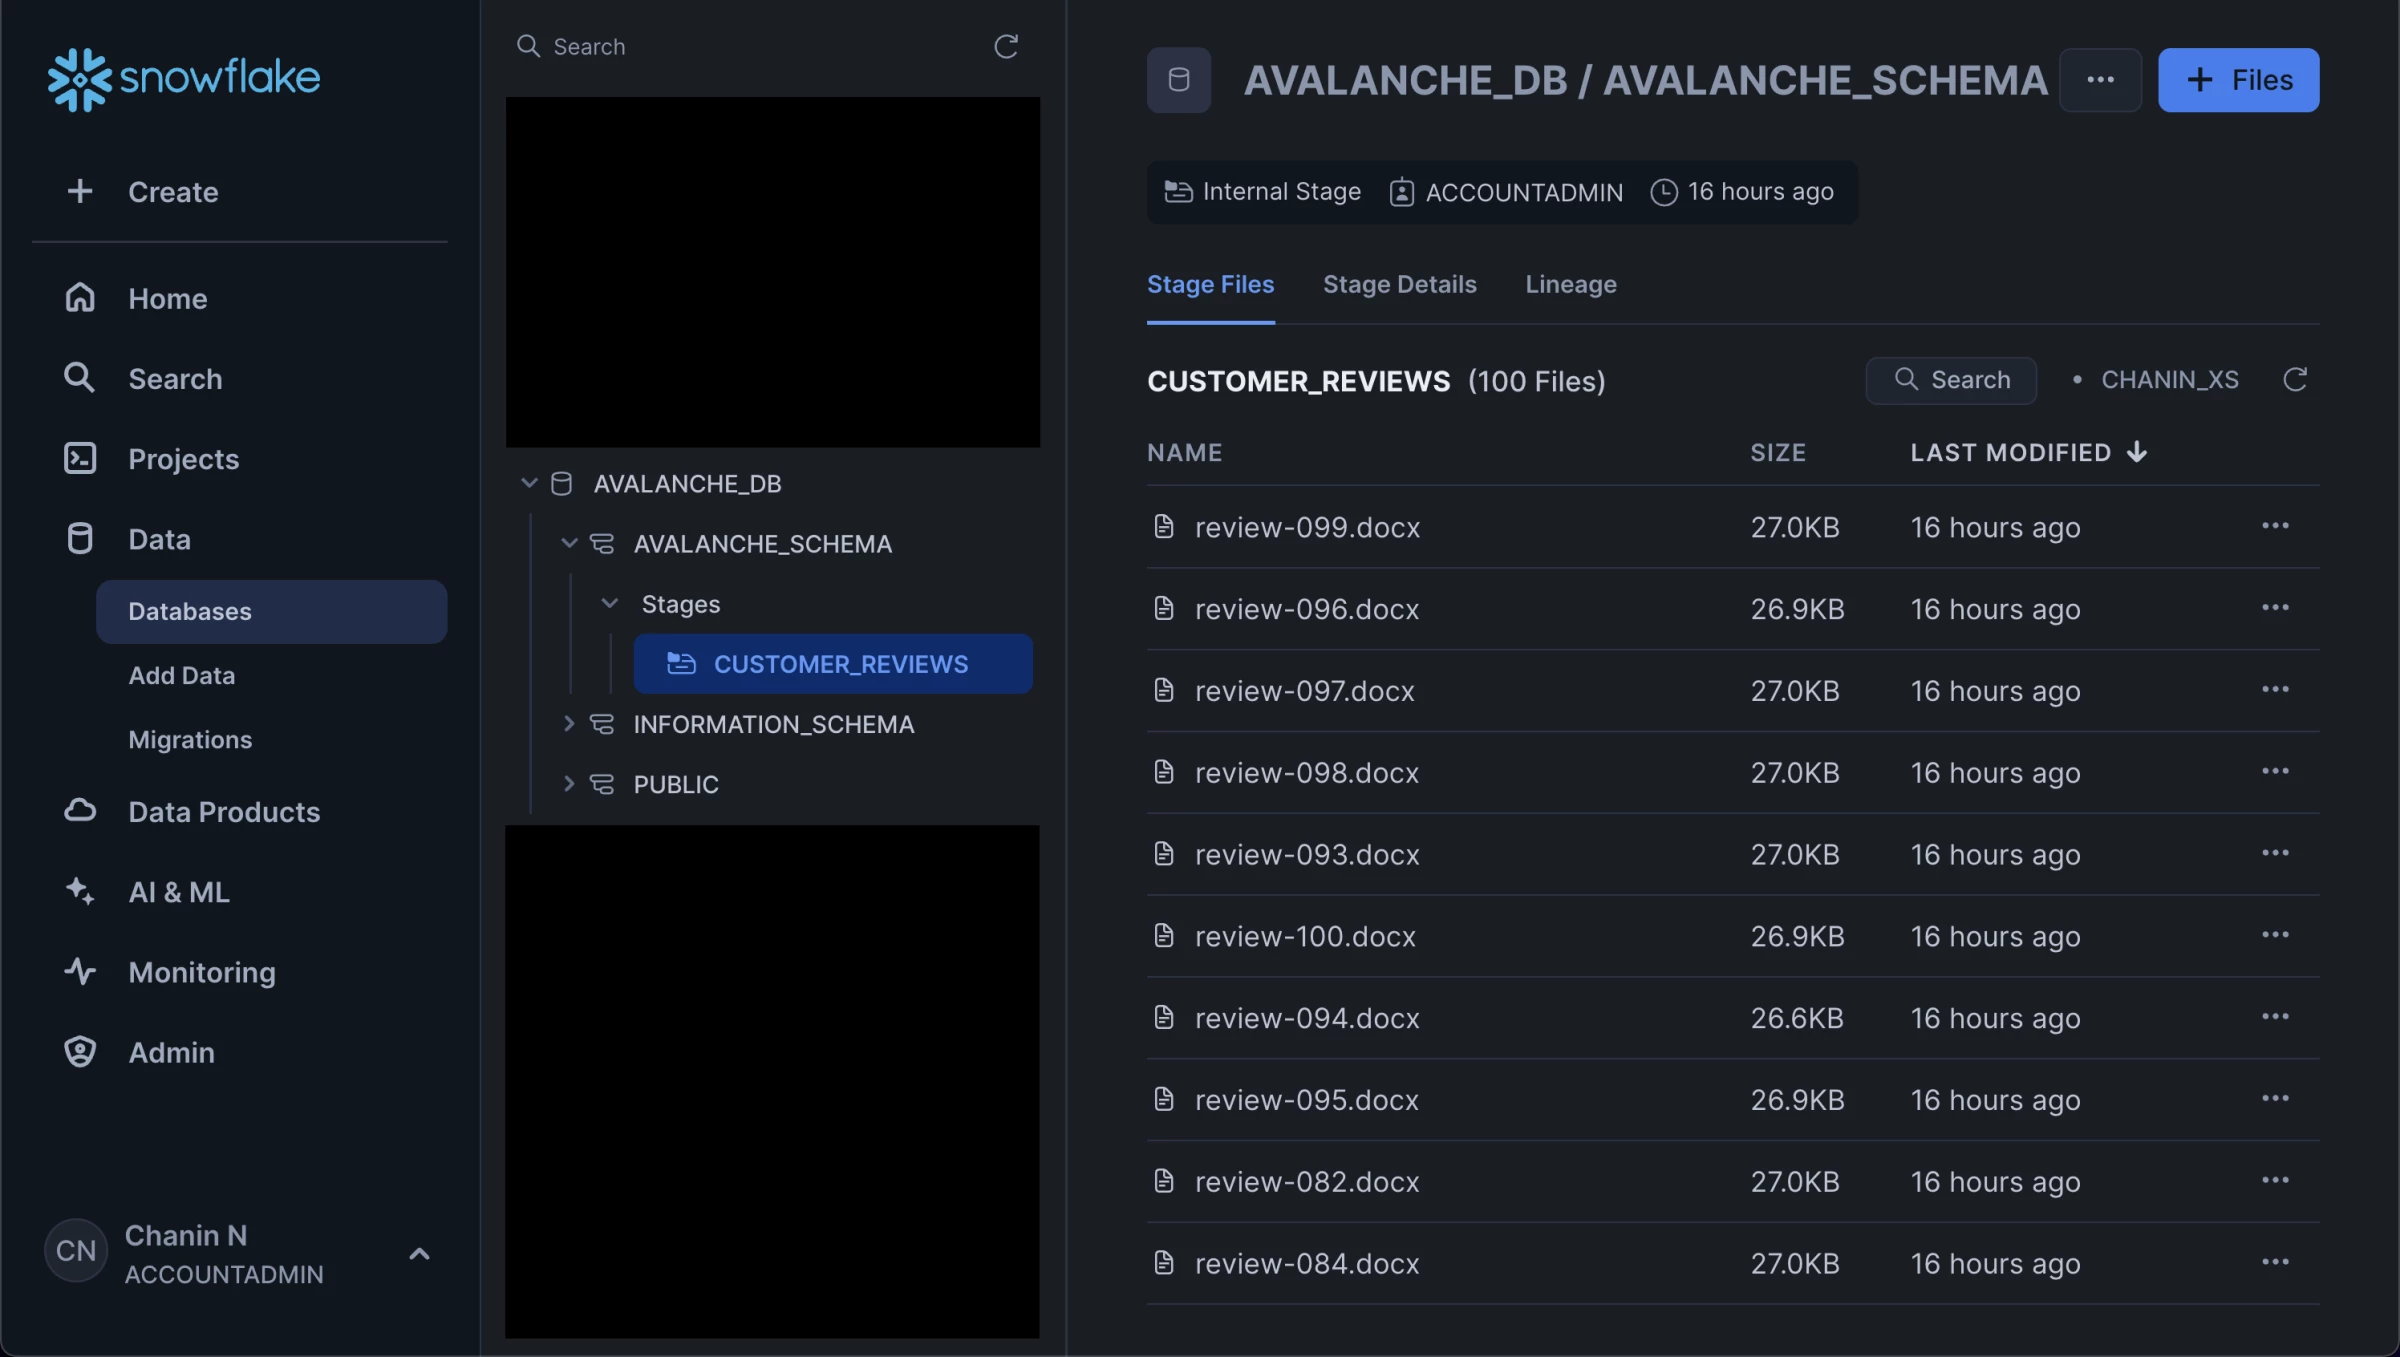
Snowflake Cortex AI makes the most sense when your business data already lives in Snowflake, and you want to add AI without building a separate data layer around it.
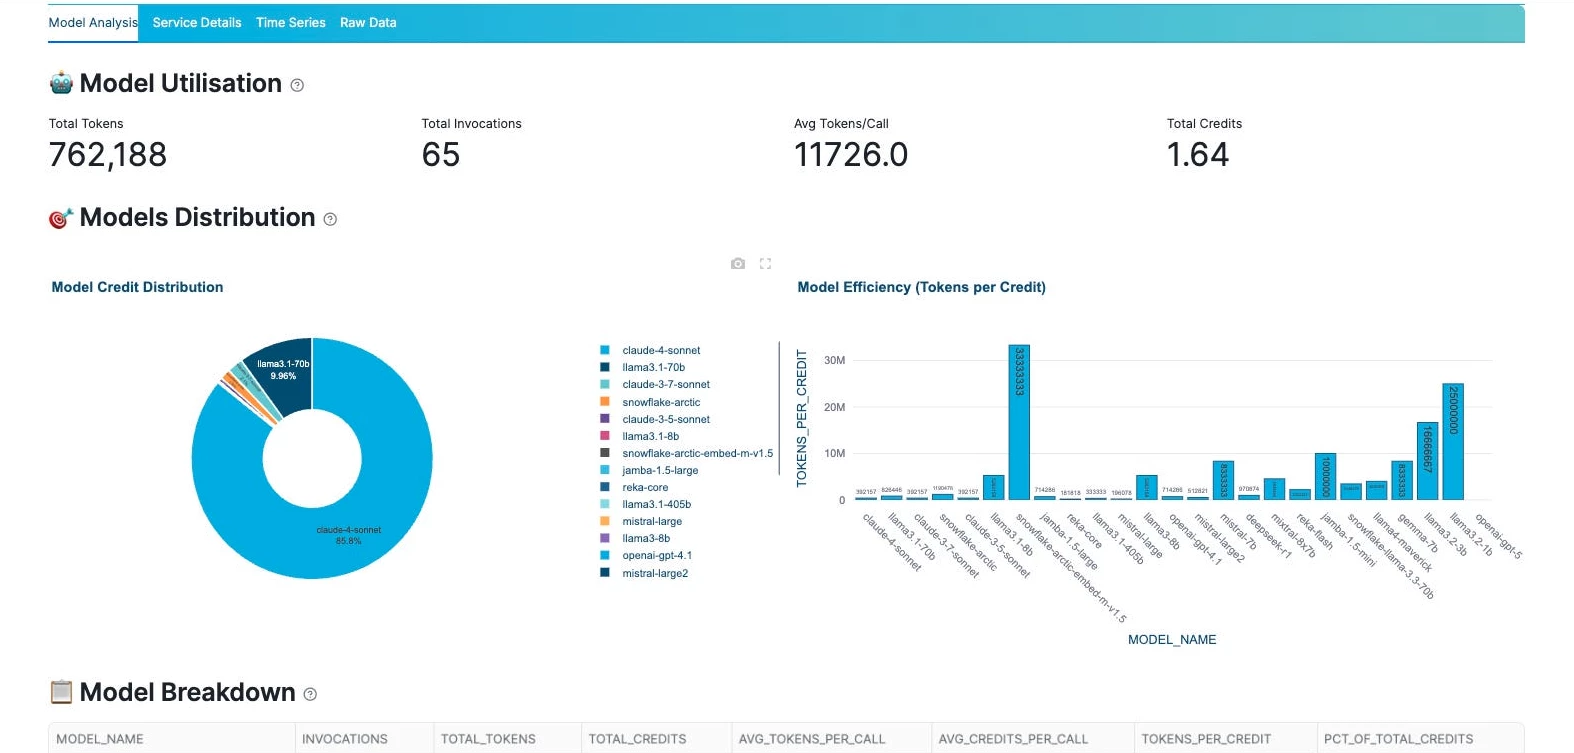
Its capabilities stretch well past basic text-to-SQL. Business users can explore enterprise data in a conversational way through Snowflake Intelligence, while data teams can use Cortex Agents, Cortex AI Functions, Analyst, and Search to build governed analytics and AI workflows.
Key Features
- Snowflake Intelligence: Lets business users ask natural-language questions across structured and unstructured enterprise data
- Cortex Agents: Orchestrate analytics, retrieval, tools, and multistep AI workflows inside Snowflake
- Cortex Analyst: Answers natural-language questions about structured data without requiring users to write SQL
- Cortex AI Functions: Analyze and transform text, images, audio, and other unstructured data using SQL
- Cortex Search: Provides semantic retrieval for RAG, enterprise search, and agent workflows
Pros
- Keeps AI analytics close to data already governed in Snowflake
- Handles both structured and unstructured enterprise information
- Supports business-user Q&A as well as custom AI agents and applications
- Uses existing Snowflake permissions and governance controls
Cons
- Offers the most value to companies already invested in Snowflake
- Building and governing advanced workflows still requires data or engineering expertise
Pricing
- Standard: $2/per credit
- Enterprise: $3/per credit
- Business Critical: $4/per credit
- Virtual Private Snowflake: Talk to sales
What Users Say
Users generally like Snowflake for handling large-scale data work without feeling slow or fragile.
Reviews often point to performance, scalability, and reliability as the main strengths, especially when Snowflake is used as the backbone for analytics and data operations.
The trade-off users mention is that Snowflake is not usually the final interface for business teams.
Reviewers note that visualization and front-end analytics often require another tool, which matches how I would position Cortex AI: powerful inside the data layer, but usually stronger when paired with a dashboard, app, chatbot, or workflow built on top of it.
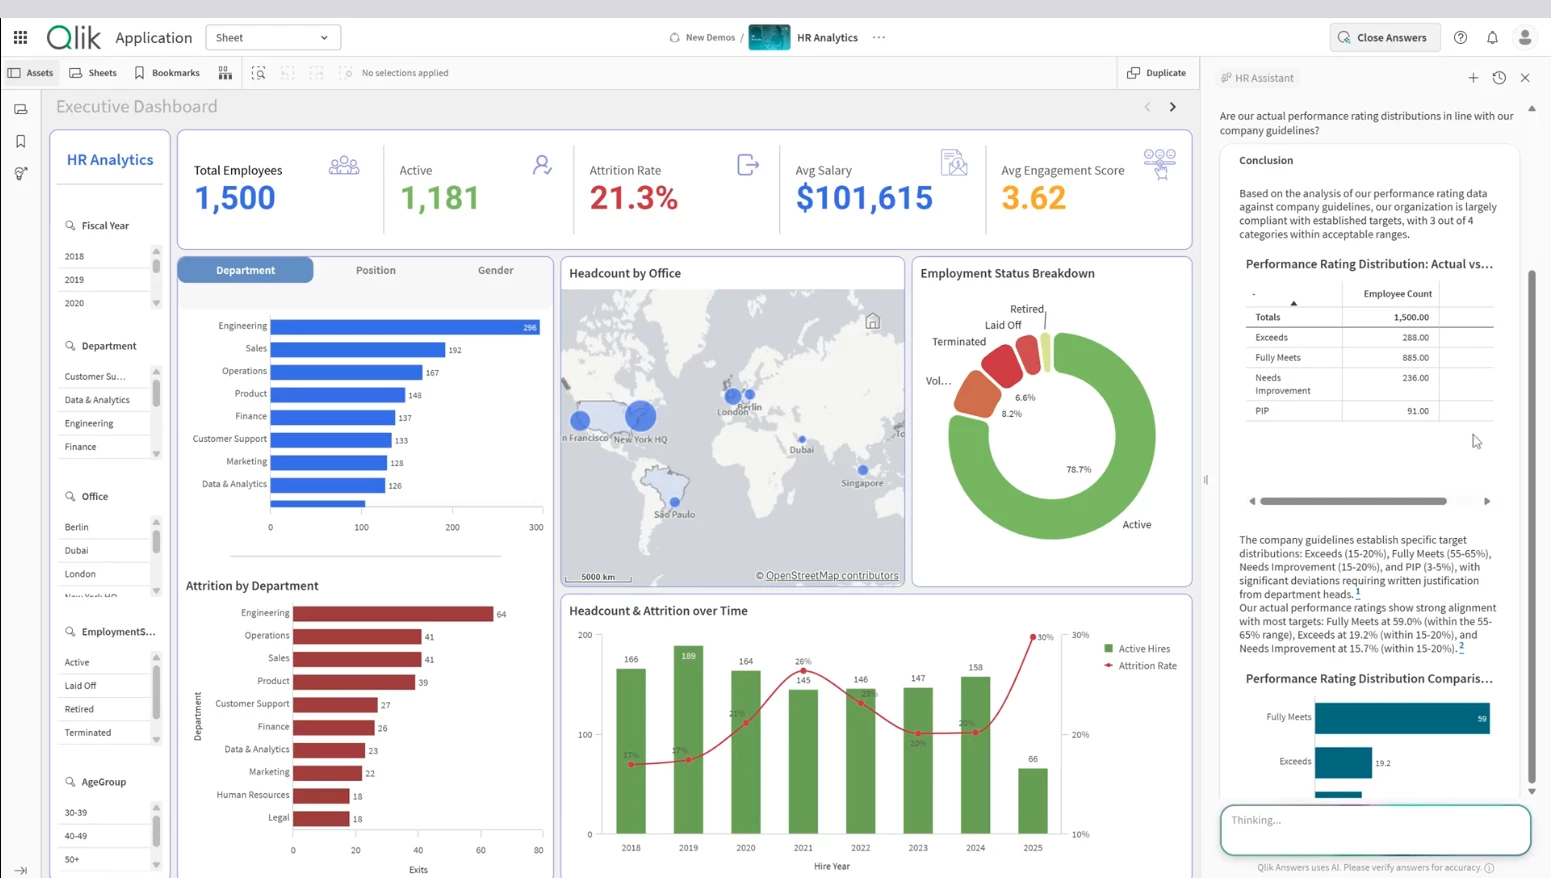
8. Qlik: Best for AI-Assisted Business Intelligence and Predictive Analytics
For companies that need enterprise BI, conversational analytics, and predictive insights within a single governed analytics environment.
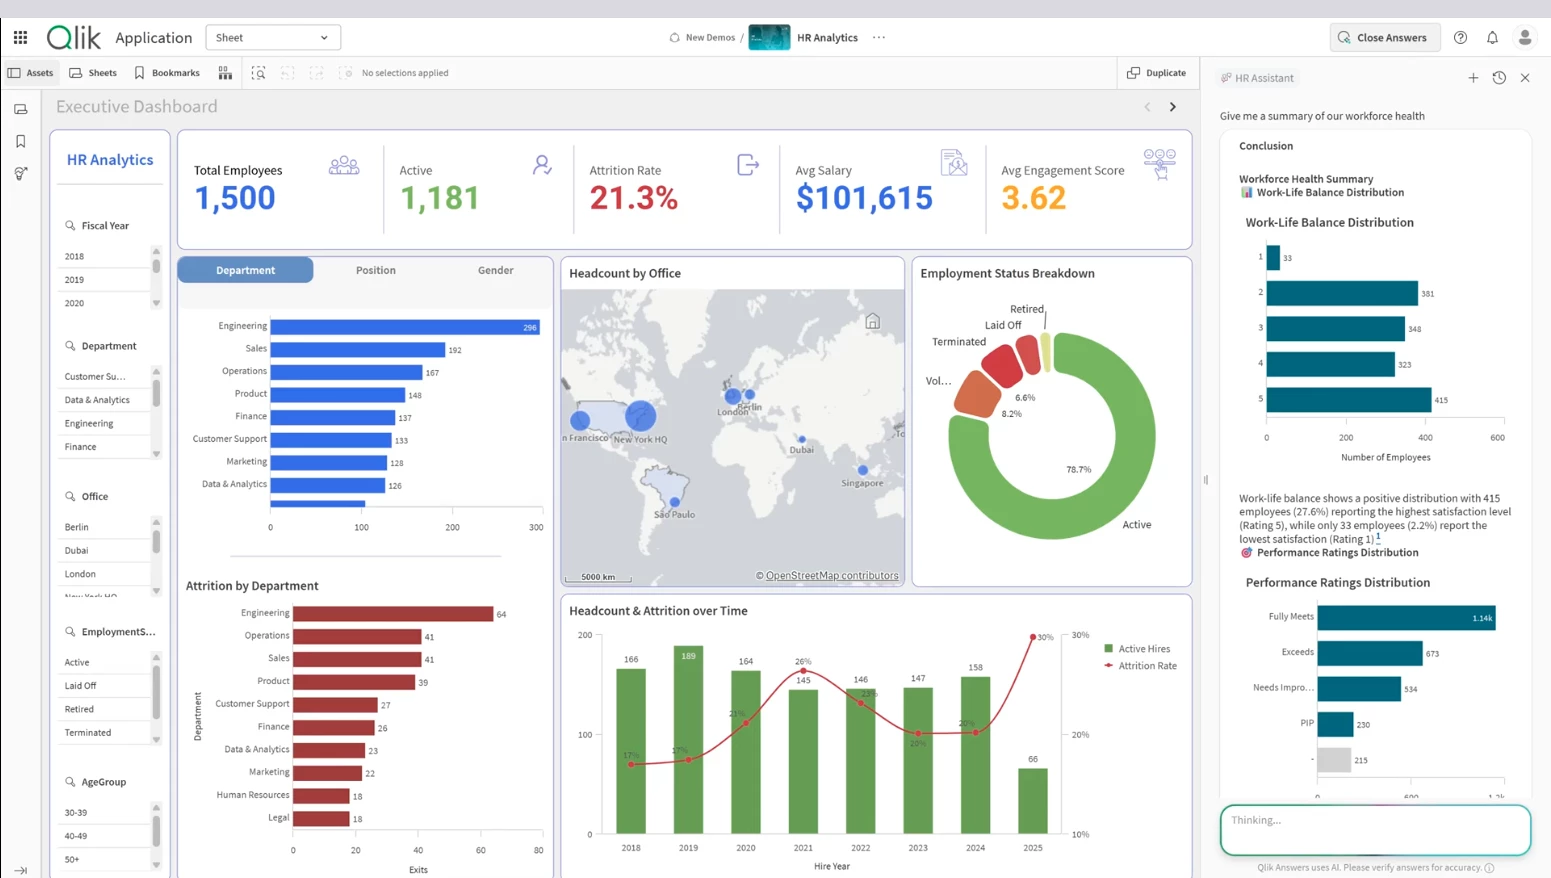
Qlik is a good fit for companies that need to analyze data spread across several business systems and give more people access to the results.
Its newer Qlik Answers experience adds agentic, natural-language analytics on top of Qlik’s BI capabilities, while Qlik Predict handles forecasting and predictive modeling.
That gives teams one environment for dashboards, business questions, deeper exploration, and forward-looking analysis.
Key Features
- Qlik Answers: Lets users ask questions across structured and unstructured business data in natural language
- Discovery Agent: Helps users investigate data, uncover relationships, and move from an initial question into deeper analysis
- Qlik Predict: Supports forecasting, classification, predictive modeling, key-driver analysis, and what-if scenarios
- Associative Engine: Lets users explore relationships in connected datasets without following a fixed drill-down path
- Interactive dashboards: Turn data from multiple systems into shared reports, visualizations, and KPI views
Pros
- Brings data from different business systems into one analytics environment
- Supports conversational, visual, and predictive analysis
- Useful for governed self-service BI
- Predictive tools make it easier to explore likely outcomes and performance drivers
Cons
- Has a learning curve for teams new to enterprise BI
- Getting full value still requires clean data and a properly configured analytics environment
Pricing
- Starter: From $300/month
- Standard: From $825/month
- Premium: From $2,750/month
- Enterprise: Custom pricing
What Users Say
Users often like Qlik because it helps them combine data from different systems and turn it into usable reports.
Reviews commonly point to its strength in connecting multiple data sources, building dashboards, and making complex business data easier to explore.
The main drawback users mention is the learning curve. Qlik can do a lot, but teams usually need time to understand its data model, dashboard logic, and advanced analytics features before they get the full value from it.
9. DataRobot: Best for Predictive AI and Model Governance
For data teams that need to build predictive models, deploy them into production, and monitor them over time.
DataRobot is a good fit when the goal is to predict what happens next rather than just report on past performance.
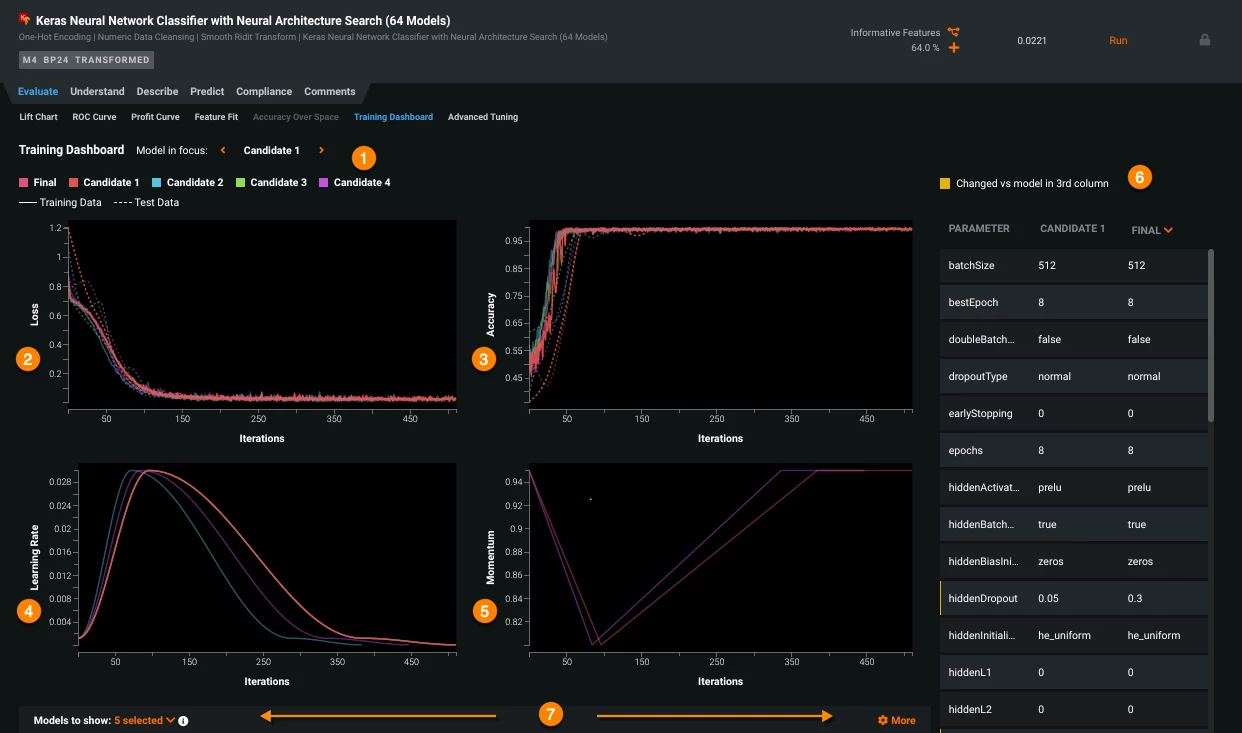
Teams can use historical business data to build models for churn, fraud, demand, risk, forecasting, and other outcomes, then move those models from experimentation into production.
DataRobot started with AutoML but now supports predictive, generative, and agentic AI, covering development, deployment, monitoring, and governance.
Key Features
- Automated machine learning: Helps teams build and compare predictive models with less manual experimentation
- Time series forecasting: Uses historical data to predict future trends, demand, revenue, and other time-dependent outcomes
- Model deployment: Moves trained models into production workflows and applications
- Model monitoring: Tracks deployed models and helps teams identify changes in performance or data over time
- AI governance: Provides lineage, policy controls, and automated compliance documentation for governed AI deployments
Pros
- Covers predictive model development through deployment and monitoring
- Well suited to forecasting, churn, fraud, risk, and similar predictive use cases
- Reduces repetitive work involved in building and comparing models
- Predictive, generative, and agentic AI are available within the same broader platform
Cons
- Needs reliable historical data and a clearly defined business problem
- Better suited to data and AI teams than casual business users
Pricing
- Custom pricing
What Users Say
Users usually describe DataRobot as powerful for teams that need serious machine learning without building every model by hand.
The strongest feedback tends to focus on AutoML, model comparison, faster experimentation, and the ability to make models ready for deployment and monitoring.
The trade-off is that users need a clear use case, reliable data, and people who understand how to interpret model outputs.
It can speed up predictive AI work, but it is not the right tool for teams that only need charts, dashboards, or basic spreadsheet analysis.
AI Data Analysis Tools for Individual Analysts and Small Teams
For lighter analysis work, a simpler AI tool can be faster to set up and easier to use. The options below are designed for tasks such as spreadsheet analysis, file uploads, natural-language questions, charting, and KPI monitoring.
1. Julius AI: Best for Conversational Data Analysis
For individual analysts and small teams that want to explore spreadsheets, files, and connected business data using plain-English questions.
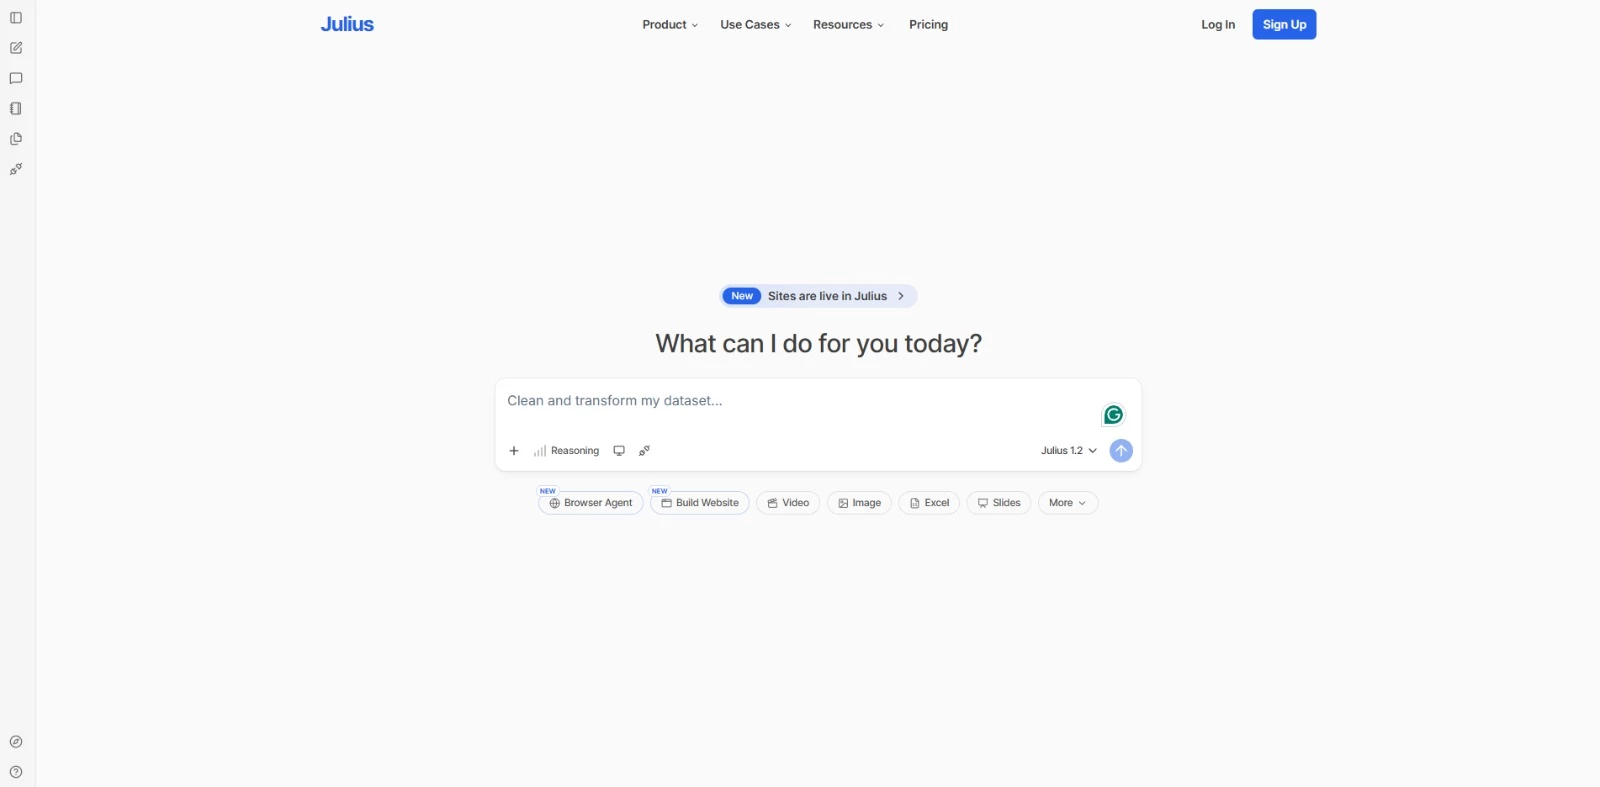
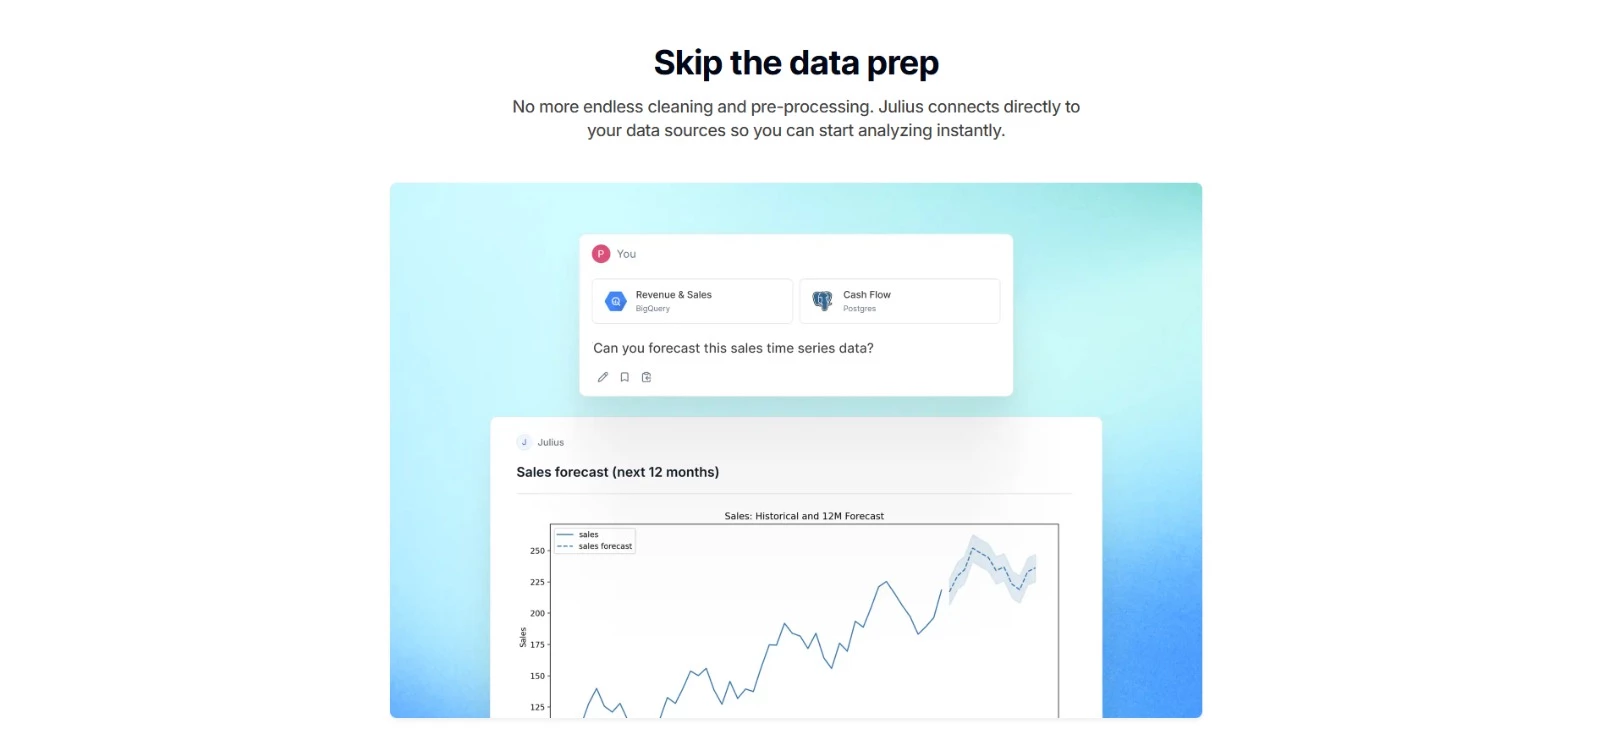
Julius AI makes data analysis feel more like a conversation than a traditional BI workflow. You can upload files or connect data sources, ask questions in plain English, and get charts, summaries, forecasts, and other insights without starting with SQL or formulas.
It also works with live data sources, including Snowflake, BigQuery, PostgreSQL, MySQL, SQL Server, Google Drive, and other integrations, making it useful for both recurring analysis and one-off spreadsheet work.
Key Features
- Conversational data analysis: Lets users question datasets and request follow-up analysis in plain language
- Data connectors: Connects with Snowflake, BigQuery, PostgreSQL, MySQL, SQL Server, Google Drive, and other sources
- Charts and reports: Turns analysis into visualizations, dashboards, and shareable reports
- Notebooks: Organizes repeatable analysis into reusable cells and workflows
- Scheduled reporting: Supports recurring report runs, with expanded automation on higher plans
Pros
- Easy to use without SQL or coding
- Works with uploaded files as well as connected databases and warehouses
- Useful for charts, trend analysis, forecasting, and exploratory questions
- Can turn analysis into reports and dashboards without moving to another tool
Cons
- AI-generated analysis still needs to be checked for errors or misinterpretation
- Advanced team and automation features require higher-priced plans
Pricing
- Free
- Plus: $16/month billed annually
- Pro: $37/month
- Max: $166/month
- Business: $375/month
- Enterprise: Custom pricing
What Users Say
G2 reviewers praise Julius for making data analysis easier and helping users find insights quickly. The review pool is still small, so the feedback is helpful but not yet representative of a large user base.
2. ChatGPT: Best for Flexible File-Based Data Analysis
For users who need to clean, explore, visualize, and interpret uploaded data without setting up a separate analytics platform.
ChatGPT is a flexible option for ad hoc data analysis. You can upload spreadsheets, CSVs, JSON files, PDFs, and other supported formats, then ask it to clean data, compare groups, identify trends and outliers, run calculations, or create charts.
For more complex tasks, ChatGPT can write and run Python for statistical analysis, transformations, and calculations. The conversational format also makes it easy to follow an initial finding with another question without restarting the analysis.
Key Features
- File-based analysis: Works with XLS, XLSX, CSV, JSON, PDFs, and other supported files
- Python analysis: Runs calculations, data transformations, and statistical analysis
- Tables and charts: Creates structured tables, static charts, and supported interactive visualizations
- Conversational exploration: Supports follow-up questions about trends, comparisons, outliers, and results
- Spreadsheet extensions: Works directly in Excel and Google Sheets on supported plans
Pros
- Handles several types of file-based analysis without requiring SQL
- Useful for data cleaning, exploratory analysis, statistics, and visualization
- Makes it easy to keep drilling into a finding through follow-up questions
- Lets users review the Python code and assumptions behind code-backed analysis
- Works well for quick analysis without a separate BI setup
Cons
- Calculations, methods, and assumptions should be checked before using the results for important decisions
- CSV and spreadsheet uploads are limited to roughly 50 MB per file
- Less suited to recurring, governed enterprise BI than dedicated analytics platforms
Pricing
- Free with limited uploads and data analysis
- Go: $8/month in the U.S.; localized pricing may vary
- Plus: $20/month
- Pro: $200/month
- Business: $20/user/month billed annually
- Enterprise: Custom pricing
What Users Say
G2 users frequently highlight ChatGPT’s ease of use and the time it saves on everyday work. A recurring criticism is that answers can sometimes be inaccurate, which matters particularly when using it for calculations or interpreting data.
3. Claude: Best for Exploring and Interpreting Complex Data
For smaller teams that need to explore large files, combine data with supporting documents, and work through more complex questions.
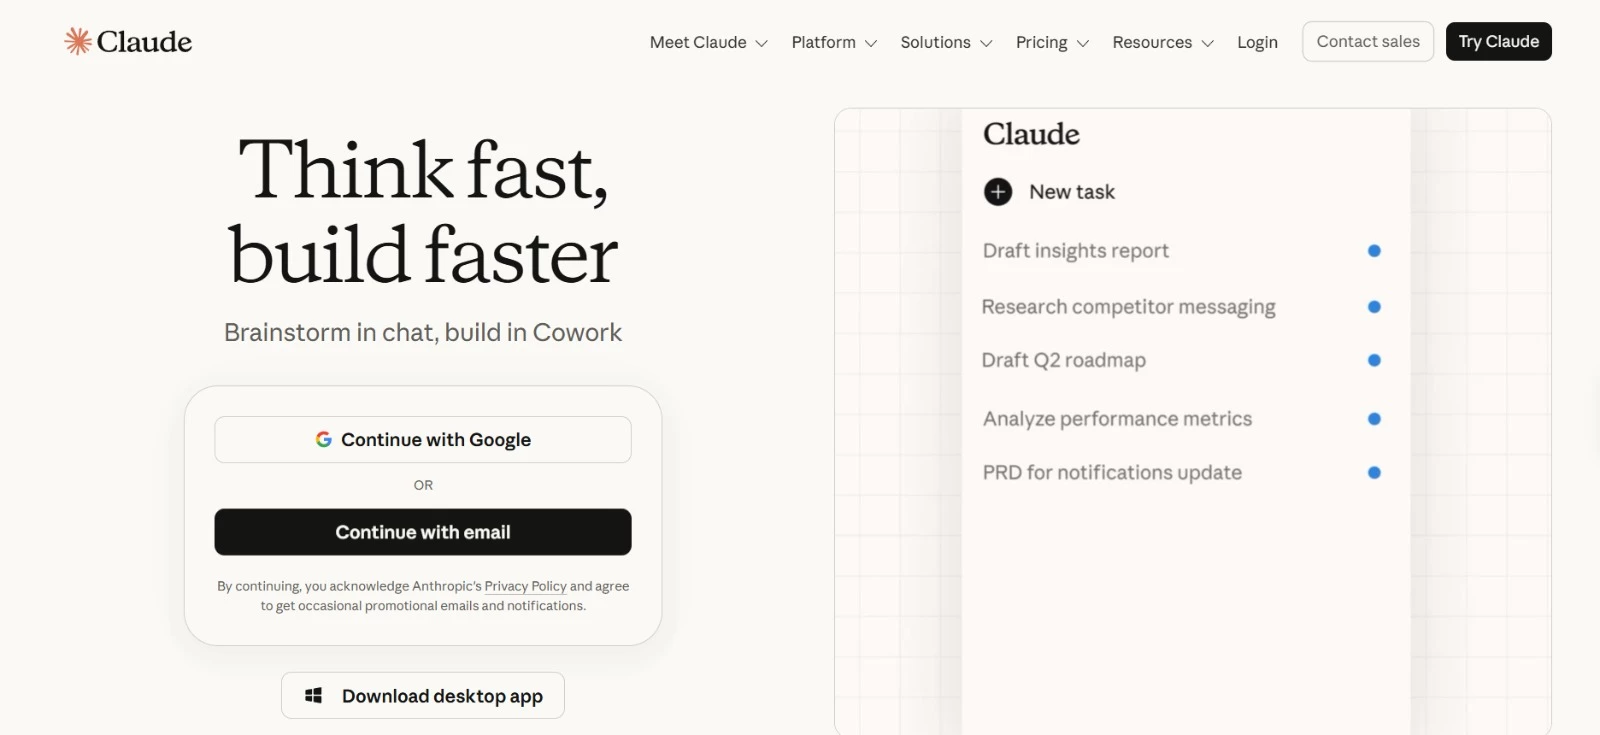
Claude works well when you need to analyze a dataset together with reports, documents, or other background material. It accepts formats including CSV, XLSX, JSON, PDF, and DOCX, then lets users explore the information through follow-up questions.
With code execution enabled, Claude can also run Python-based analysis, generate visualizations, work with spreadsheets, and turn findings into finished Excel files, reports, PDFs, or presentations.
Key Features
- File analysis: Supports CSV, XLSX, JSON, PDF, DOCX, and several other formats
- Code execution: Uses Python for calculations, transformations, statistical analysis, and data-science tasks
- Data visualization: Creates charts and other visual outputs from uploaded datasets
- File creation: Produces Excel spreadsheets, Word documents, PDFs, and PowerPoint files from the analysis
- Large-file support: Chat uploads can reach up to 500 MB per file, subject to context and file-type limits
Pros
- Can move from raw data to charts, explanations, and finished files in one conversation
- Handles multi-step analytical questions well
- Supports code-backed analysis for more complex calculations
Cons
- Usage limits can become restrictive for heavier users
- Outputs still need review for calculation or interpretation errors
Pricing
- Free
- Pro: $20/month or $200/year
- Max 5x: $100/month
- Max 20x: $200/month
- Team Standard: $20/seat/month annually or $25 monthly
- Team Premium: $100/seat/month
What Users Say
Capterra reviewers love Claude for its ease of use and its ability to handle complex tasks, long content, and data-heavy questions. Usage limits are one of the more common complaints, and some reviewers also report occasional mistakes that need checking.
4. Microsoft Copilot: Best for Excel and Power BI Users
For analysts and teams already working in Microsoft tools who want AI help with spreadsheets, dashboards, and business reporting.

Microsoft Copilot is a natural fit when the analysis already happens in Excel or Power BI.
In Excel, it can generate formulas, create charts and PivotTables, summarize data, and surface trends or outliers from natural-language prompts.
Power BI extends that into more structured BI work. Copilot can help users explore report data, create and edit report pages, summarize findings, and assist with DAX and semantic-model tasks.
Key Features
- Copilot in Excel: Analyzes workbook data and returns summaries, trends, outliers, charts, and PivotTables
- Formula assistance: Creates and explains formulas from plain-English instructions
- Power BI Copilot: Helps users explore report and semantic-model data with natural-language prompts
- Report creation: Assists with building and editing Power BI report pages and summaries
- DAX assistance: Helps create measures and work with model logic in Power BI
Pros
- Works directly inside tools analysts already use
- Good fit for spreadsheet analysis and structured BI reporting
- Cuts down manual work when creating formulas, visuals, and summaries
- Keeps Excel and Power BI analysis within the Microsoft ecosystem
Cons
- Power BI Copilot requires eligible paid Fabric or Power BI Premium capacity
- AI-generated formulas and insights still need review
Pricing
- Microsoft 365 Personal: $99.99/year
- Microsoft 365 Family: $129.99/year
- Microsoft 365 Premium: $199.99/year
- Microsoft 365 Copilot Business: $18/user/month billed annually during the current promotion; regular price $21
- Microsoft 365 Business Standard with Copilot: $23.50/user/month billed annually
- Microsoft 365 Business Premium with Copilot: $32/user/month billed annually
- Power BI Pro: $14/user/month
- Power BI Premium Per User: $24/user/month
- Power BI Copilot: Requires eligible Fabric or Premium capacity in addition to the relevant Power BI licensing
What Users Say
G2 reviewers talk about Copilot fitting naturally into Microsoft 365 and saving time on everyday work. A recurring complaint is that suggestions can be too generic or occasionally inaccurate, so users still need to review the output.
5. Gemini: Best for Google Workspace Users
For analysts who already use Google Sheets and want AI help with formulas, charts, spreadsheet cleanup, and day-to-day data analysis.
Gemini makes the most sense for teams already doing their analysis in Google Sheets. You can use it to write formulas, clean up a sheet, build charts or PivotTables, and dig into patterns without jumping to another tool.
Its Sheets capabilities have also grown this year. Gemini can now build or revise whole spreadsheets from a prompt, help fix formula errors, and work through more involved optimization problems.
Key Features
- Data analysis: Generates insights and summaries from spreadsheet data
- Formula assistance: Creates formulas and helps troubleshoot formula errors
- Charts and PivotTables: Builds visualizations and structured summaries from existing data
- Spreadsheet editing: Creates tables, fills ranges, applies filters and formatting, and edits spreadsheet structure
- Workspace integration: Can pull context from Google Drive files and Gmail when working in Sheets
Pros
- Works directly inside Google Sheets
- Handles analysis, visualization, cleanup, and spreadsheet edits in the same tool
- Fits naturally into existing Google Workspace workflows
Cons
- Access to Gemini features varies by Google Workspace plan
- More advanced analysis still benefits from well-structured spreadsheet data
Pricing
- Business Starter: $7/user/month with annual commitment or $8.40 on the flexible plan
- Business Standard: $14/user/month annually or $16.80 flexible
- Business Plus: $22/user/month annually or $26.40 flexible
- Enterprise: Custom pricing
What Users Say
Capterra reviewers often describe Gemini as fast and easy to work into everyday tasks, with several calling out its usefulness for research, writing, and work done in Google apps.
On the downside, reviewers say they sometimes need to reword prompts to get the answer they want, and a few mention responses that feel generic or slightly inaccurate.
6. Tableau Pulse: Best for AI-Powered KPI Insights
For business users and small teams that want regular KPI updates, explanations, and follow-up analysis without building dashboards themselves.
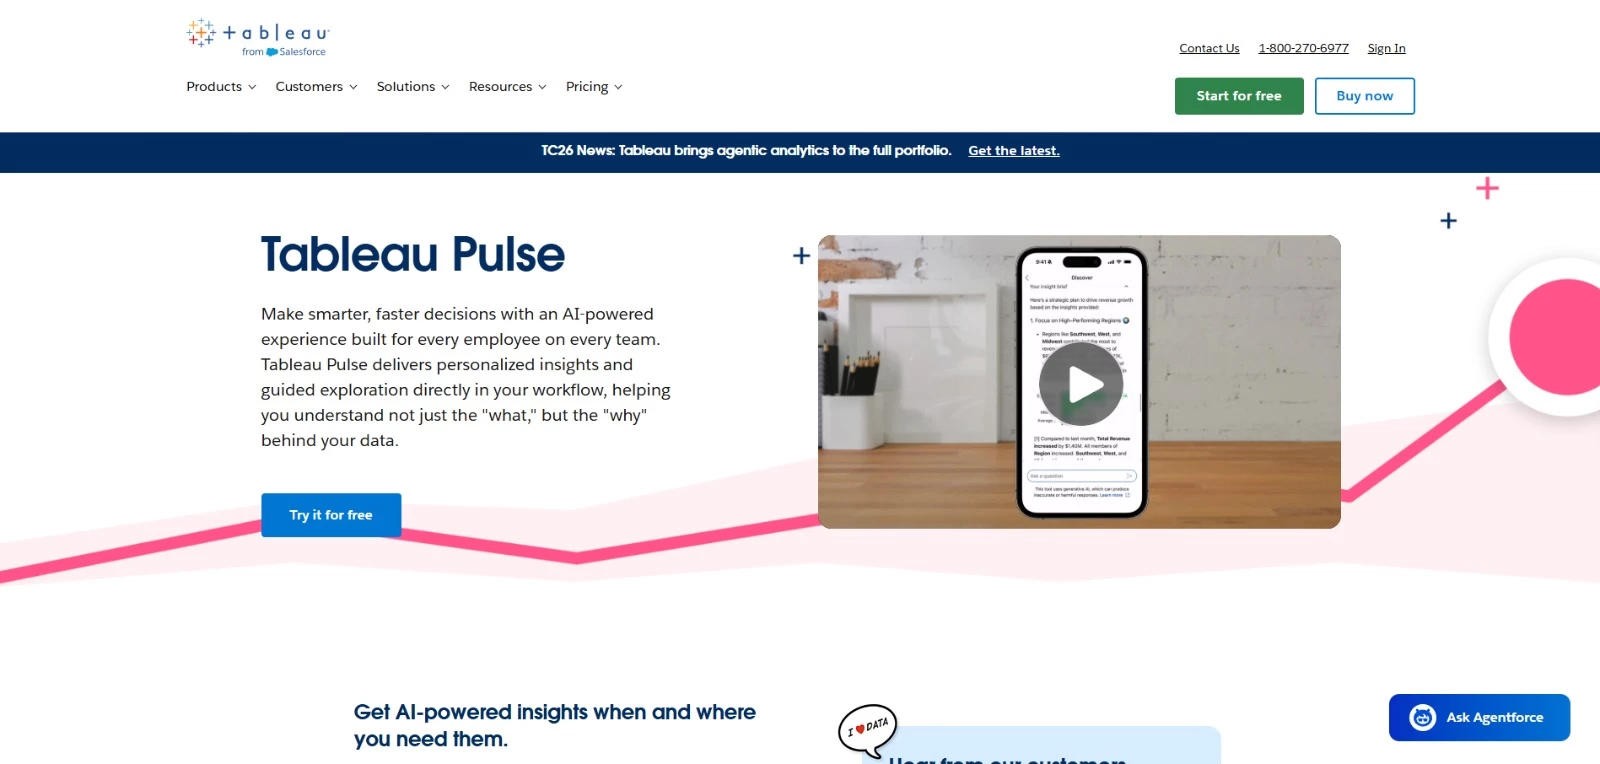
Tableau Pulse is built around the metrics people need to monitor regularly. It flags important changes, trends, and outliers, then explains what may be driving them in plain language.
Those updates can reach users via Tableau, Slack, Microsoft Teams, email, or mobile devices. For deeper follow-up, Tableau Agent in Pulse lets users ask questions across governed metrics and get source-backed answers with visual explanations.
Key Features
- Personalized metric insights: Sends updates and explanations for KPIs users follow
- Trend and outlier detection: Flags important changes and possible drivers automatically
- Tableau Agent in Pulse: Lets users ask natural-language questions across groups of governed metrics
- Workflow delivery: Sends insights through Slack, Teams, email, Tableau, and mobile
- Metrics layer: Uses shared business definitions to keep KPI calculations and context consistent
Pros
- Keeps important KPIs visible without requiring users to open dashboards constantly
- Makes metric changes easier for nontechnical users to investigate
- Delivers insights in the tools teams already use
- Uses governed metric definitions rather than relying on open-ended AI calculations
Cons
- Tableau Agent in Pulse requires Tableau+ after the trial
- Makes the most sense for organizations already using Tableau Cloud
Pricing
- Tableau Standard: From $15/user/month
- Tableau Enterprise: From $35/user/month
- Tableau Cloud+: Custom pricing
- Tableau+ Bundle: Custom pricing
- Tableau Pulse: Included with Tableau Cloud and Embedded Analytics editions
- Tableau Agent in Pulse: 60-day trial available for existing Tableau Cloud sites; Tableau+ required afterward
What Users Say
Tableau Pulse doesn’t have a substantial standalone review pool, so the available feedback is mainly for Tableau overall.
G2 reviewers regularly mention the drag-and-drop interface and visual dashboards as reasons Tableau makes complex data easier to work with. More advanced calculations can take time to learn, and reviewers also report slower performance with very large datasets.
Choosing the Right AI Analytics Platform for Your Team
A good starting point is the kind of data work your team handles most often. Someone analyzing a CSV once a week has very different needs from a company running predictive models or giving hundreds of employees access to governed business data.
- For quick, conversational analysis, use Julius AI, ChatGPT, or Claude.
Julius is the more data-focused option for querying files and connected sources. ChatGPT works well for flexible one-off analysis, Python, charts, and mixed file formats. Claude is a better fit when the dataset needs to be interpreted together with reports or other supporting documents.
- For spreadsheet-based analysis, use Microsoft Copilot or Gemini. Copilot is the better fit for Excel and Power BI users, whereas Gemini keeps formulas, charts, cleanup, and analysis inside Google Sheets.
- For dashboards and business reporting, look at Domo, ThoughtSpot, or Qlik.
Domo works well for executive KPI reporting across several business systems. ThoughtSpot is better for conversational exploration of governed enterprise data. Qlik adds predictive analysis to its BI and natural-language capabilities.
If your main challenge is connecting campaign data, setting up measurement, or turning analytics into a marketing strategy, working with a marketing analytics company may be more practical than adding another tool to the stack.
- For governed warehouse and lakehouse data, choose Databricks or Snowflake Cortex AI.
Databricks suits teams already working with lakehouse data and Genie-based self-service analytics. Snowflake Cortex AI makes more sense when the data already lives in Snowflake, and the team wants to add conversational analytics, AI agents, and unstructured data analysis there.
- For predictive modeling, DataRobot stands out.
It is the clearest fit when the goal is churn prediction, forecasting, fraud detection, risk scoring, or another repeatable model rather than dashboard exploration or a one-off question.
- For collaborative analyst workflows, consider Hex.
It gives data teams SQL and Python notebooks, while business users can work with the same governed data through conversational self-service.
- For specialized analytics, match the tool to the problem. Brandi AI focuses on AI visibility and citations, Zuko on form and checkout behavior, and Tableau Pulse on KPI monitoring and proactive insights.
| Tool | Best For | Predictive Analytics | Conversational Analytics | Workflow Automation | Price (Starting At) | Free Tier |
| ThoughtSpot | Conversational enterprise BI | No | Yes | Limited | $25/user/month | No |
| Domo | Executive dashboards and KPI reporting | Limited | Yes | Yes | Custom | No |
| Brandi AI | AI visibility analytics | No | No | Yes | $349.99/month | No |
| Zuko | Form and checkout analytics | No | Limited | Limited | $70/month | No |
| Hex | Collaborative analytics workflows | Limited | Yes | Yes | Free | Yes |
| Databricks | Large-scale lakehouse analytics | Yes | Yes | Yes | Genie from $0.07/DBU | Yes |
| Snowflake Cortex AI | Warehouse-native AI analytics | Limited | Yes | Yes | Usage-based | No |
| Qlik | BI and predictive analytics | Yes | Yes | Yes | $300/month | No |
| DataRobot | Predictive AI and model governance | Yes | Limited | Yes | Custom | No |
| Julius AI | Conversational data analysis | Yes | Yes | Yes | Free | Yes |
| ChatGPT | Flexible file-based data analysis | Yes | Yes | Limited | Free | Yes |
| Claude | Exploring and interpreting complex data | Limited | Yes | Limited | Free | Yes |
| Microsoft Copilot | Excel and Power BI analysis | Limited | Yes | Limited | Microsoft 365 Personal: $99.99/year | No |
| Gemini | Google Sheets and Workspace analysis | Limited | Yes | Limited | Business Starter: $7/user/month | No |
| Tableau Pulse | AI-powered KPI insights | Limited | Yes | Limited | Viewer access from $15/user/month | No |
- ThoughtSpot offers a free Embedded Developer plan for 1 year, but no permanent free tier for ThoughtSpot Analytics.
- Free consumer Gemini exists, but the Gemini in Google Sheets capabilities depend on eligible Workspace/AI access.
- Tableau Pulse is included with eligible Tableau Cloud and Embedded Analytics editions, but it isn't a standalone permanent free plan. A trial is available.
Teams evaluating new platforms can also use data analytics conferences to compare emerging tools, hear case studies on implementation, and see how other organizations are approaching AI, governance, and analytics modernization.

Our team ranks agencies worldwide to help you find a qualified partner. Visit our Agency Directory for the top AI companies, as well as:
- Top AI Companies in Boston
- Top Big Data Companies
- Top Big Data Consulting Companies
- Top AI App Development Companies
- Top AI Product Development Companies
Our design experts also recognize the most innovative design projects across the globe. Given the recent uptick in AI tools usage, you'll want to visit our Awards section for the best & latest in AI website designs.