The social media metrics that matter in 2026 have little in common with the metrics marketers obsessed over a few years ago.
The focus has shifted toward signals that influence distribution, indicate purchase intent, and help connect social activity to leads, pipeline, and revenue.
Social Media Metrics: Key Findings
- Create content people want to share, not just like. Sends per reach is one of Instagram's strongest ranking signals and a key driver of organic discovery.
- Tie every engagement metric to a business outcome. A save should signal future interest, a share should expand reach, and a lead should connect back to revenue.
- Separate optimization metrics from business metrics. Monitor sends, saves, and watch time in real time, then evaluate leads, pipeline, conversions, and revenue afterward.
If You Could Track One Metric in 2026, What Would It Be?
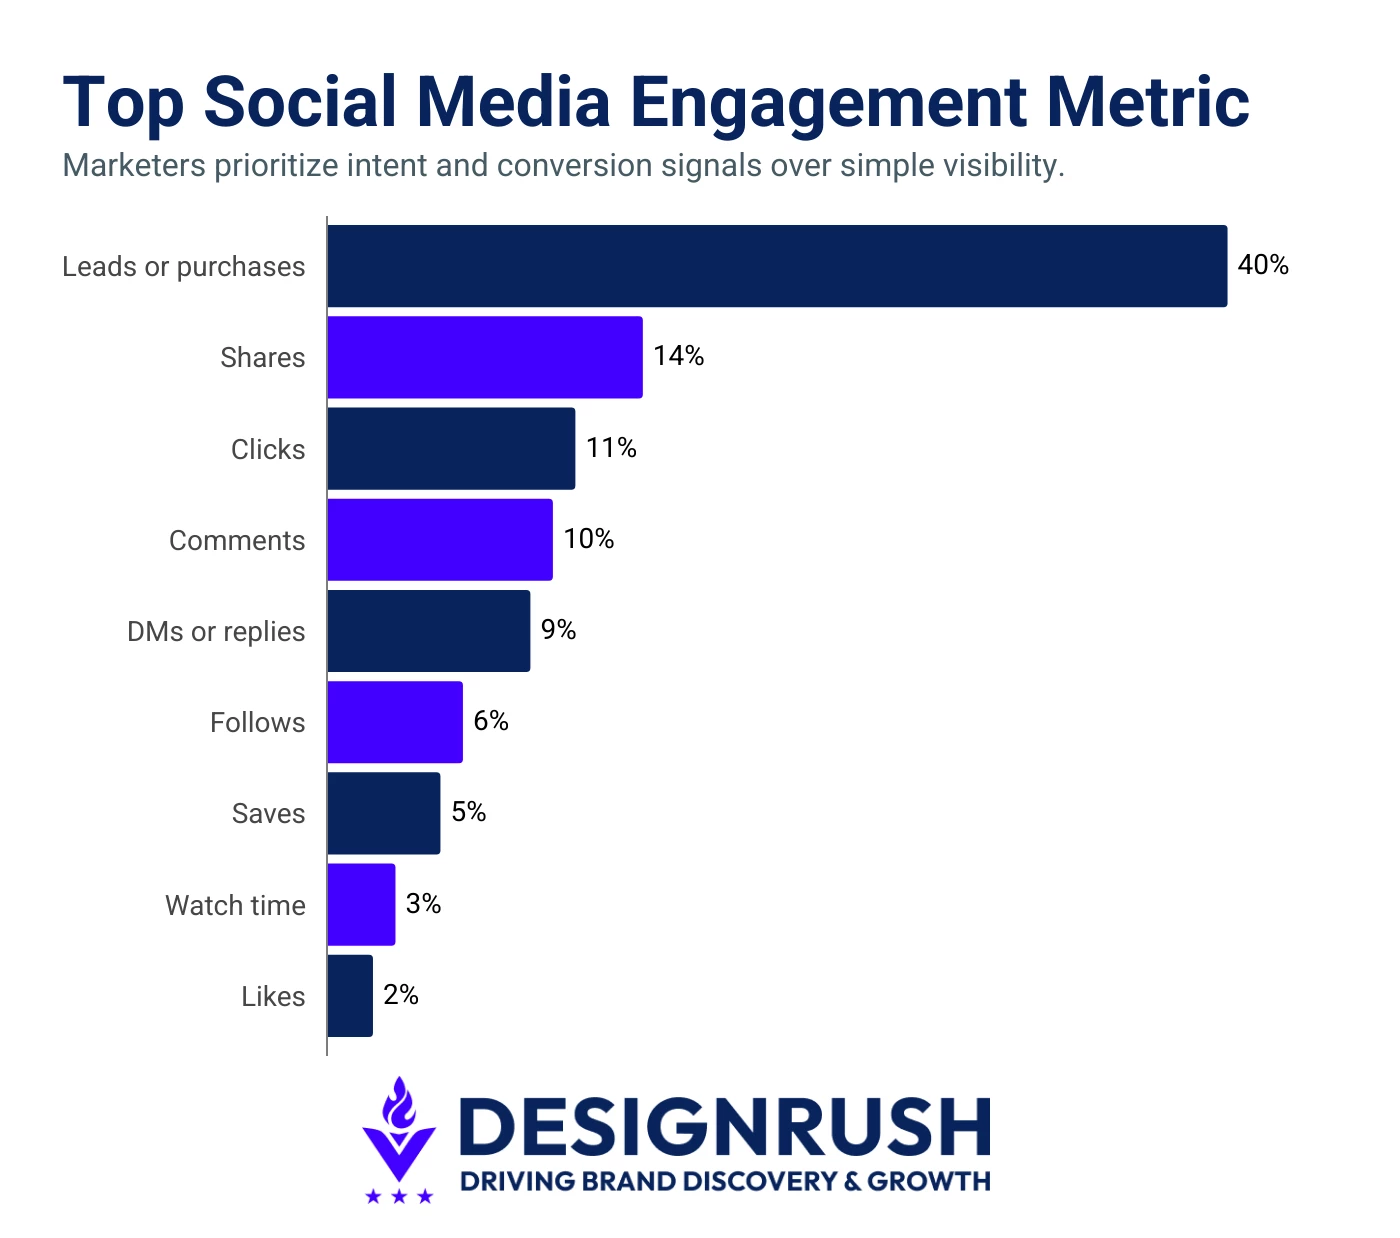
When asked which single metric they would keep if forced to choose only one, just 2% of marketers picked likes.
The DesignRush 2026 Benchmark Survey shows a major shift in how marketers define success.
Instead of prioritizing visibility alone, marketers are placing more weight on signals that indicate intent, support conversions, and help justify budget decisions.
Most valuable engagement metric, according to respondents:
- Leads or purchases: 40%
- Shares: 14%
- Clicks: 11%
- Comments: 10%
- DMs or replies: 9%
- Follows: 6%
- Saves: 5%
- Watch time: 3%
- Likes: 2%
The metrics teams trust most are the ones that indicate genuine interest, spark conversations, or encourage people to share content with others.
The responses clustered around two priorities:
- One group focused on business outcomes such as leads, pipeline, and revenue.
- The other focused on saves and shares, actions that platforms increasingly use to determine what gets recommended and what gets buried.
That divide reflects one of the biggest measurement challenges in marketing today: balancing the metrics that drive distribution with the metrics that prove ROI.
Interestingly, Instagram is pointing marketers in the same direction.
In January 2026, Instagram head Adam Mosseri identified the platform's three most important ranking signals across all surfaces: watch time, sends per reach, and likes per reach.
Why Sends Per Reach Is One of Instagram's Most Important Ranking Signals
Sends per reach (SPR) is the share of people who saw your content and then sent it to someone else, typically by DM, expressed as a ratio against total reach.
If a Reel reaches 10,000 accounts and 300 of them forward it to a friend, your sends per reach is 3%. It isolates one specific behavior from the noisier pile of likes, comments, and impressions, and it has become the metric Instagram points to most often when explaining how content travels.
The reason it carries weight is mechanical, not sentimental. A send is the most effortful public-but-private act a viewer can take: it requires thinking of a specific person, deciding the content is worth their attention, and spending a tap to deliver it.
That makes it the hardest signal to fake and the closest proxy for "this was genuinely worth passing on." DM shares can be 3-5x more valuable than likes for reaching new audiences, which is why optimizing for sends is now the lever that moves distribution.
View this post on Instagram
Adam Mosseri, Head of Instagram, has framed this directly:
“One of the most important signals we use for ranking is sends per reach. So out of all the people who saw your reel or your photo, how many of them sent it to a friend in a DM?
We want not only to be a place where you passively consume content, but you discover things you want to tell your friends about.
Think about making content that people would want to send to a friend, someone that they care about, and it will help your reach over time.”
For marketers, that changes what success looks like.
Instead of asking "will this get likes," the question becomes "is this useful, funny, or relatable enough that someone will think of a specific person and forward it," which is a meaningfully higher bar.
Posts that sustain a high sends-per-reach ratio earn outsized distribution across Explore and Reels, because the platform reads each send as a personal endorsement rather than a passive reaction.
The strongest posts give people a reason to act. That might be a statistic worth forwarding, a framework worth saving, or an insight worth sending to a colleague.
What’s a Good Sends Per Reach Rate?
A rough consensus has formed among agencies and creators testing their own accounts: a strong sends per reach sits in the low single-digit percentages, and around 3.5%+ gets cited as the threshold where a post earns a serious push to non-followers.
Below 1% is typical for content that's landing with existing followers but not traveling beyond them.
These figures come from third-party account testing, not from Instagram, and they vary by format, niche, and audience size.
Treat these figures as directional rather than definitive. Comparing performance against your own 30-day median will tell you far more than any industry benchmark.
Connected vs. Unconnected Reach
Instagram no longer runs a single algorithm. It ranks content across separate surfaces, and it weights signals differently depending on whether it's showing your post to people who already follow you (connected reach) or to strangers it's deciding whether to recommend (unconnected reach).
The distinction matters because the two reach types reward different actions.
- For content shown to existing followers, likes are slightly more important than sends
- For getting discovered by new audiences, sends are more important than likes.
Likes tend to matter more among existing followers. Sends play a larger role when Instagram decides whether to show content to new audiences.
Watch time remains the most important signal across both, but between the two engagement actions, the split is clean: likes defend, sends expand.
@gingermarketer View count is the most misleading metric on TikTok for creators who actually want to grow. These two numbers are what the algorithm actually uses to decide whether to push your content to a bigger audience and most creators never track them. #tiktokalgorithm#tiktokgrowth#tiktoktips#contentcreator#howtogrowontiktok♬ original sound - Josh - TikTok Growth Expert
TikTok weights shares and rewatches the same way, and LinkedIn increasingly favors content that earns reshares and saves over passive reactions.
The universal principle underneath all of them: an effortful action (a send, a save, a reshare) is a stronger signal of value than a passive one (a like, a view), because it costs the viewer something to make it.
Whatever platform you're on, the question that moves distribution is the same: is this worth passing to someone specific?
Saves vs. Shares: What Audiences Are Telling You
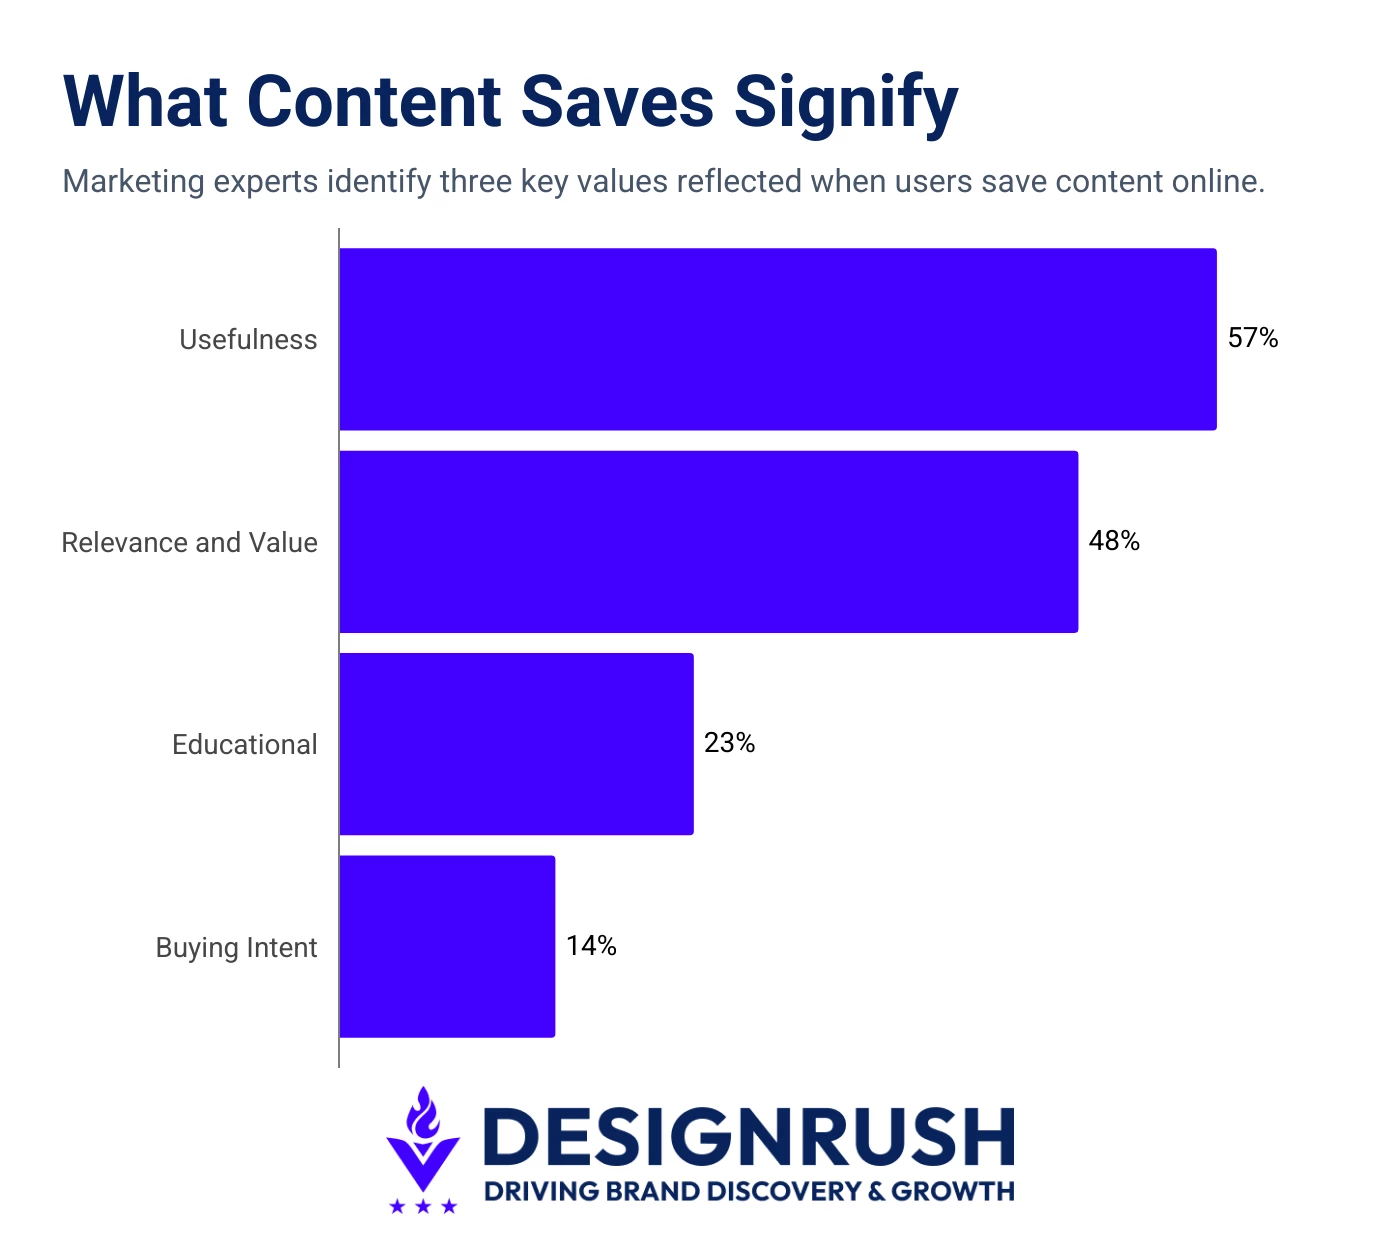
Marketing experts in the DesignRush 2026 Benchmark Survey were asked what a save tells them about a piece of content.
The responses clustered into three readings, each pointing at a different kind of value.
- Relevance and value (48%): Nearly half read a save as a vote on fit, or content that hit close enough to a viewer's situation that they wanted to keep it. This is the broadest reading, and the most strategically useful.
- Educational usefulness (23%): A bookmark on something worth learning later. This is why how-to carousels, frameworks, and reference posts over-index on saves: they're built to be returned to, not consumed once.
- Buying intent (14%): The smallest but heaviest cluster, where a viewer saving a product or pricing breakdown because they expect to act later. A save with intent behind it is a lead the funnel hasn't captured yet.
When someone saves a post, they're signaling that the content has value beyond the moment they encountered it.
Nicky Zhu, AI Interaction Product Manager at Dymesty, treats saves as one of the clearest indicators of content value on social platforms:
“A save is the most honest signal a platform gives you. Nobody saves a post by accident. A save tells a creator that their content was valuable enough to retain, educated the viewer, solved something for the viewer, or even moved the viewer emotionally.”
The same survey asked marketers to decode shares, and the readings skewed sharply toward usefulness and emotion, the two things people are willing to spend social capital to pass along.
- High usefulness (57%): The dominant reading by far, which is content practical enough to put directly in front of a specific person. People don't forward filler, which is exactly why Instagram weights shares so heavily for new-audience distribution.
- Strong emotional reaction (21%): Content that made the viewer feel something sharp enough to want a friend to feel it too. Emotional shares are identity-based rather than utility-based, and tend to spread faster since they need no matching practical need.
- Entertainment (14%): The smallest, most format-dependent cluster but the most frictionless. Hard to engineer and easy to under-credit, yet often what wins the unconnected reach everything else depends on.
Read side by side, the two metrics describe a sequence.
- Saves capture private intent: value a viewer wants to keep.
- Shares capture endorsed value: content a viewer will stake a relationship on.
The first predicts what someone might do; the second is the act that hands your reach to people you'd never have reached on your own.
Why Pipeline Metrics Still Top the KPI List
When the conversation moves from the content calendar to the boardroom, pipeline wins, because it's the only language the C-suite was already speaking.
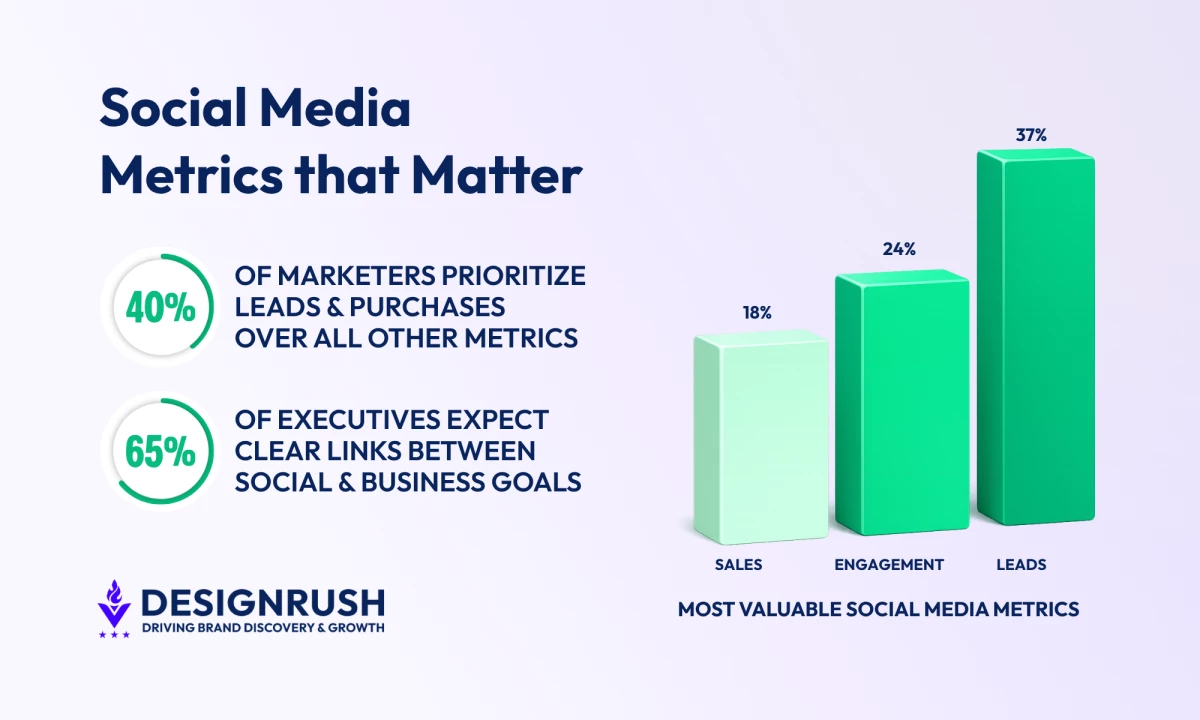
In the DesignRush 2026 Benchmark Survey, lead generation was the single most common official team KPI, named by 40% of respondents, ahead of any engagement or reach metric.
It's the number teams report up, the one tied to quarterly targets, and the one that survives a budget review. Whatever marketers find most diagnostically useful day to day, the leads figure is what their performance is formally graded against.
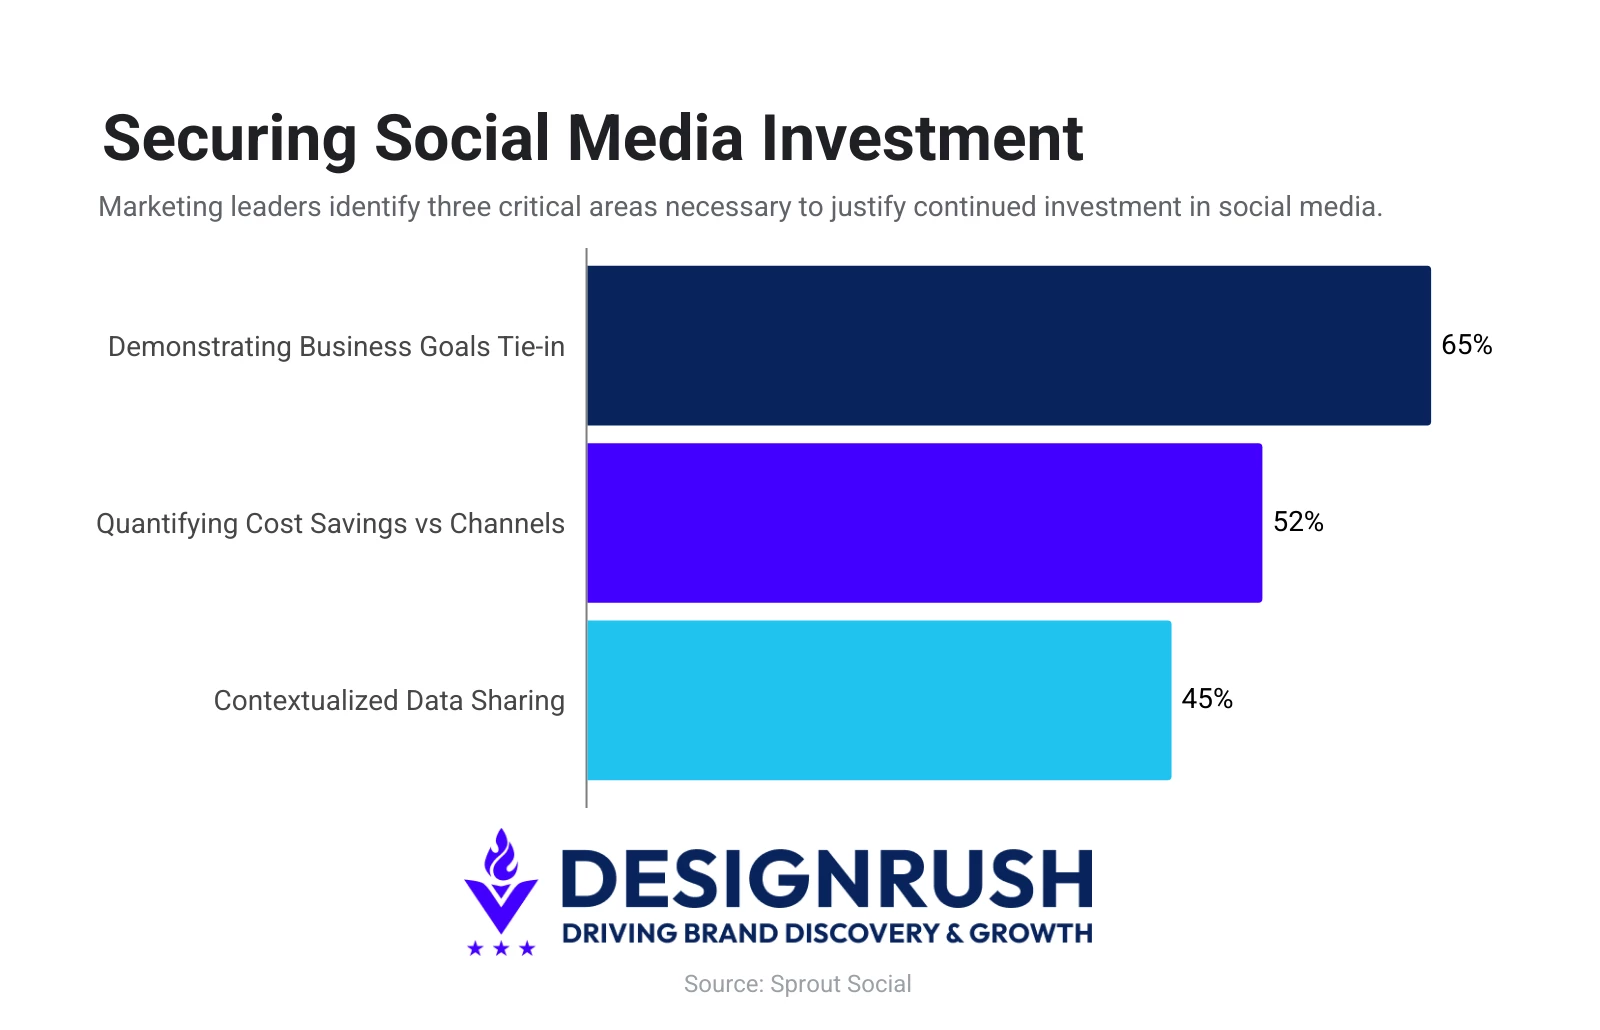
The pressure behind that choice comes from above. The 2025 Sprout Social Index found that 65% of leaders want to see direct connections between social media campaigns and business goals, and 52% want quantifiable cost savings across social channels.
That demand reshapes the entire KPI list: social teams now define ROI through engagement (68%), conversion (65%), and revenue (57%) above all other metrics, with the business-outcome metrics increasingly crowding out the vanity ones.
How Leading & Lagging Metrics Fit Together
The difference is less about priorities and more about timing. Some metrics help teams improve content while it's live. Others help prove results after the campaign ends.
| Signal Type | Example Metrics | Good For | Cant' Do |
| Leading | Sends per reach, saves, watch time, likes per reach | Steering content live; predicts demand before it converts | Prove revenue alone |
| Lagging | Leads, pipeline, conversions, revenue attributed | Proving value after the fact; speaks leadership's language | Change live content |
A mature dashboard tracks the leading metric to optimize and the lagging metric to justify. This is why the same marketer can name saves as the metric they'd never give up and still report leads as the number that keeps the lights on.
Composite Metrics for Social Media
The marketers who think hardest about measurement have started building composite metrics that normalize for reach or pit one signal against another to surface intent the standard dashboard buries.
None of these are official Instagram metrics. They're back-of-the-spreadsheet calculations, and the better ones are worth stealing.
1. Saves Per 1,000 Impressions
The problem with a raw save count is that it scales with reach, which makes it useless for comparing posts that landed in front of wildly different audience sizes.
A carousel with 400 saves on 200,000 impressions is performing worse, per viewer, than one with 90 saves on 20,000, but the raw number says the opposite.
Saves per 1,000 impressions fixes that by normalizing the signal against exposure: divide total saves by impressions, multiply by 1,000.
The result is a reach-independent measure of how reference-worthy a post is, which makes it the cleaner way to compare content types, run creative tests, or track whether a format is improving over time.
It's the same logic the platform applies with "per reach" metrics, extended to the one action Instagram doesn't surface as a ratio.
2. Share-to-Save Ratio
A high share-to-save number marks content that travels: emotional, entertaining, immediately useful to a third party. A low one (more saves than shares) marks content people hoard rather than broadcast: reference material, frameworks, things worth keeping but not necessarily forwarding.
Neither end is better; they serve different goals.
- If you're chasing unconnected reach and new audiences, you want the ratio tilted toward shares.
- If you're building a library of saved authority content that pulls people back, a save-heavy ratio is the win.
Tracked over time, the ratio tells a brand whether its content is functioning as a megaphone or a reference shelf, and whether that matches what the strategy actually needs.
3. Conversation Yield
The most ambitious composite tries to measure the thing every other metric only approximates: did the content start a conversation that matters?
Conversation yield counts the high-intent exchanges a post generates:
- DMs asking about price or availability
- Comments signaling purchase consideration
- Replies that express trust or recommendation
Then normalizes them per 1,000 impressions.
View this post on Instagram
It's the hardest of the three to calculate, because it requires reading and classifying responses rather than pulling a number from Insights. But it's also the closest a leading metric gets to the lagging ones leadership cares about.
For teams trying to bridge the gap between the content dashboard and the pipeline report, conversation yield is the metric that lives in both worlds: engagement that's already starting to look like demand.
The 2026 Social Media Metrics Dashboard: What to Optimize vs. What to Report
Most social media KPIs fall into one of two categories: metrics that help improve performance and metrics that help explain performance.
Cross the streams and you end up pitching sends per reach to a CFO who asked about revenue, or optimizing a live post against a number that won't budge for a quarter.
Here's the clean division:
| Aspect | Optimize With | Report Up With |
| The metrics |
|
|
| What they answer | "Is this working right now?" | "Did it pay off?" |
| When they move | Within hours | After the funnel runs |
| What they're for | Deciding what to post more of, kill, or boost | Defending headcount and budget |
| Who you show | Content team | Leadership and finance |
The one rule is simple: don't mix the two. When deciding what to publish, focus on signals that shape performance in real time. In reporting conversations, anchor everything to outcomes that matter to the business.
Del Harbeck, Director and Co-Owner of Marketing Movement, highlights how both layers work together in practice:
"Ultimately, leads are the metric that matters most. But it's impossible to just look at leads to understand social success. [Engagement] is always the biggest metric. If people are responding and interacting, then you're doing something right."
The strongest teams treat these as connected but distinct signals. Engagement explains what’s working in the content itself. Leads explain whether that performance is translating into business impact.
Social Media Metrics: Final Thoughts
A dashboard packed with metrics isn't useful if none of them change what you do next.
The strongest social teams know which numbers help them make better content decisions and which numbers help them defend budget, headcount, and investment. Those are rarely the same metrics.
The challenge for 2026 isn't collecting more data. It's knowing which signals deserve attention and which ones belong in the background.
![]()
Our team ranks agencies worldwide to help you find a qualified partner. Visit our Agency Directory for the top social media marketing companies, as well as:
- Top Digital Marketing Agencies
- Top AI Marketing Companies
- Top AI Market Research Companies
- Top Content Marketing Agencies
- Top Direct Marketing Companies
Our design experts also recognize the most innovative design projects across the globe.
Given the recent uptick in video on social media, you'll want to visit our Awards section for the best & latest in social media videography designs.
Social Media Metrics FAQs
1. What are the best social media engagement metrics in 2026?
The best engagement metrics in 2026 are sends per reach, saves, watch time, share-to-save ratio, and meaningful conversations.
Unlike likes, these actions require higher user intent and are more closely tied to content distribution, audience trust, and eventual business outcomes. They reveal not just whether people saw your content, but whether they found it valuable enough to save, share, revisit, or discuss.
2. Are likes still worth tracking in 2026?
Likes still have value, but primarily as a secondary diagnostic metric rather than a performance KPI. They can indicate whether content resonates with existing followers, particularly when measured as likes per reach.
However, likes require minimal effort and rarely predict conversions, shares, or revenue. Most marketers now prioritize stronger intent signals such as saves, shares, watch time, and lead generation when evaluating content success.
3. Does follower count still matter?
Follower count matters as a measure of potential audience size, but it is no longer a reliable indicator of influence or business impact. Social platforms increasingly distribute content based on engagement signals rather than follower relationships.
As a result, smaller accounts with highly shareable content often outperform larger competitors in reach, engagement, and revenue generation. Audience quality and content performance now matter far more than audience size alone.
4. Which engagement metric best predicts sales?
Saves are often the strongest engagement-based predictor of future sales because they signal a user's intent to revisit content before making a decision. This is especially true for product comparisons, pricing information, case studies, and educational content.
However, no engagement metric can prove revenue independently. The most effective approach is to combine saves and high-intent conversations with downstream metrics such as leads, conversion rates, pipeline influence, and attributed revenue.
5. How often should social media KPIs be reviewed?
Different metrics should be reviewed on different timelines. Leading indicators such as sends, saves, shares, and watch time should be monitored daily or weekly to guide content decisions. Business metrics such as qualified leads, pipeline contribution, customer acquisition, and revenue attribution are more useful when reviewed monthly or quarterly.
Separating optimization metrics from reporting metrics helps teams react quickly without losing sight of long-term outcomes.
6. How can B2B brands measure social media success?
B2B brands should measure social media success based on its contribution to business growth rather than engagement alone. The most valuable metrics include qualified leads, demo requests, pipeline influence, sales conversations, and attributed revenue.
Engagement metrics still matter, but primarily as leading indicators that help explain why content is generating demand. The ultimate goal is to connect social activity to measurable business results and revenue impact.
7. What are vanity metrics in social media, and which ones should you stop tracking?
Vanity metrics are surface-level numbers that look strong in reports but don’t reliably predict behavior or business outcomes.
Examples include raw follower counts, impressions without context, and total likes. They persist because they’re easy to track and compare. Stronger alternatives include sends per reach, saves per 1,000 impressions, and conversation yield, which better connect engagement to decisions and revenue.