You've deployed an AI model that aced every benchmark. But why is it underwhelming in production? You are frustrated, clients aren't impressed, and you're scrambling to figure out why performance reports say one thing while real-world outcomes show another.
How To Measure AI Performance: Key Points
- Trusted benchmarks like ImageNet, COCO, GLUE, and MLPerf allow companies to compare AI performance against leading models and validate effectiveness.
- Relying on accuracy alone can be misleading. In real-world use cases, F1-score (balance of precision and recall), latency (speed), and throughput (scalability) are often more meaningful.
- AI models degrade over time due to data and concept drift. Platforms like Evidently AI and WhyLabs enable real-time alerts and diagnostics to help teams respond before business impact is felt.
Why Measuring AI Performance Isn’t as Straightforward as It Seems
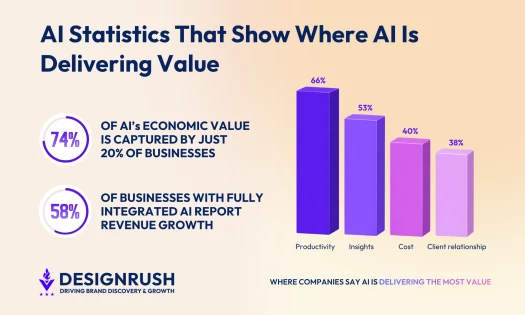
Artificial Intelligence (AI) performance depends on more than just accuracy — it hinges on how well the model aligns with business goals, adapts in real-time, and earns trust from end users.
In this guidewe’ll showyou how to evaluate AI model performance using the right metrics, contextual benchmarks, and continuous monitoring practices.
Related articles:
1. Mastering AI Sentiment Analysis
2. How to Use AI in 2026
3. Predictive Analytics Driving Smarter Businesses
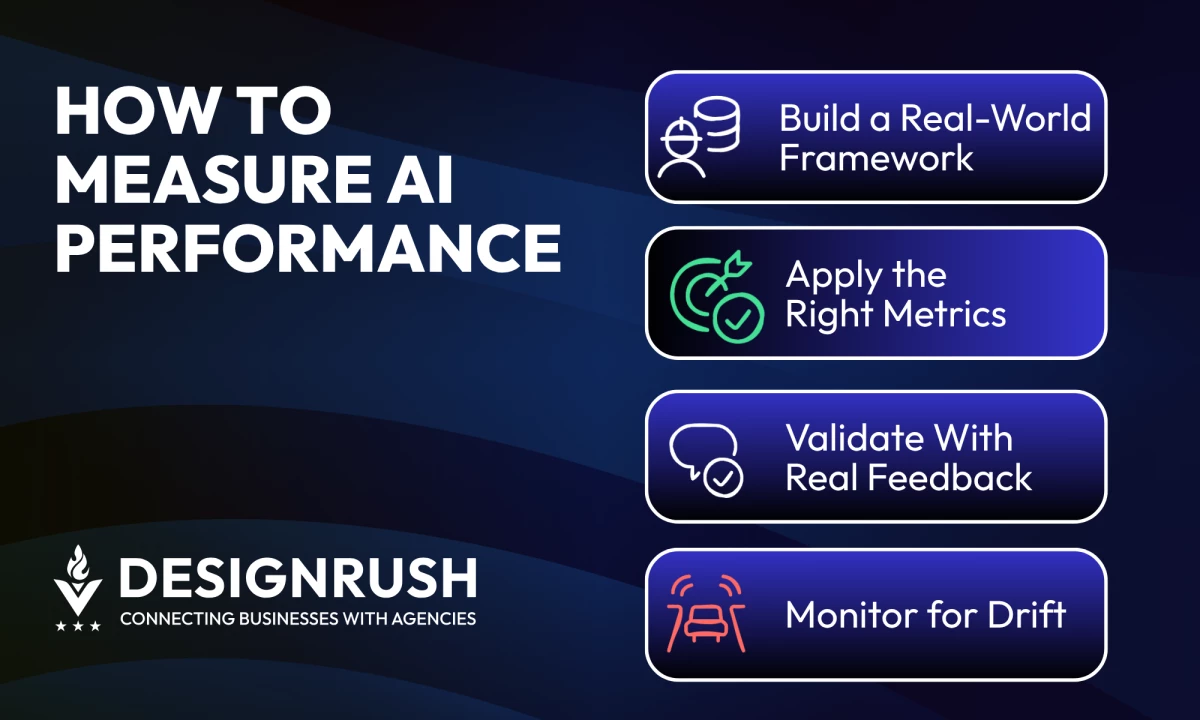
Build a Measurement Framework That Reflects Business Reality
 If your metrics aren’t tied to business outcomes, real user behavior, and how your AI is actually used, you’re flying blind. A solid performance framework fixes that. It gives your team and stakeholders clarity on what’s working, what isn’t, and where to optimize next.
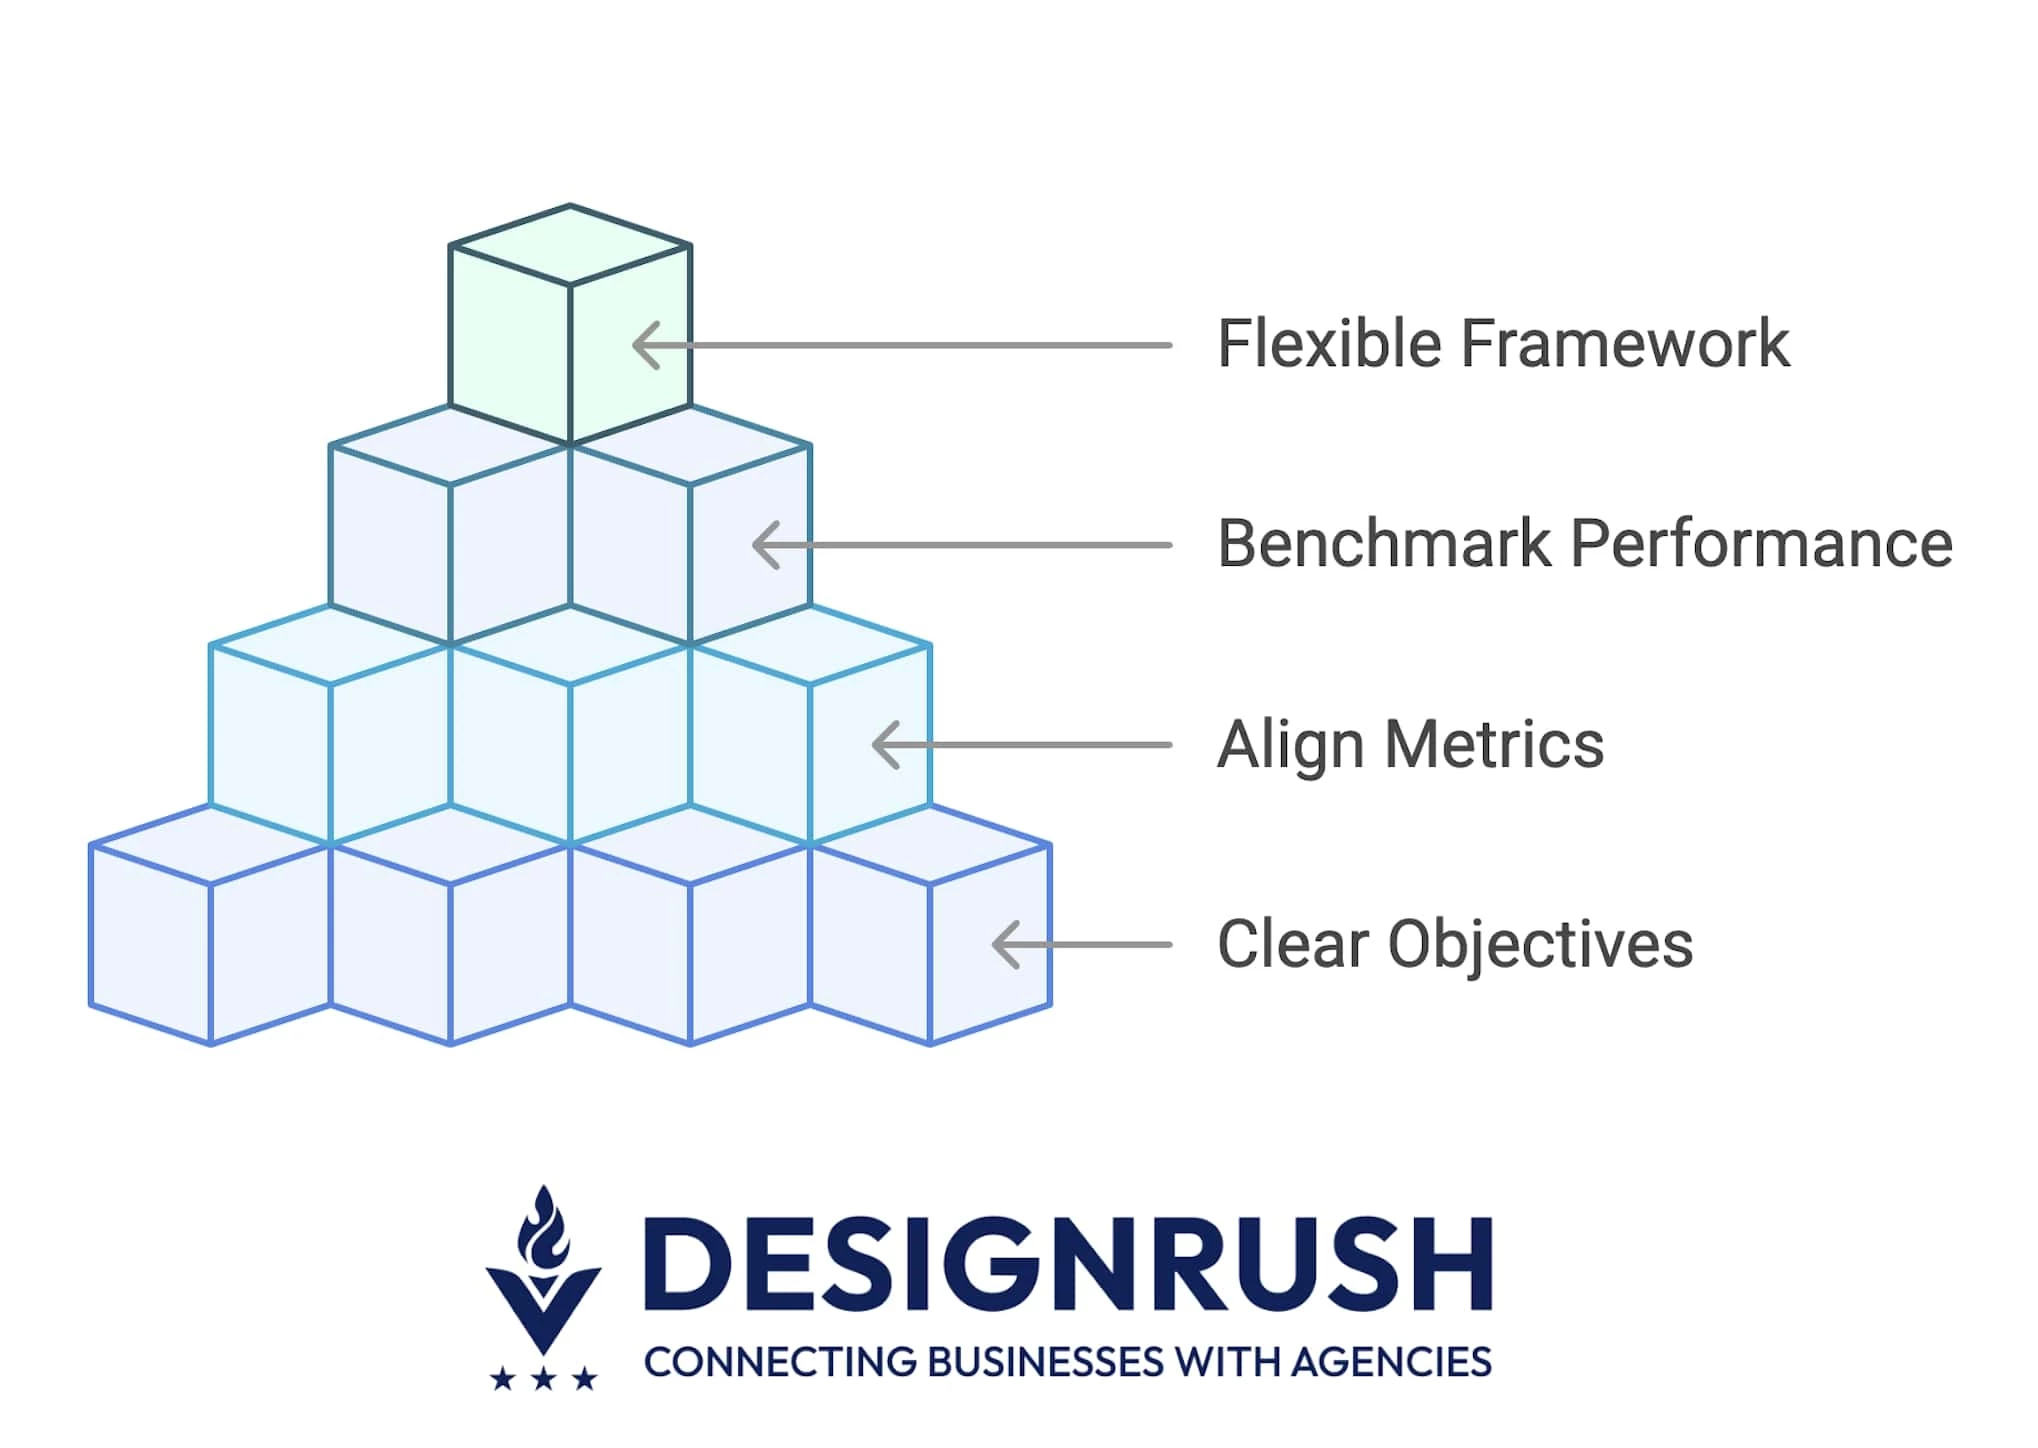
Here’s how to build one that reflects what success looks like in the real world:
- Start with clear objectives
- Align metrics with your AI’s use case
- Benchmark performance using trusted standards
- Keep your framework flexible and evolving
1. Start With Clear Objectives
Before measuring anything, define what “good performance” means for your business case. Technical success means nothing if it doesn’t move a key metric that matters to stakeholders.
A fraud detection model, for instance, might need to prioritize recall over precision — better flag more potential fraud than letting a bad transaction slip through. But for customer support AI, the reverse might be true: fewer false positives (precision) could mean a smoother user experience.
Set these priorities first. They’ll shape every performance metric you track from this point on.
2. Align Metrics With Your AI’s Use Case
Success in AI should be use-case specific. The right performance metrics depend entirely on what your model is supposed to do. For example:
- Language models (like for translation or summarization) should be evaluated with scores like Bilingual Evaluation Understudy (BLEU) or Recall-Oriented Understudy for Gisting Evaluation (ROUGE), which measure how close the output is to human-written content.
- Computer vision systems may prioritize mean average precision (mAP) or top-K accuracy, which assess object detection and classification performance.
- Healthcare AIs demand clinical rigor — sensitivity and specificity help ensure critical conditions aren’t missed (false negatives) or misdiagnosed (false positives).
- Recommendation engines use metrics like click-through rate (CTR) or normalized discounted cumulative gain (NDCG) to measure how well content suggestions drive engagement or conversions.
Misaligned metrics create a dangerous illusion of performance. A chatbot with 95% “accuracy” might still frustrate users if its answers are contextually irrelevant.
This is why aligning metrics with business KPIs is crucial.
Shantanu Pandey, CEO of Tenet, explains that AI metrics should tie back to outcomes executives care about, not vanity stats. For one eCommerce client, his team replaced “recommendation click-through rate” with a more meaningful indicator: revenue per visitor. The change reframed performance in terms the CFO could act on.
3. Benchmark Performance Using Trusted Standards
Even if your model shows high accuracy, it doesn’t mean much without context. Benchmarks give you that context. They act as a baseline or comparison point, answering questions like:
- Is this model performing well for this task?
- How does it stack up against others in the field?
- Can I confidently show stakeholders that we’re doing better than average, or even best-in-class?
Here are some widely trusted benchmarks (standardized datasets and evaluation protocols) used across major AI domains to objectively compare model performance:
- ImageNet: Benchmarks for computer vision but used differently. ImageNet is for image classification. It answers: can the model correctly label what’s in an image?
- COCO: Common Objects in Context (COCO) is for more complex tasks like object detection and segmentation. It answers: can it identify multiple objects, where they are, and what they’re doing?
- GLUE and SuperGLUE: Benchmarks for testing how well language models understand text. They include tasks like figuring out if two sentences mean the same thing or answering questions based on context.
- MLPerf: A set of tests that measure how fast and efficiently AI models run on different hardware (like GPUs or TPUs), across tasks like image recognition or language processing.
Use these to validate performance against accepted standards and give clients or stakeholders confidence that your results stand up to scrutiny.
4. Keep Your Framework Flexible and Evolving
AI systems don’t exist in vacuum. Static metrics can quickly lose relevance as goals shift, or as model behavior changes in response to new data. To adapt, regularly audit:
- Are you tracking the right KPIs?
- Have user complaints shifted?
- Are business conditions altering the definition of “value”?
Keep the framework flexible enough to respond to these shifts, so your models stay relevant and effective.
Apply the Right Quantitative Metrics
High accuracy doesn’t always mean high performance. Many AI teams make the mistake of over-relying on single metrics — like accuracy or loss — without considering what those numbers represent in the real world.
AI performance metrics, especially quantitative ones, provide measurable indicators of how your model performs, but you need to pick the right ones based on task type, data distribution, and cost of errors. Here’s how to use them properly:
- Accuracy is just a starting point
- Precision, recall, and F1-score
- ROC-AUC for threshold-based classification
- Latency and throughput
- Statistical significance and model comparisons
1. Accuracy Is Just a Starting Point
Accuracy tells you how often your model gets the answer right. But it’s only reliable when your data has a roughly equal number of examples from each category.
For instance, if 95% of medical cases are healthy and your model always guesses “healthy,” it’ll still be 95% accurate but completely useless.
Use accuracy only when:
- Your dataset has a balanced mix of each type of outcome (like 50/50 spam vs. not spam).
- The cost of being wrong is about the same no matter the mistake.
In most real-world situations, especially with rare events or high-stakes decisions, accuracy alone can be misleading.
2. Precision, Recall, and F1-Score
These metrics help you understand how your model performs when the data isn’t evenly balanced, especially when wrong predictions have real consequences.
- Precision: When your model says that something is positive (like “this is spam” or “this is fraud”), how often is it right? Use precision when false alarms — like flagging something as spam when it isn’t — can cause problems.
- Recall: Out of all the real positive cases, how many did your model find? Use recall when missing a real case — like failing to detect actual fraud — is more dangerous.
- F1-score: A single number that balances precision and recall. Use the F1-score when both false alarms and missed cases matter equally, such as in healthcare or safety-critical applications. F1-scores range from 0 to 1 — a score above 0.8 is generally considered strong, while anything below 0.5 often signals poor performance.
These help you tune your model based on what matters most: catching more threats, reducing false alerts, or balancing both.
3. ROC-AUC for Threshold-Based Classification
Sometimes your model doesn’t give a yes-or-no answer — it gives a score, like “there’s an 80% chance this is fraud.” So, how do you know if those scores actually help you separate the real cases from the rest? That’s what ROC-AUC is for.
- Receiver Operating Characteristic (ROC) curve shows how well your model balances true positives and false positives at different cutoff points.
- Area Under the Curve (AUC) gives that balance a score between 0 and 1. Closer to 1 means the model is good at telling the difference between positive and negative cases.
Use ROC-AUC when:
- Your model predicts probabilities, not yes/no answers
- You need to decide where to draw the line for “positive” results
- Mistakes carry different costs depending on the use case
4. Latency and Throughput
Even the most accurate model won’t succeed if it’s too slow or can’t handle real-world demand.
- Latency measures how fast your model responds. It's like page load time. If your AI takes five seconds to return a result, users will notice and leave. Latency is critical for real-time use cases like fraud detection, customer support, or voice interfaces.
- Throughput measures how many predictions your system can handle at once. Think of it like how many cars a highway can support. It’s crucial for handling traffic at scale, like thousands of users shopping at the same time.
Use these metrics when:
- Speed affects the user experience
- You expect high-volume traffic
- You need to balance cost and infrastructure needs
A recommendation engine might be 99% accurate, but if it lags during checkout, it can hurt conversion and frustrate customers.
5. Statistical Significance and Model Comparisons
When you’re testing multiple models or tweaking versions, a 1% improvement in accuracy might look great — but is it real, or just random?
Statistical significance testing helps you tell the difference between genuine performance gains and noise. It adds rigor to your experiments, so you're not making decisions based on chance.
Common tests include:
- Paired t-test: Compares the performance of two models on the same dataset.
- McNemar’s test: Evaluates differences in classification errors between two models.
- Bootstrap methods: Estimate confidence intervals for performance metrics.
Use these methods when:
- You’re comparing models (old vs. new).
- You want to justify a model change to stakeholders.
- You’re optimizing for high-stakes use cases where small improvements matter.
Let’s say, you launched a new version of your recommendation engine that boosts conversions from 6.1% to 6.4%. A significance test can help prove whether that 0.3% gain is real and worth deploying.
Use Real-World Feedback To Complete the Performance Picture
Great metrics don’t always mean great experiences. Usability tests, surveys, and support logs often reveal what dashboards can’t: frustration, confusion, or unmet expectations.
Here are three qualitative signals that help validate whether your model is truly delivering value:
- Capture feedback from real users
- Audit for explainability and trust
- Link AI performance to business outcomes
1. Capture Feedback From Real Users
Engage directly with your users to understand how your AI performs in practice. Don’t just rely on backend metrics — run surveys, interviews, and feedback prompts to hear what users think and feel.
Are they frustrated with response quality? Do they trust the recommendations? This insight surfaces blind spots that performance scores miss.
Tools to use:
- Qualtrics or Typeform for gathering structured user opinions
- Lyssna or UserTesting for targeted qualitative testing
2. Audit for Explainability and Trust
Your AI’s outputs must be explainable, especially in high-stakes environments. Use interpretability tools to break down how the model made a decision. If users or stakeholders can’t follow the logic, they won’t trust or act on the results.
Tools to use:
- SHapley Additive exPlanations (SHAP): Based on cooperative game theory, it explains the contribution of each feature to a prediction in a consistent and locally accurate way.
- IBM AI Explainability 360: An open-source toolkit that provides multiple algorithms to explain machine learning models and predictions, especially for ensuring fairness and transparency in high-stakes use cases.
- Google What-If Tool: A visual, no-code interface that lets users probe model behavior under different scenarios — ideal for testing how changes in input data affect predictions. Great for debugging and identifying potential biases.
3. Link AI Performance to Business Outcomes
A successful model should help your business, not just hit technical goals. Make sure your AI’s performance connects to real outcomes — like more sales, better customer retention, or faster support resolutions.
If those numbers aren’t improving, it doesn’t matter if your model meets its benchmarks. Use A/B tests or user behavior tools to find out what’s truly making a difference.
Tools to use:
- Looker, Power BI, and Tableau: Business intelligence platforms that help visualize AI impact on key metrics like revenue, retention, or churn. Use them to connect model outputs to executive-level KPIs.
- Amplitude and Mixpanel: Product analytics tools designed to track user behavior and engagement. Ideal for understanding how AI-driven features influence real-world usage patterns and customer journeys.
- Optimizely: A/B testing and experimentation platform that lets you test the real-world impact of AI changes — such as different recommendation algorithms or chatbot variations — on business outcomes like conversion rates or satisfaction.
Monitor Continuously To Catch Drift
AI models don’t stay accurate forever. As data, user behavior, or business conditions evolve, your model’s predictions can quietly go off track, even if it passed every test at launch. This is known as drift.
There are two main types to watch for:
- Data drift: The input data your model sees in production changes over time. For example, a model trained on pre-pandemic customer habits might fail post-pandemic as behaviors shift.
- Concept drift: The relationship between input and output changes. Imagine a churn model where customer behavior patterns stay the same, but the reasons they leave change — your model’s logic may no longer apply.
Left unchecked, drift leads to poor decisions, lost revenue, and declining trust in your AI systems.
What should you monitor? To catch drift before it becomes a problem, track both technical metrics and business signals:
- Prediction distribution: Are your model’s outputs skewing over time?
- Input feature distribution: Are key input variables shifting from training norms?
- Performance KPIs: Are precision, recall, or F1-score dropping unexpectedly?
- Business metrics: Are conversions, revenue, or user satisfaction slipping despite no product changes?
Set thresholds and alerts so your team knows when to investigate. A drop in accuracy might not always signal drift — but consistent deviation in multiple indicators is a red flag.
Pandey warns that “overengineering monitoring kills more AI projects than underperformance.” His team favors lightweight, business-first frameworks — pairing tools like Evidently AI and Arize AI with simplified “business health scores.”
These red/yellow/green dashboards consolidate key technical signals into executive-level indicators, making it easier for non-technical teams to act fast when drift hits.
How To Measure AI Performance: Conclusion
You can have the sharpest model on paper and still miss the mark in production if your performance strategy ignores context, business needs, or how real users actually interact.
If your AI still “looks great” but feels off, it might be time to bring in experts who know how to measure what matters. The right agency won’t just optimize your model — they’ll align it with your goals, your users, and your bottom line.
![]()
Our team ranks agencies worldwide to help you find a qualified partner. Visit our Agency Directory for the top AI companies, as well as:
- Top AI Companies in Boston
- Top AI Consulting Companies
- Top AI Automation Agencies
- Top Generative AI Companies
- Top AI Marketing Companies
Our design experts also recognize the most innovative design projects across the globe. Visit our Awards section for the best & latest in design.
AI Metric Performance: FAQs
1. What are the most important metrics for AI model performance?
Key metrics include accuracy, precision, recall, F1-score, latency, and throughput. Each serves a different purpose — accuracy gives overall correctness, precision and recall handle false positives or negatives, F1-score balances both, while latency and throughput measure speed and scale. The best metric depends on the use case.
2. How do I know if my AI model is production-ready?
A production-ready model performs well on real-world data, responds quickly, and handles high volumes reliably. It should also be explainable, resistant to drift, and easy to monitor or roll back if needed. Frameworks like Google’s ML Testing Rubric can help you evaluate readiness.
3. How do performance metrics help retain clients?
Clear metrics help build trust by showing what’s working and why. They support pricing decisions, uncover improvement opportunities, and offer data-driven proof of success — like linking a better F1-score to reduced fraud or faster predictions to improved user satisfaction.