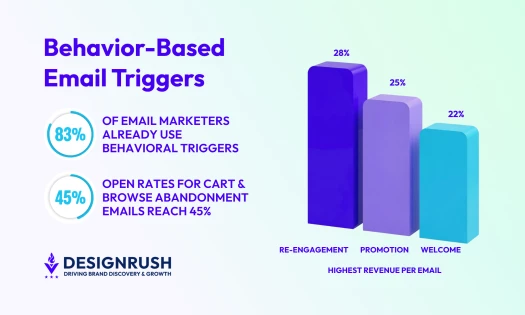

You might want to give more attention to winning back inactive subscribers because, in our survey, 28% of respondents named re-engagement emails their strongest revenue generator per send (narrowly ahead of promotional emails at 25%).
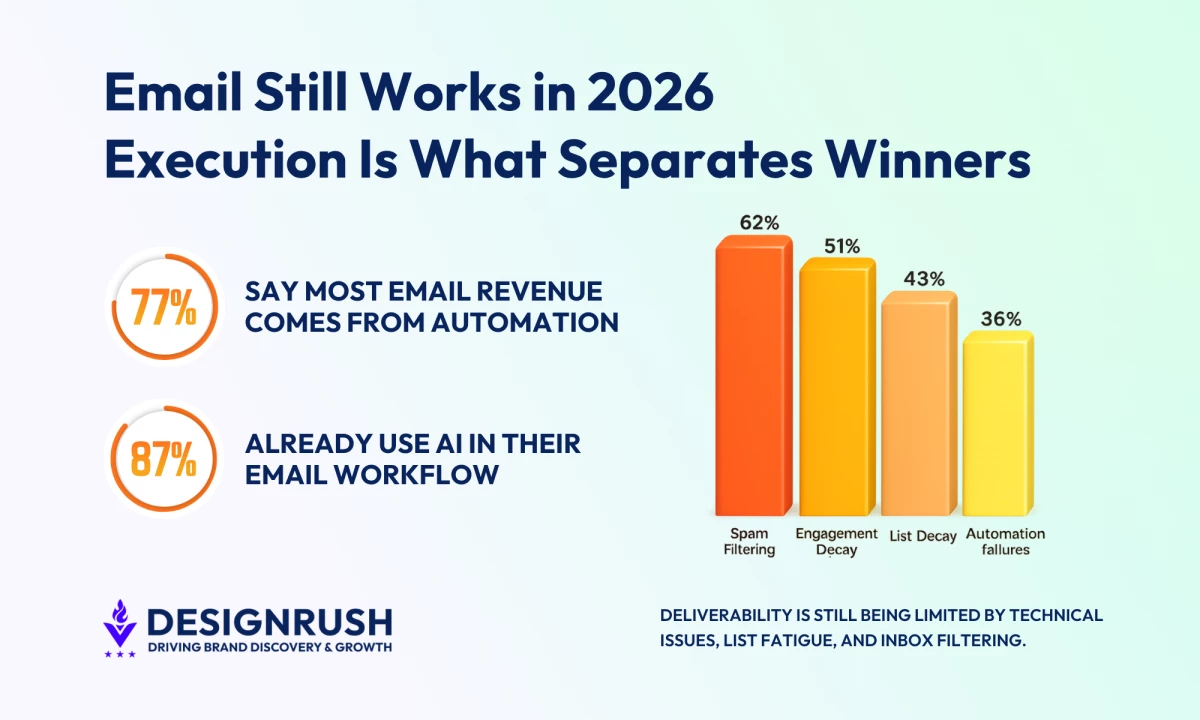
Tuesday was the most frequently cited day for strong engagement, while 9 a.m. to noon was the leading time slot. But reaching subscribers is a challenge, with spam filtering causing deliverability problems for 62% of respondents.
Drawing on DesignRush’s April 2026 survey of 99 marketing professionals and industry benchmarks, these email marketing statistics reveal what drives results and what gets in the way.
Email Marketing Statistics 2026: Key Findings
- 87% of respondents use AI in their email workflow, while 43% attribute 50%–75%of email revenue to automated flows.
- Tuesday leads for engagement, cited by 50% of respondents, while 9 a.m.–noon tops the time slots at 55%.
- 72% identify value-led content as their best-performing copy approach, compared with 28% who favor promotional copy.
Email Marketing Trends and Benchmarks for 2026
Our survey offers a snapshot of the state of email marketing in 2026, highlighting where marketers see stronger returns and where they still struggle:
- Re-engagement deserves a larger role. More respondents ranked re-engagement first for revenue per email than any other category, although it led promotional sends by just three percentage points.
- Automation accounts for a substantial share of revenue. For 43% of respondents, automated flows generate 50%–75% of total email revenue; another 14% attribute more than 75% to them.
- Personalization is delivering measurable gains. Some 71% of respondents report at least a 20% engagement lift from dynamic, personalized content.
- Deliverability remains a persistent obstacle. Despite 96% monitoring deliverability at least monthly, 62% cite spam filtering as a challenge.
- Higher send frequency brings mixed results. Only 25% report better engagement when sending more often, while 35% see a decline.
2026 Email Marketing Benchmarks
These email marketing benchmarks combine findings from DesignRush’s 2026 survey with an external automation benchmark. Use them to guide testing and compare priorities, but note that results will vary by audience and campaign type.
| Area | Finding | Source |
| Revenue per email | Re-engagement ranked first for 28% of respondents, followed by promotional emails at 25%. | DesignRush, 2026 |
| Best-performing day | Tuesday was cited by 50% of respondents as a strong engagement day. | DesignRush, 2026 |
| Best-performing time | The 9 a.m.–noon window led engagement responses at 55%. | DesignRush, 2026 |
| Deliverability | 62% of respondents cited spam filtering as a challenge. | DesignRush, 2026 |
| Personalization | 71% reported at least a 20% engagement lift from dynamic, personalized content. | DesignRush, 2026 |
| Automated email conversions | Automated emails recorded 2,361% higher conversion rates than scheduled campaigns. | Omnisend, 2025 report |
eCommerce Email Marketing Benchmarks: Campaigns vs. Automation
For comparison with actual campaign results, Omnisend’s 2026 benchmark analysis covers more than 20 billion campaign emails and 470 million automated sends across 27,000+ brands during 2025.
| Metric | What it measures | Scheduled campaigns | Automated emails |
| Click-through rate | Percentage of delivered emails that generated a click | 0.74% | 4.66% |
| Conversion rate | Purchases attributed to email relative to delivered emails | 0.08% | 1.49% |
| Revenue per email sent | Attributed revenue divided by emails sent | $0.155 | $3.41 |
| Unsubscribe rate | Percentage of delivered emails resulting in an unsubscribe | 0.20% | 0.59% |
Source: Omnisend, published May 2026; data from 2025. Revenue is in USD; conversions refer to purchases, and percentage rates use delivered emails as the denominator.
When using email marketing industry benchmarks, compare campaigns and automated sends separately, accounting for audience intent and the point in the customer journey.
Email Marketing Benchmarks by Industry
A figure that covers all industries can hide real differences in engagement, so use your industry’s benchmark as a starting point.
| Industry | Median open rate | Median click rate | Median unsubscribe rate |
| Business and finance | 43.34% | 2.37% | 0.16% |
| Nonprofits | 52.38% | 2.90% | 0.19% |
| Higher education | 43.98% | 2.15% | 0.10% |
| cEommerce | 32.67% | 1.07% | 0.18% |
| All industries | 43.46% | 2.09% | 0.22% |
Source: MailerLite, December 2024–November 2025 data. Figures are medians across campaigns; Apple’s Mail Privacy Protection can inflate recorded open rates.
What These Findings Mean for Your Business
Here’s how different businesses can apply the findings. These recommendations draw on the overall results, not separate findings for each group.
- Small businesses: Start with a welcome or abandoned-cart flow and track revenue per recipient before adding more sequences.
- Agencies: Test timing and re-engagement against each client’s existing performance rather than applying benchmarks across all accounts.
- Enterprises: Check deliverability across high-revenue flows and test personalization against a control group before expanding its use.
Email remains worth that investment, as shown bby GetResponse’s survey, where 26.9% of marketers pointed to email as their highest-ROI channel over the previous six months, ahead of websites and blogs at 22.7%.

43% of Respondents Attribute 50%–75% of Email Revenue to Automation
Automated email flows have crossed a threshold and, for most teams in DesignRush’s survey, they are a primary revenue driver inside the email program.
These email marketing stats show how much revenue respondents attribute to automated flows and where triggered sends outperform scheduled campaigns.
- Why triggered sends outperform broadcast by up to 2,361%
- Which tool categories are powering email programs
- The underestimated case for re-engagement
- Where email automation is heading next
82% of respondents use behavioral triggers at least to some degree, with 37% deploying them extensively.
Respondents’ revenue figures show why automation deserves attention when assessing email marketing ROI:
- 43% attribute 50% to 75% of total email revenue to automation
- 20% attribute 24% to 50% of email revenue to automation
- 14% attribute 75%+ of total email revenue to automation
Together, 57% of respondents attribute at least half of their email revenue to automation.
Why Triggered Sends Outperform Broadcast by Up to 2,361%
Omnisend’s 2025 eCommerce report provides further context, with eCommerce email marketing statistics showing how automated sends compare with scheduled campaigns:
- Automated emails drove 37% of all email-generated sales while making up just 2% of email volume.
- Automated messages delivered 52% better open rates, 332% higher click rates, and 2,361% higher conversion rates than regular campaigns.
Within the DesignRush data, respondents identified the clearest performance advantages of triggered sends over broadcast:
- Opens: 43%
- Conversions: 35%
- Clicks (measured through email CTR): 21%
The conversion advantage is particularly significant. Opens can reflect habit or curiosity. Conversions reflect intent and relevance, which is precisely what behavioral triggering is designed to capture.
Which Tool Categories Are Powering Email Programs
The strongest investment is going into tools that help teams measure performance, improve efficiency, and protect revenue:
- Analytics tools: 60%
- AI tools: 57%
- Deliverability tools: 52%
- ESP tools: 43%
For our hands-on comparison of the platforms behind that 57%, see the top email marketing AI tools roundup.
Taken together, the data shows that budget is moving toward tools that make email programs smarter, more measurable, and more resilient.
The Underestimated Case for Re-Engagement
One finding deserves more attention than it typically gets in email strategy discussions: re-engagement emails were identified by the largest share of respondents as the funnel stage generating the most revenue per email sent.
- Re-engagement: 28%
- Promotional sends: 25%
- Nurture emails: 24%
- Welcome emails: 22%
Broadcast campaigns dominate planning cycles and creative investment.
Re-engagement’s narrow lead makes win-back campaigns worth testing for revenue opportunities among inactive subscribers.
For teams that haven't built robust re-engagement sequences, or that sunset contacts too aggressively, there is likely recoverable revenue sitting in lapsed subscriber segments.
Where Email Automation Is Heading Next
One of the clearest email marketing trends for 2026 is that triggered email is already responsible for a large share of email-driven revenue, while leading teams are starting to build beyond email alone.
How to improve email automation ROI is now a top operational priority.
Jackie Palmer, VP of Product Marketing at ActiveCampaign, says the strongest programs now connect email with channels such as SMS and WhatsApp instead of managing each one separately. She describes the goal as creating “a single, orchestrated conversation.”
That means a customer’s actions in one channel can shape what happens in another.
An email click, a purchase, a missed message, or a transactional update can all act as signals that determine the next touchpoint, the next channel, and the next message.
In this setup, email still plays a central role because it carries more context and storytelling. But it works as part of a broader system that responds to customer behavior in real time.
According to Palmer, this kind of cross-channel automation will define best-in-class programs in 2026.
ActiveCampaign’s example of Spark Joy New York shows the upside: triple the sales, 85% less campaign production time, and consistent $10,000 months from only three targeted emails per week.
AI Is Already Part of the Email Workflow for 87% of Marketers
87% of respondents use at least one AI tool in their email workflow. That means that AI has become a mainstream part of email production rather than novelty or an emerging experiment.
The remaining 13% who use none are now the outliers.
Where adoption is concentrated tells a more specific story:
- Subject line optimization: 69%
- Content generation: 63%
- Send time optimization: 47%
- Behavioral prediction: 31%
The pattern reflects where AI is easiest to implement and measure, namely, production and optimization tasks that sit close to campaign output.
Vendor-reported results suggest the time savings can be meaningful at that level of use.
An ActiveCampaign-commissioned survey found that marketers using AI reported saving an average of 13 hours per week.
Behavioral prediction, which sits further upstream and requires more sophisticated data integration, shows notably lower adoption despite having arguably greater commercial potential.
Where AI Personalization Appears To Create the Most Value
The personalization data makes the gap between production and behavioral prediction worth closing.
Among the most important email marketing trends for 2026, personalization stands out because 71% of respondents report a 20% or greater engagement lift from dynamic, personalized content versus non-personalized sends:
- 53% report a 20% to 50% lift
- 18% report a 50%+ lift
- 13% report no lift or are not using personalization
A 50%-plus engagement lift is a meaningful performance differential, and the teams achieving it are using AI to improve message relevance and timing, rather than merely speeding up copy production.
- AI that helps marketers send more emails faster is a productivity tool.
- AI that helps marketers send more relevant emails is a revenue tool.
Spam Filtering Remains the Top Deliverability Problem for 62% of Marketers
Deliverability gets plenty of attention from respondents, yet inbox placement remains far from assured.
96% of respondents monitor deliverability at least monthly.
That is near-universal attention to a metric that still shows alarming gaps in outcome.
- More than one in ten respondents (11%) said fewer than 50% of their emails reach the primary inbox.
- Just 35% said they achieve inbox placement between 86% and 95%.
For the operational playbook on the problems below, see how to improve email deliverability in 2026.
The Problems Keeping Emails out of Inboxes
The causes are well-documented in the data:
- Spam filtering: 62% of respondents
- Engagement decay: 51%
- List decay: 43%
- Authentication failures (SPF, DKIM, DMARC): 36%
Only 4% of respondents don’t monitor deliverability, but spotting problems is only the first step toward fixing them.
Teams know there is a problem, although few have truly solved it.
What Poor Inbox Placement Actually Costs You
Poor inbox placement can limit the return on the time and money spent creating email campaigns.
Klaviyo reports average revenue per recipient of $0.11 for standard email campaigns, compared with $1.94 for automated flows. Welcome series average $2.65 per recipient, while abandoned-cart emails average $3.65.
These benchmarks don’t tell you exactly how much revenue a missed email costs. They do show why deliverability deserves particular attention in automated flows, where each send can carry more revenue potential.
When automation generates a large share of email revenue, protecting delivery across those flows becomes a revenue priority.
Spam filtering is the dominant challenge, but it is also the most responsive to structural fixes:
- Authentication protocols
- Engagement-based list segmentation
- Sunset policies for disengaged contacts
Teams still losing a meaningful share of sends to spam folders are leaving the most tractable improvements on the table.
Tuesday Morning Still Wins While Send Frequency Varies by Audience
DesignRush's 2026 Email Marketing Benchmark Survey found that Tuesday is the strongest engagement day, cited by 50% of respondents.
The full day-of-week pattern looks like this:
- Tuesday: 50%
- Thursday: 40%
- Wednesday: 39%
- Monday: 33%
- Friday: 24%
- Saturday: 11%
- Sunday: 6%
Where Email Engagement Peaks by Time of Day
The strongest engagement window is clearly in the morning:
- Morning (9:00-12:00): 55%
- Early afternoon (12:00-15:00): 24%
- Evening (18:00-21:00): 20%
Why More Sends Does Not Reliably Mean Better Results
Another one of the clearest email marketing trends for 2026 is that higher send frequency does not automatically create stronger engagement.
The most common send cadence among respondents is:
- Several times per week: 38%
- Weekly: 19%
- Daily: 18%
When teams test different send frequencies, the results are unresolved:
- 35% see engagement decline when they send more
- 25% see engagement improve when they send more
- 34% report mixed results
ZeroBounce reports similar results that more opportunities to appear do not automatically translate into stronger results:
- 46% say they consistently open brand emails when the content feels relevant.
- 43% unsubscribe because brands email too often.
What Actually Drives Frequency Tolerance
- Subscribers who find emails useful will tolerate higher cadences.
- Subscribers receiving generic or repetitive content will exit faster regardless of volume.
The teams seeing engagement improve when they send more are likely also sending content worth reading. The teams seeing it fall are asking more of subscribers than their content justifies.
Value-Led Content Is Setting the Tone for Email Strategy in 2026
DesignRush found that value-led content is the top-performing copy approach by a clear margin:
- Value-led content: 72%
- Promotional copy: 28%
The findings favor email marketing ideas that give subscribers something useful, rather than simply pushing an offer.
Where Interactive Email Still Looks Underused
According to DesignRush’s survey, interactive email elements represent a low-competition area with a measurable subscriber appetite.
There are some good interactive email examples that show what these elements can look like in practice, but many businesses still rarely use them:
- Often: 33%
- Rarely: 45%
- Never: 21%
That means 66% of respondents are largely bypassing this highly underutilized tool.
Now here’s where it gets interesting:
- 60% of people are likely to engage with an interactive email.
- More than 50% say they like being able to interact with content directly inside the message.
Put together, the numbers suggest marketer adoption is still lagging behind subscriber interest, which represents a tangible opportunity for teams willing to test it deliberately.
GDPR and CCPA Now Shape How 81% of Businesses Collect Email Subscribers
Two regulatory regimes are now shaping how email lists are built, and the effects are showing up in both acquisition and retention.
- In California, businesses already have to provide notice at or before data collection, honor consumer opt-out rights, and avoid consent flows that rely on dark patterns.
- In Europe, regulators are still actively enforcing consent standards, including a €900,000 CNIL fine in May 2025 against SOLOCAL MARKETING SERVICES for commercial prospecting without valid consent.
The DesignRush data shows the effect of that pressure in practical terms.
- 81% of respondents said GDPR or CCPA has changed how they collect email subscribers
- 78% said privacy concerns have increased unsubscribes or reduced list quality
It is showing up at the top of the funnel, where brands collect subscribers, and further down the funnel, where privacy concerns affect retention and list health.
For the full breakdown of what GDPR, CCPA and CAN-SPAM now require in practice, see our email marketing compliance guide.
Why Subscriber Quality Is Harder To Sustain
The mechanics of building a healthy email list have changed for good, and that broader shift also shows up in Mailchimp’s 2026 Art of the Opt-In research, which argues that brands need to move away from passive list growth and focus more on healthier audiences and measurable revenue.
Mailchimp found that:
- 50% of consumers fear an immediate message surge after signing up.
- 44% say messages felt spammy.
- 42% report irrelevant communication.
Teams still prioritizing subscriber acquisition volume over subscriber quality are likely accumulating lists that perform worse over time and cost more to maintain.
Where Accessibility Fits Into The Quality-First Shift
Among respondents who apply WCAG standards in their email design, 61% report measurable engagement uplift. 34% always apply accessibility standards; 9% never do.
If privacy rules are raising the bar for earning a subscriber's consent, the emails sent afterward need to be easier to read, navigate, and act on.
The most important takeaways you get from this data are that:
- Privacy rules are making permission more important.
- Accessibility may help you get more value from that permission once you have it.
- Both push email strategy away from volume and toward quality, trust, and usability.
Email Marketing Statistics 2026: The Channel is Fine — The Execution Gap Is Not
Email marketing is struggling where teams are still running 2020 playbooks against 2026 subscriber expectations.
These email marketing stats point to five priorities:
- Deliverability that actually gets fixed, not just monitored.
- Automation treated as a revenue infrastructure, not a time-saving convenience.
- Consent earned through clear value, not extracted through low-friction tactics.
- Content that leads with usefulness instead of an offer.
- AI deployed where it improves what subscribers receive, not just how fast teams produce it.
None of that requires a platform overhaul or a larger budget, but a clearer set of priorities and the discipline to stop optimizing the wrong things.
For practitioners going deeper, our best email marketing conferences in 2026 lists where the field is meeting next.
| DesignRush’s Email Marketing Benchmark Survey surveyed 99 email marketing professionals in April 2026. Respondents included agency professionals (53%), small business owners (18%), enterprise marketers (11%), and in-house teams (10%). Annual email send volumes ranged from under 10,000 to over 1 million. |
Our team ranks agencies worldwide to help you find the right fit. Visit our Agency Directory for the top email marketing agencies, as well as:
- Top UI/UX Design Agencies
- Top Conversion Rate Optimization Agencies
- Top Content Marketing Agencies
- Top Digital Strategy Agencies
- Top Email Marketing Companies In Houston
Looking for visual inspiration to use in your email campaigns? Explore our Design Awards, including recent winners recognized for standout video design.