Mobile shapes how people learn, work, shop, talk, and relax. It sits at the center of daily life, and the companies that understand real usage patterns move faster, build smarter, and win bigger.
Mobile App Development Statistics: Key Findings
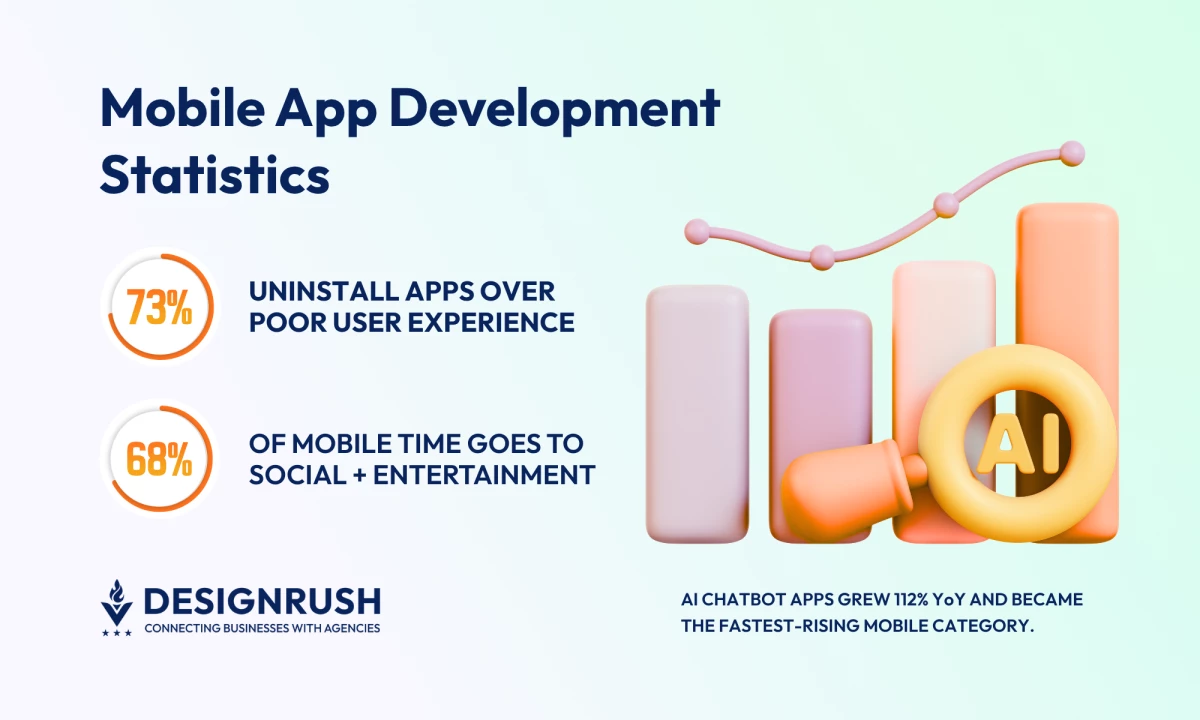
- Apps must earn their place: 73% uninstall apps for poor UI, and 90% check privacy and security before using one.
- Weekly users are 90% more likely to stick long-term, making repeat value non-negotiable.
- US leads with $52B in-app spend, while India grows smartphones at 6.89% CAGR and expands its billion-user base.
How To Interpret and Use These Mobile App Stats
These mobile app development statistics help you spot where demand grows, where users spend their time and money, and where your product roadmap earns the highest return.
Use these insights to sharpen your roadmap, choose the markets that reward you fastest, and focus engineering, marketing, and monetization around where users truly commit.
This is how you translate raw data into stronger growth decisions.
Market Growth: Mobile Economy Heads to $673.8B by 2027
You operate in one of the most powerful technology markets on the planet.
Growth accelerates, user attention concentrates on mobile, and AI pushes the next cycle of product creation.
Strategy and prioritization decide winners.
Key Insights
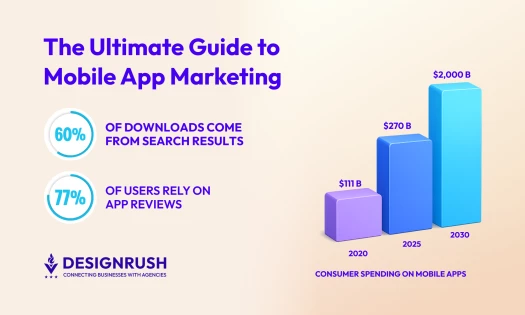
- Mobile app revenue is forecasted to grow from $522.7 billion in 2024 to $673.8B in 2027.
- There are 8.66 billion mobile subscriptions in 2025 and the number passes 9.4 billion by 2030.
- Americans spend 5h and 16 minutes per day on their phones.
- 69% of Gen Z are addicted to their phones and 44% couldn’t go a full day without one.
- Average time spent on the phone during work is 3 hours.
- AI chatbot apps became the fastest-growing app subgenre in 2024, showing a 112% year-over-year growth.
What This Means For You
Mobile attention remains the most valuable real estate in the digital economy. Products that deliver ease, speed, and emotional utility win.
User Behavior: 5h 16m Daily Screen Time With Gen Z at 6h 17m
Users download apps with purpose and delete without hesitation.
Trust, clarity, and speed control retention.
Conversion and Install Performance
Games is the biggest category in terms of the most available apps on the Apple Store (11.86%), followed by Business (10.11%), Utilities (9.73%), and Education (9.56%).
But let’s see what really matters in the categories, the highest vs. lowest CVR:
Download Volumes
Let’s compare the biggest digital storefronts based on Sensor Tower data:
See which apps dominate downloads on iOS vs. Android:
Google Play Store Most Downloaded Apps
App Store Most Downloaded Apps
Behavior Signals
- 64% of Gen Z TikTok users said they have used the platform as a search tool.
- In December 2024, YouTube led all social platforms in the US with a 76% mobile audience reach, ahead of Gmail (69%) and Facebook (68%) in second and third place.
- Appdome found that 55% percent of consumers prefer mobile apps over the web for brand interaction.
- 65.6% of users interact with 3 to 10 apps daily, according to Appdome.
- 73% of mobile users frequently or occasionally stopped using an app because of frustrating visual or navigation issues, such as non-functional buttons or layout problems
- The same Appdome research finds that 90% of users check privacy and security before using an app and 17% avoid apps that feel unsafe.
Uninstall Drivers
The top reasons for deleting mobile apps are:
What This Means For You
Growth favors apps that remove effort, build trust, and surface value instantly.
Design and onboarding shape destiny.
As Daniel Kodam, Founder & CEO of D-Kode Tech, puts it:
“We believe that winning over users demands easy experiences and effective user interfaces. UX/UI is the backbone of a strong application. We start with deep user research, design for intuitive navigation, and leverage personalization to keep every app feeling relevant and user-friendly.”
Modern users expect clarity, personalization, speed, and reward products that respect their attention.
Monetization Models: Subscriptions Drive ~40% of App Revenue
Mobile economics favor models that blend accessibility with optional depth.
Free entry still wins install volume. Subscriptions, in-app purchases, and advertising capture value across user segments.
The most profitable products build monetization into the experience rather than bolting it on.
Platform Spending
Ad spend behavior looks wildly different by platform:
The most effective ad formats in mobile are:
User Behavior
- iPhone users spend twice as much per app as Android users.
- 97% of mobile apps are free to download, proving the freemium model still dominates.
- 442 apps and games released in 2024 closed out the year with $1 million or more in gross revenue.
- Subscriptions generate nearly 40-44% of app revenue.
- Sensor Tower’s report found that free-trial conversion fell to 37.3% in 2024 due to subscription fatigue.
- Social media ad spending reaches $275.98 billion in 2025.
- Mobile advertising market to grow at 21.1% CAGR during 2025-2032
- In 2024, Apple’s App Store captured an estimated 63-65% of total global app store consumer spend leaving ~35% to the Google Play Store (and other Android app stores).
- Mobile games represent 64% of app revenue mostly through in-app purchases (IAP) of game items/currency.
- Video streaming and social apps generated almost $12 billion each from in-app purchases in 2024, according to Sensor Tower data.
What This Means For You
Treat monetization as a ladder:
- Start free to eliminate adoption resistance.
- Layer value with subscriptions, premium features, and in-app purchases.
- Use video ads to convert high-intent users without degrading experience.
- Optimize pricing by region and device.
You win by aligning value with usage patterns, not by forcing commitment early.
Developer Trends: Swift and Kotlin Power Most New Builds
Technology choices shape your speed, cost, and ability to scale.
- Native development continues to dominate when performance, polish, and reliability matter most.
- Cross-platform development accelerates delivery when time to market is the priority.
But the real shift is how AI is changing the development workflow and product expectations.
“By providing drag-and-drop UI components and connectors, developers and even non-technical users can incorporate AI functionalities into their apps,” explains Appery.io CEO Alexander Antsypov.
Platforms that lower technical barriers accelerate testing, shorten product cycles, and widen who can build, fueling the next wave of mobile innovation.
Language and Framework Adoption
Native languages still dominate app development:
Key Insights
- In 2024, about 15% of new apps were built using cross-platform tools.
- Cross-platform apps represent 6% of total downloads and 9% of revenue.
- Flutter and React Native are the two leading cross-platform frameworks, with Flutter used by ~46% and React Native by 35% of surveyed developers.
- 65% of enterprises rely on mobile backend-as-a-service platforms.
Team Challenges
Teams are already bracing for a massive shift: 79% of developers expect AI to reshape development in the next five years.
Before you lock in your stack, understand the real-world challenges engineering teams navigate every day:
What This Means For You
You shorten time to value by matching your architecture to your product strategy.
- Use native when experience is your differentiator.
- Use cross-platform when speed and testing matter more than raw performance.
- Embed AI into your engineering workflows and product features now.
Teams that ship faster and learn faster win the next cycle.
Retention Metrics: Only 2-4% Users Remain by Day 30
Acquisition brings users through the door. Retention builds real businesses.
Retention Benchmarks
Let’s go through the average app subscription retention rates:
Key Insights
- AppsFlyer found that users who engage weekly are 90% more likely to stick around long-term.
- As AppsFlyer suggests, a healthy DAU/MAU ratio is 20-25%.
- Only 16% of users engage with apps daily, with news apps seeing the highest at 32%.
- On iOS, over 23% of app subscribers who don’t renew subscription cite billing errors as the reason.
What This Means For You
Your product roadmap must center around repeat value:
- Weekly value triggers
- Personalization and habit loops
- Progress and rewards systems
- Clean billing and frictionless subscription flows
Reduce churn. Scale loyalty.
Platform Landscape: iOS Leads Spend, Android Leads Global Reach
Your platform strategy and regional strategy must work together.
- Android brings scale.
- iOS brings higher spending power.
Markets adopt and pay differently. A single global monetization plan leaves money on the table.
Platform Dynamics: iOS vs. Android
Android dominates global device share and app volume, but iOS wins where it counts: spending power and conversion quality.
Additional Data
- Android has over 3.5 billion active users.
- Google rejected the publication of 2.36 million policy-violating apps on Google Play and banned over 158,000 developer accounts that tried to publish harmful apps.
- Only about 46,000 new apps were launched on Google Play in April 2025.
- Google Play consumer spend grow ~7.3% from 2023.
Geographic Performance
Mobile demand keeps climbing, but each region fuels growth differently:
Additional Data
- Number of smartphone users in the United States in 2025 is 320 million.
- The smartphone market in India is projected to have an annual growth rate of 6.89% from 2025 to 2030 (CAGR 2025-2030).
- The average volume per person in the Smartphones market in India is expected to be 0.142 pieces in 2025.
- A total of 1.12 billion cellular mobile connections were active in India in early 2025.
- China and the United States were the leading countries with top downloads both for applications and games in App Store in 2024.
What This Means For You
Launch where value concentrates first.
- iOS-first wins in premium markets like the United States, Europe, and East Asia.
- Android-first captures emerging markets and scale plays.
Localize pricing, payment methods, and content. A one-size-fits-all mobile strategy is simply a missed growth opportunity.
Future Outlook: AI App Adoption Climbs 112% YoY
Mobile evolves into a multi-modal environment where intelligence drives interaction.
Growth and Behavior
- Sensor Tower predicts that consumer spending on mobile apps grows at 11.1% CAGR through 2030, while mobile gaming grows at 4.2%.
- 55% of consumers expect businesses to integrate bots or virtual assistants into their experience.
- 55% expect AR or VR capabilities, and 59% expect AI as part of the journey according to Sensor Tower.
- Voice assistant applications are gaining traction, accounting for a market share of around $6 billion and expected to grow at a CAGR of 30.8% from 2025 to 2034.
- The number of monthly active users of AR experiences on mobile devices is expected to rise to 1.19 billion by 2028.
- Companies should be prepared for a potential 25% decline in mobile app usage due to AI assistants that are likely to replace apps across different functions.
What This Means For You
The definition of an “app” is expanding.
Traditional screens are becoming one of many touchpoints. Voice workflows, ambient intelligence, and AI copilots are beginning to replace manual interactions.
Your product strategy now requires:
- Automation first mindset: Every key action needs an accelerated or automated alternative
- Voice pathway for core tasks: Search, support, and key workflows must work hands-free
- AI-led personalization: Dynamic content, adaptive workflows, predictive recommendations
- Multi-modal delivery: Mobile, web, AR layer, voice interface, connected devices
- Retention through intelligence, not notifications: Smart nudges outperform generic reminders
- Lifecycle monetization: Subscriptions, micro-value unlocks, AI-powered premium tiers
Build for a world where your user expects the right action before they ask for it.
That is the competitive edge going forward.
![]()
Our team ranks agencies worldwide to help you find a qualified partner. Visit our Agency Directory for mobile app development companies:
- Top Software Development Companies
- Top Android App Development Companies
- Top iPhone App Development Companies
- Top Offshore Software Development Companies
- Top AI App Development Companies
Our development experts also spotlight the most groundbreaking app projects from around the world. Visit our Awards section to explore the best in app development.
App Development Statistics FAQs
1. What matters most when building a successful mobile app today?
Strong onboarding, fast iteration, and clear user value. Teams that move quickly, learn from real behavior, and deliver frequent improvements build lasting adoption. AI boosts development speed and personalization, so weave it into both product and workflow.
2. How do users decide which apps stay on their phone?
Users keep apps that save time, remove effort, or entertain without friction. Slow performance, confusing navigation, intrusive ads, and weak onboarding send them away fast. Trust, clarity, and repeat value earn loyalty.
3. Which monetization model works best for mobile apps?
Freemium attracts users. Subscriptions, in-app purchases, and premium tiers capture value. Monetization succeeds when pricing feels fair, unlocks real utility, and appears gradually as users see value.