Budgeting a mobile app isn’t about guessing a big number and hoping it lands. It’s mapping business outcomes to the few things that measurably move them, and funding those first.
Mobile App Development Budget: Key Points
- The average data breach cost businesses $4.88 million in 2024, making early investment in compliance and security cheaper than paying fines or losing customer trust.
- Teams that don’t reserve 15% to 25% of the initial build per year for maintenance often find OS updates, bug fixes, and accessibility laws consuming their roadmap.
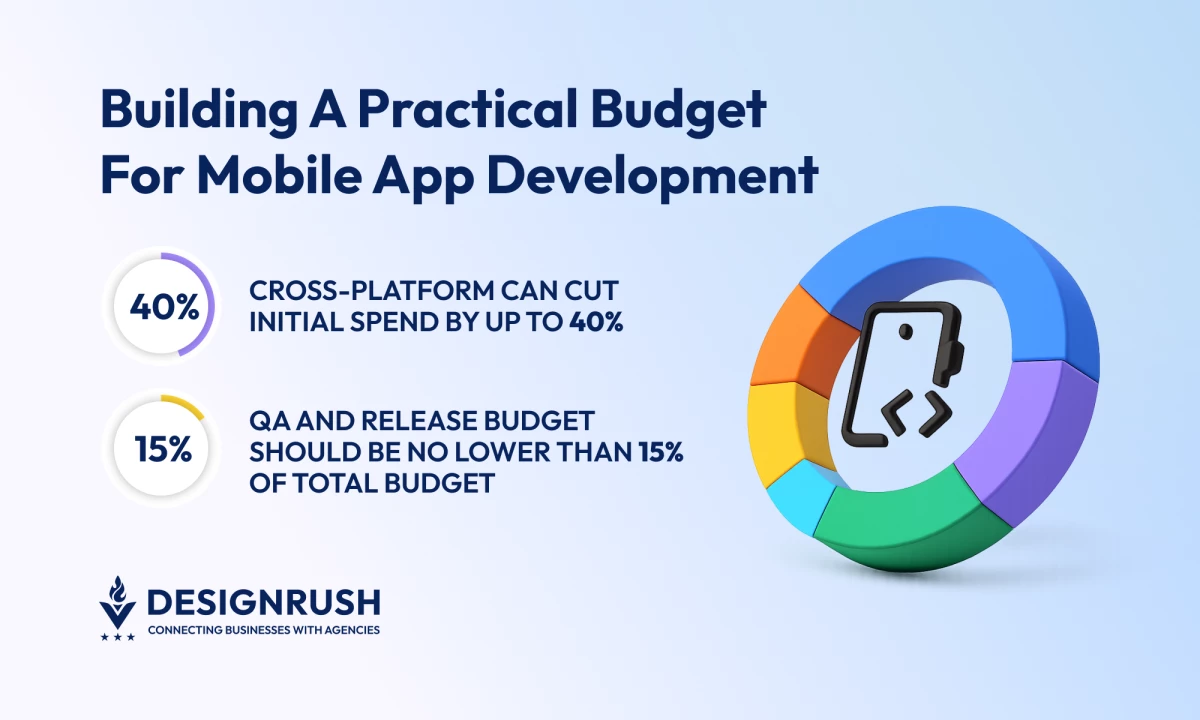
- Cross-platform can cut initial spend by up to 40% but device-heavy or animation-rich apps may still save long-term with native builds.
Mobile App Development Budget: An Overview
Top companies treat their mobile budget as an investment tied to outcomes, not just a pile of invoices.
I’m going to give you a pragmatic way to turn business goals into a mobile budget you can defend to a CFO and actually deliver against.
The Bridge Between Business Goals and Budget
We’re not just using our phones in 2026; we’re living in them. The average U.S. adult racks up nearly 6.5 hours of daily screen time, and most of that time is swallowed by apps. Mobile isn’t a side channel anymore; it’s the main stage.
So, you see the numbers and know your customers are already spending hours a day within mobile ecosystems. The question isn’t should you go mobile, but how do you fund it in a way your CFO will actually back?
Let’s walk through a first-app example to show how business goals translate into mobile app features, requirements, and budget:
Business Goal: Enter the app marketplace to increase customer engagement and reduce reliance on web-only interactions.
KPI: Achieve 5,000 monthly active users (MAU) within the first six months of launch.
User Journey: Deliver a simple flow where new users can create an account, explore your core product catalog, and complete their first purchase in under five minutes.
Features Required:
- Basic sign-up and login (with social sign-on to cut friction)
- Product browsing (categories, search, filters)
- Simple checkout with card payments
- Push notifications for order confirmation and updates
Non-Functional Requirements (NFRs):
- Smooth performance on mid-range Android devices (since you’ll launch globally)
- PCI-compliant payment handling
- Basic analytics to track funnel drop-off (signup → browse → checkout)
Cost Buckets Impacted:
- Product & user experience (designing intuitive catalog navigation and checkout flow)
- App Engineering (building the iOS/Android or cross-platform base)
- Backend & DevOps (integrating with payment gateways and your product database)
- QA & release (testing across devices and OS versions)
- Security & compliance (ensuring payment data is handled safely)
Instead of pitching this to the CFO as “we need $200k to build an app,” you can frame it as: “We need $200k to deliver a mobile channel that will onboard 5,000 customers in six months, open up new engagement levers like push notifications, and reduce friction in checkout.”
By tying cost directly to a measurable business outcome, the first budget for mobile won’t feel like a gamble — it feels like a growth investment.
Cost Drivers Every App Development Team Should Understand
These choices set the foundation for your app’s timeline, quality, and total cost of ownership.
Get them right, and your budget becomes predictable and defensible. Get them wrong, and you’ll be fighting overruns before you even launch.
Budget Stack (% of Initial Build)
Every app budget breaks down into predictable buckets. Think of them as your cost spine: the major categories that soak up spend whether you’re building a minimum viable product (MVP) or an enterprise-grade product.
The percentages shift depending on complexity and regulation, but the budget distribution for mobile app development stays surprisingly consistent:
| App Development Bucket | What's Inside | Typical Budget Range |
| Product & UX | Discovery, flows, UX/UI, copy | 10% to 20% |
| App engineering | App code, integrations, state management | 35% to 50% |
| Backend & DevOps | APIs, authorizations, CI/CD, observability | 10% to 20% |
| QA & release | Test automation, manual QA, device lab | 15% to 25% |
| Security & compliance | Threat model, hardening, pen test, PII flows | 5% to 15% (higher in regulated industries) |
| Contingencies | Unknowns, scope buffer | 10% to 15% |
This breakdown gives you a sanity check: if one bucket is missing or massively underweighted, the budget probably isn’t grounded in reality.
For example, the average data breach cost was $4.88M in 2024 and $4.4M in 2025 preliminary figures. It's critical to budget security up front.
Native vs. Cross-Platform vs. Hybrid
One of the earliest — and most expensive — calls you’ll make is how to build: native, cross-platform, or hybrid. Don’t let this decision get hand-waved; it'll shape your launch budget and your maintenance, team shape, and speed of shipping updates.
Pick the wrong foundation, and your app budget leaks money for years.
Definitions:
- Native: Swift/SwiftUI for iOS and Kotlin/Jetpack for Android.
- Cross-platform: one codebase compiled to native (Flutter or React Native).
- Hybrid: web app in a shell (Capacitor/Cordova).
| Option | When It Makes Sense | Upfront Cost | 3-Year Cost Outlook | Risks |
| Native | Best polish, advanced device features, offline strength | Highest | Lower long-term if scaling >1M users | Two teams, sync issues, bigger test load |
| Cross-platform | Shared features, faster launch, smaller budgets | 60% to 80% of Native | Cheaper for small/medium apps | Some native coding, plugin upkeep, tuning |
| Hybrid app development | Quick tests, content-first, limited features | Lowest upfront | Costly later if rebuild is needed | Weaker performance, limited features, review risks |
iOS vs. Android
Once you’ve chosen your build approach, the next lever is platform cost. Supporting both iOS and Android means managing two very different ecosystems with quirks that directly affect your budget.
iOS is faster to update, but Android’s device sprawl means more testing and edge cases.
- Device fragmentation: Android runs on thousands of devices, which means more software testing (about 1.5x to 2× effort compared to iOS).
- OS adoption: iOS users upgrade quickly, which means you need to manage fewer legacy versions. Android updates are slower, so you have more old devices to test.
- Publishing costs: Apple Developer costs $99/year, while Google Play costs $25 one-time. Budget 1 to 3 days per release for store approval.
- Stability rules: Google flags apps with too many freezes or crashes, which can hurt visibility. It’s important to plan for performance tuning.
- App testing setup: Plan for a smaller test matrix on iOS (the latest release and one older version). For Android, you’ll need a broader spread of 6 to 10 devices across different brands, screen sizes, and OS versions to catch quirks that emulators miss.
Infrastructure and Ongoing Service Fees
For most first-time app builders, the surprise isn’t the initial build cost, it’s how quickly ongoing expenses pile up once the app is live.
Cloud bills, database queries, and third-party services don’t show up in Figma mockups, but they will absolutely show up on your credit card. The good news is you can forecast most of these costs with a few simple rules of thumb.
Cloud Hosting
Think of cloud hosting as your app’s monthly rent. How much you pay depends on what your users do inside the app:
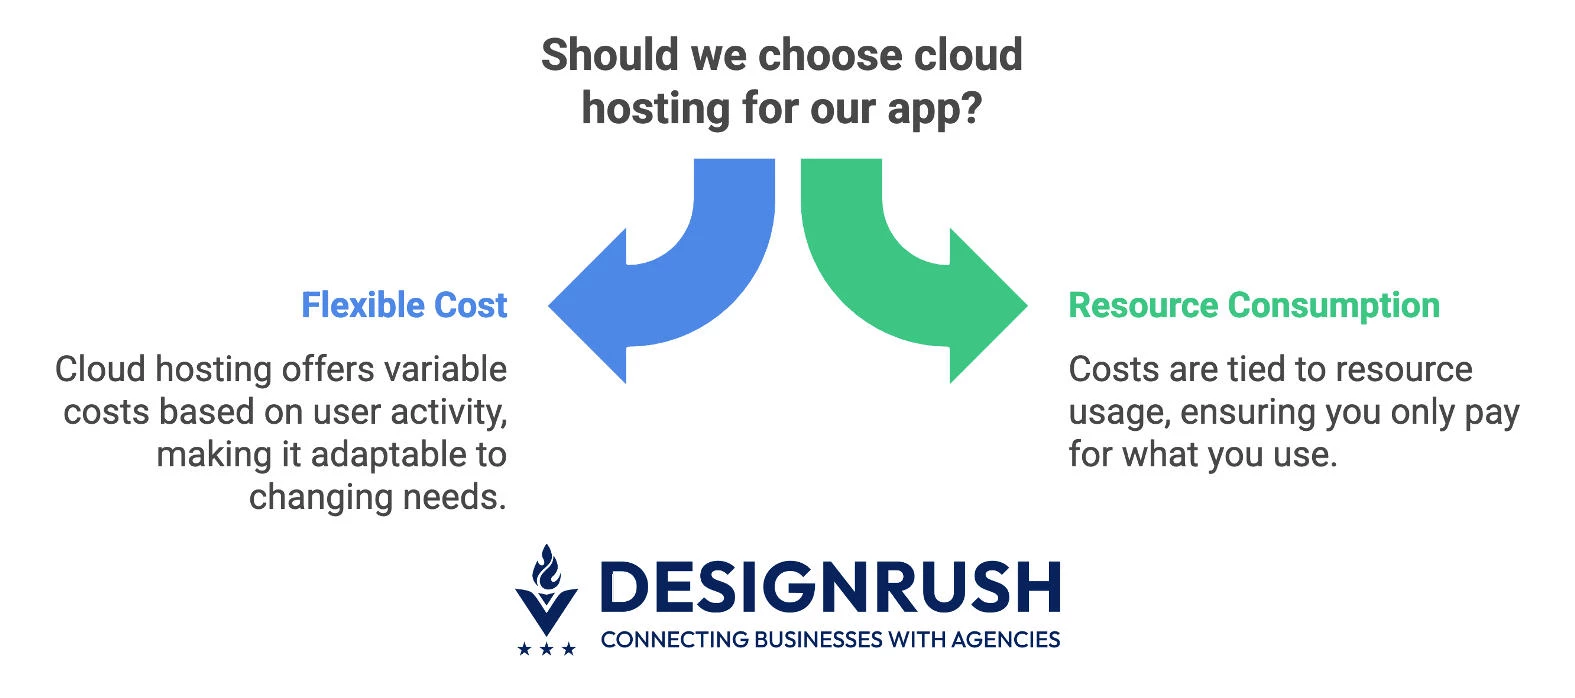
- MAU & concurrency → compute: The more monthly active users you have, and the more of them online at once, the more servers you’ll need to keep things running smoothly.
- Payload size → data transfer: Apps that move big files, like photos, videos, or maps, pay more in data transfer fees than text-based apps.
- Write/read intensity → databases: Features like chat or live feeds constantly hit your database, which adds cost.
- Retention → storage: If you keep data “hot” (immediately accessible), you’ll pay more than if you archive it.
- 3rd-party APIs → service fees: Authentication, messaging, maps, SMS, push notifications, or A/B testing all come with per-use charges.
Cost of app infrastructure ≈ MAU × Sessions/MAU × Avg Request Size × Egress $/GB + DB Ops $ + Compute $ + 3rd-party fees
For non-media apps, this usually lands between $0.05 to $0.60 per MAU each month. Apps heavy on media or real-time interactions can run closer to $1 to $3 per MAU if you don’t optimize.
Always track cost per MAU. If that number suddenly spikes, something shipped last sprint that your wallet didn’t see.
Databases and Total Cost of Ownership
Databases are like the plumbing of your app. Everyone forgets about them until something breaks or until the bill doubles.
Choosing the right type early makes scaling smoother and cheaper.
| Choice | Cost Shape | Pros | Risks |
| Managed SQL | Pay by vCPU/RAM + storage | Strong consistency (ACID), reliable for reporting, predictable joins | Scaling can hit ceilings |
| Managed NoSQL | Pay per request or “RU” + storage | Highly elastic scale, flexible schemas for fast iteration | Hot partitions can get expensive |
| Self-hosted | Pay for infrastructure + ops headcount | Maximum control, custom tuning possible | You own patching, backups, uptime, and an on-call rotation |
For a first-time app, managed SQL or NoSQL is usually the right move. It shifts responsibility for uptime and patches to your cloud provider, even if the usage fees are higher. Self-hosting sounds cheaper on paper, but the hidden cost is staffing: you’ll need someone on call 24/7 to babysit the database.
Talent and Tool Costs
When you’re building your first app, remember: code doesn’t ship itself. You’ll need both tools and people, and both carry real costs. Here’s how to think about them.
Mobile App Development Tools Costs
If your budget doesn’t account for tools, you’ll be pulling out the company credit card in month three, wondering where all the cash is going.
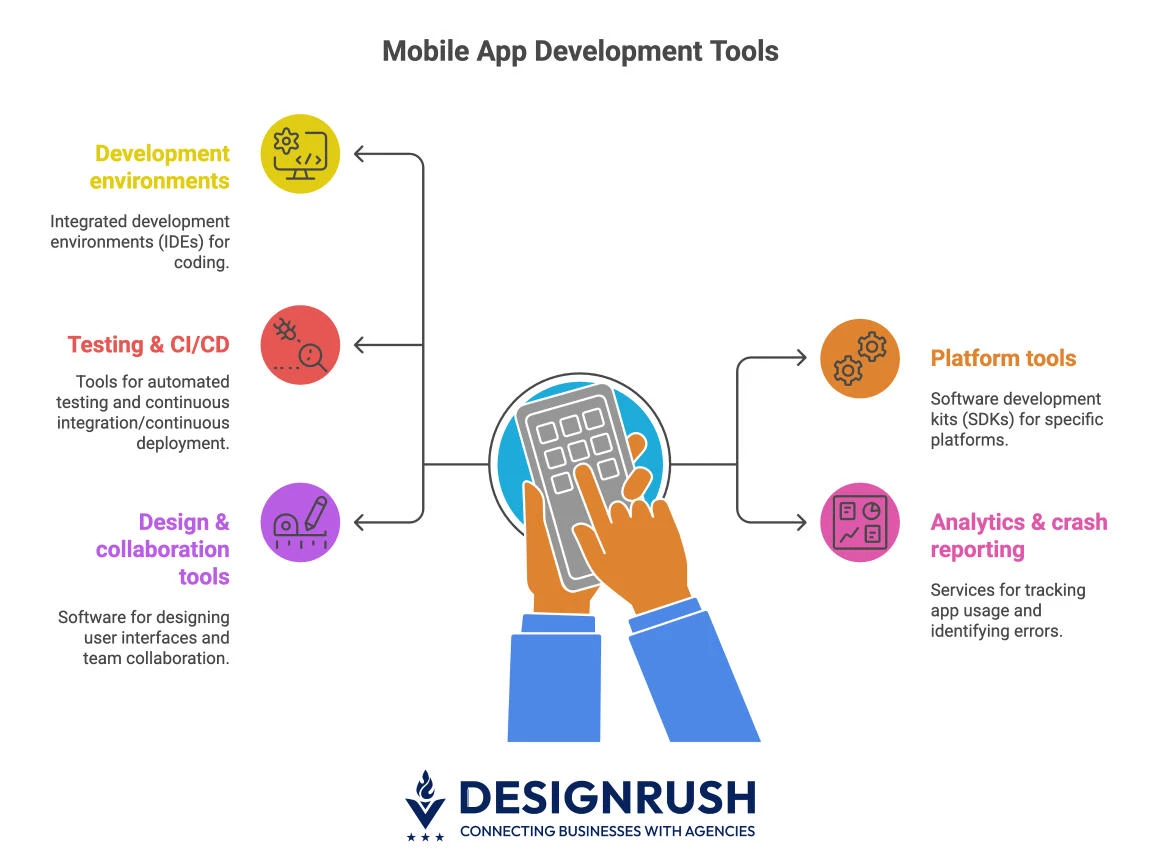
- Development environments: Tools like Xcode, Android Studio, and Flutter are free.
- Testing & CI/CD: Costs run from $200 to $1,500/month depending on how often you release.
- Analytics & crash reporting: These are usually cheap at first but scale with your user base.
- Design & collaboration tools: Figma, GitHub, Jira, etc. charge per seat; small monthly costs that add up with team size.
Talent Costs
The mix of seniors, mids, and juniors you hire (or contract) will make or break both your budget and your timeline.
Developer rates
- Senior iOS (Swift) and Android (Kotlin) engineers: generally similar rates.
- Cross-platform seniors (Flutter/React Native): often comparable, sometimes a premium if they also build native modules.
Regional price ranges
- U.S./Canada/Western EU: baseline (most expensive).
- Nearshore LatAm/Eastern EU: 60% to 80% of baseline.
- Offshore development team: 40% to 70% of baseline (factor in timezones/communication overhead).
Why seniors matter
- One strong senior often delivers the output of 1.5 to 2.5 juniors, with fewer bugs and less rework.
- Hiring cheap can actually cost more once you add extra project management and QA time.
Team shape for a first app
- Cross-platform build: 1 senior lead, 1 to 2 mid-level devs, a shared QA + designer, and part-time DevOps.
- Native build (two apps): 1 senior + 1 mid per platform, with shared backend, QA, and PM support.
Post-Launch Expenses Businesses Often Underestimate
You’ve budgeted for design, development, and testing, only to discover that ongoing updates and fixes quietly eat into your roadmap and your runway.
These costs aren’t “nice-to-haves.” They’re the hidden guardrails that keep your app stable, secure, and visible in crowded app stores.
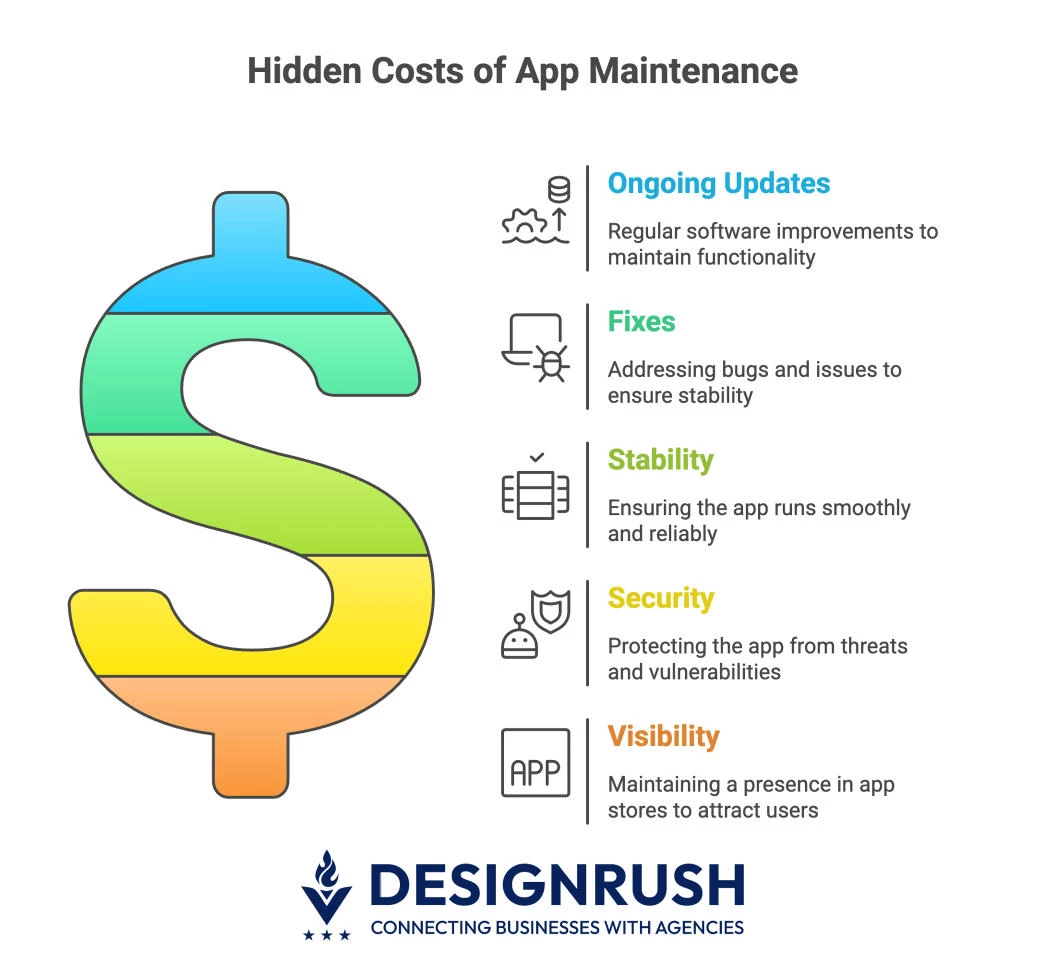
- OS updates: Apple and Google release new versions yearly; budget 4 to 8 weeks of dev time per year to keep your app compliant and working on new devices.
- Bug fixes: Real users will find edge cases your tests missed; expect 2% to 5% of your build cost per month for triage and hotfixes.
- Ratings & stability: Crashes and freezes hurt app store rankings and install rates; fund stability work or risk higher acquisition costs.
- Push notifications & CRM: Engagement tools (push, in-app messaging, segmentation) carry ongoing monthly fees, don’t treat them as one-time setup. Use benchmarks to set your targets.
- Accessibility: With laws like the European Accessibility Act, budget for ongoing audits and fixes to stay compliant and avoid fines.
Set aside 15% to 25% of your initial build cost each year for maintenance, otherwise OS updates and fixes will derail your roadmap.
Budgeting for Risks and Unknowns
Seasoned teams maintain a simple risk register: a running list of potential risks with owners, impact, and mitigation strategies. From there, you assign a realistic contingency buffer.
A practical formula is:
Contingency = 10% base
+ 5% if you have more than 3 external integrations
+ 5% if you’re in a regulated industry (e.g., finance, healthcare)
| Risk | Likelihood | Impact | Mitigation | Budget Impact |
| Payment gateway integration delays | Medium | High | Choose a provider with strong docs & support | +5% contingency |
| Third-party API rate limits | High | Medium | Add caching & usage monitoring | +2% contingency |
| New OS release breaks features | High | High | Budget for OS update cycles | Built into 15% to 25% annual reserve |
| Compliance review (PCI/HIPAA) | Low/medium | High | Engage compliance early; include legal review | +5% contingency |
| Scope creep (new features mid-build) | High | High | Use feature scoring (RICE/WSJF); defer low-value items | +5% contingency |
Mobile App Development Budget: Final Thoughts
Budgeting for an app isn’t about picking the lowest bid; it’s about planning for the full journey.
Find More Agency Hiring Resources:
- Website ROI From a Web Development Agency
- Questions To Ask a Web Design Agency
- In-House vs. Web Development Agency
From build costs to hosting, tools, and long-term maintenance, the smartest teams fund outcomes that tie directly to KPIs. Do that, and your budget becomes a growth engine instead of a cost center.
![]()
Our team ranks agencies worldwide to help you find a qualified partner. Visit our Agency Directory for mobile app development companies:
- Top Software Development Companies
- Top Android App Development Companies
- Top iPhone App Development Companies
- Top Offshore Software Development Companies
- Top AI App Development Companies
Our development experts also spotlight the most groundbreaking app projects from around the world. Visit our Awards section to explore the best in app development.
Mobile App Development Budget FAQs
1. How much does it cost to build a simple mobile app?
A basic MVP with 6–10 screens, login, simple CRUD, and push notifications typically ranges from $120k–$250k cross-platform, or $180k–$350k native for both platforms, including QA and security.
2. What’s the biggest hidden cost in app development?
Post-launch maintenance. Between OS updates, bug fixes, and compliance changes, expect to spend 15–25% of your original build cost every year to keep the app stable and visible in app stores.
3. How do I keep my app development budget under control?
Use a risk register with clear contingency buffers, tie every feature to a KPI, and track cost per MAU monthly. If that number suddenly spikes, you’ve likely shipped something that increased infrastructure or third-party fees.