I learned the hard way that before I talk to any mobile app agency, real growth starts with one North Star, a few drivers, and guardrails I can bet my budget on.
Defining App Metrics: Key Points
- Align on one NSM and three–to–five weekly drivers to blunt the Day-1 retention cliff.
- Make measurement contract-ready by shipping tracking plan v1.0 and enforcing SLOs (crash-free ≥99.5%, ANR <0.10% DAU, cold-start p90 ≤2.5s).
- Define every KPI with a plain-English definition, formula, data source, owner, and acceptance test so numbers are trusted.
Defining Mobile App Metrics Overview
1. How To Build an AI App That Drives Growth
2. Mobile App Development Strategy
A “great app” is subjective, but great results are measurable.
Defining metrics up front replaces vague ambition with a shared scoreboard while keeping scope honest and telling you exactly what to double‑down on (or cut) after launch.
How To Translate Business Objectives Into Mobile App Metrics
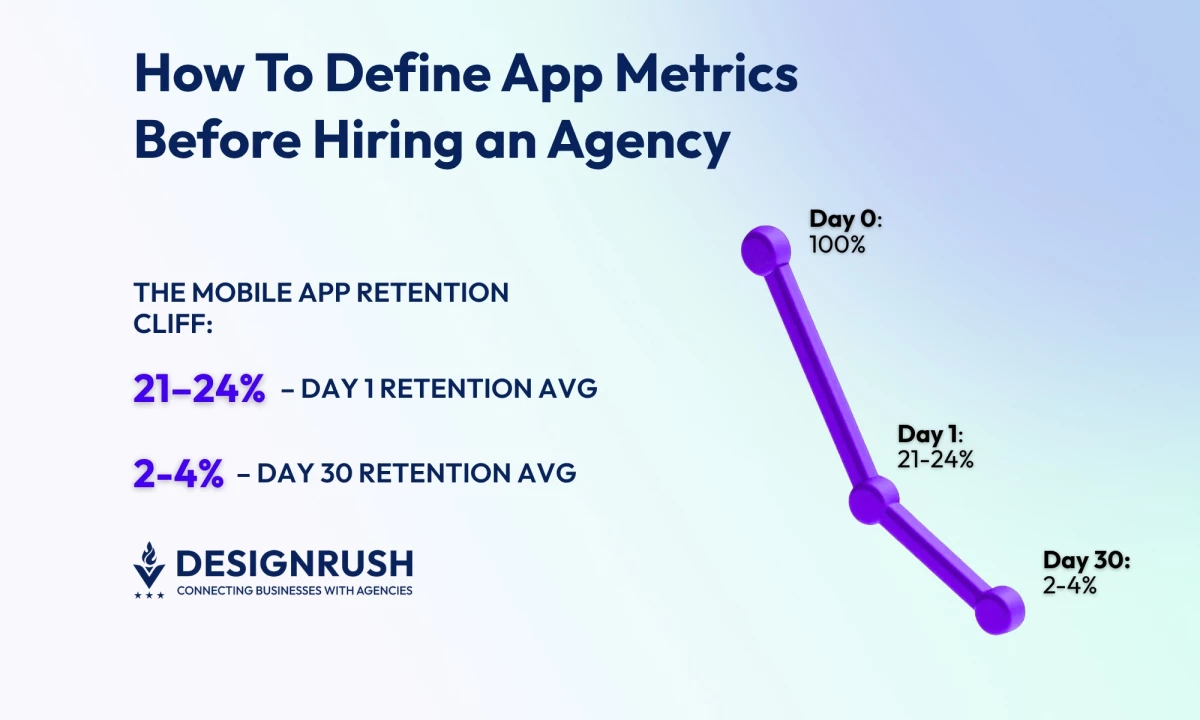
I like keeping it simple with a single North Star metric (NSM) for focus and a tight driver set for control. Given day one retention is ~21–24% and day 30 is ~2–4%, the NSM focuses on delivering lasting value.
It targets the drivers of day one loss, aiming to improve early engagement and reduce the steep drop-off in retention over time.
What makes a good NSM (my rule of thumb): It’s aligned to customer value, predictive of revenue and retention, easy to explain to non-analysts, and reliably measurable with the data you actually have.
North Star examples by model:
- Subscription Media: Trials converted to paid or lifetime value (LTV)
- Commerce: Revenue per active user (RPAU)
- Marketplace: Successful transactions or liquidity
- B2B Companion App: Weekly active accounts
- Fintech: Verified accounts or transaction success rate
Choose Three-to-Five Drivers You Can Move Weekly
Drivers are the levers (activation, engagement depth, conversion, monetization, and reliability) and each one needs a weekly target and a named owner so it doesn’t become “everyone’s job.”
For example:
- Activation and Engagement: Measures like the percentage of users who activate the app, the number of sessions per user per week, the adoption rate of new features, and how many users keep using the app after four weeks.
- Conversion and Monetization: Metrics like the percentage of users who add items to their cart and make a purchase, the percentage of users who go from a paywall to a trial, and average revenue per paying user (ARPPU).
- Reliability: Metrics like the percentage of users who don’t experience crashes, the time it takes for the app to start, and the rate of "app not responding" (ANR) errors on Android.
Guardrails (to prevent "false wins") where any major issues void the results:
- Stability: Measures like crash-free sessions/users, ANR rate on Android, and app start time (p90 is the time when 90% of users see the app start).
- Privacy/Trust: Metrics such as how many users opt-in for notifications (push notifications and Apple’s App Tracking Transparency, ATT), and the volume of complaints.
- Cadence: Set quarterly NSM targets, monthly driver targets, and review weekly — NSM trend, driver deltas, guardrails, and next experiments.
App Metrics I Track: Definitions And Signals
I put the formulas in the tracking plan so we’re all speaking the same language. For each metric, I name an owner, define a single source of truth, and add an acceptance test so that every number is traceable and trusted.
These are the leading indicators we manage weekly:
- Activation rate: The percentage of new users who start using the app after installing it.
- Onboarding completion: The percentage of users who finish the onboarding process compared to those who start it.
- Time to first value (TTFV): The average time it takes for a new user to take the key action that shows they’re getting value from the app.
- Retention (D1/D7/D30): The percentage of users who return on day one, day seven, and day 30 after installing the app.
- Stickiness: The ratio of daily active users to monthly active users (DAU to MAU) — showing how often users come back.
- Session length/frequency: The average time users spend in the app (p50/p90 duration), and how often they use it each day.
- Feature adoption: The percentage of active users who use a specific feature.
- Churn: The rate at which users stop using the app (one minus retention), or for paid apps, the percentage of canceled subscriptions.
- ARPDAU / ARPU: Average revenue per daily active user (ARPDAU) or monthly active user (ARPU).
- LTV: The total revenue a user is expected to bring during their time using the app, calculated by multiplying ARPU, gross margin, and expected user lifespan.
- Payback period: The amount of time it takes to recover the cost of acquiring a customer (CAC) through their monthly gross profit.
- Crash-free sessions %: The percentage of sessions where the app didn’t crash.
- Crash-free users %: The percentage of users who didn’t experience a crash.
- ANR rate: The percentage of users who experience the "app not responding" error on Android.
- App start time: The time it takes for the app to become interactive after being opened (p50/p90).
- App size / battery / network error rate: Track the app's size, battery usage, and network errors for each release and set limits.
- Opt-in rates: The percentage of users who agree to receive notifications, location services, or consent to app tracking.
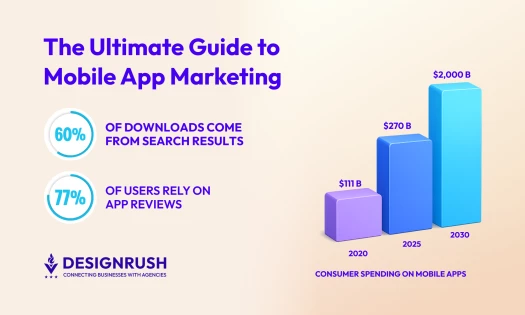
Benchmarks: Recent 2024 reviews put the conversion rate (CVR) from the App Store product page to installs at around 25% in the U.S. across all categories, and about 27% for Google Play. These figures are directional and can vary significantly depending on the category and the methodology used.
UX & Quality Metrics That Predict Ratings
Since ratings reflect quality over time, I focus on the causes, not just the scores.
- Task success and time on task (usability tests): I test with five-to-eight target users on a clickable prototype to identify issues with navigation and wording before the code is written.
- System usability scale (SUS) and accessibility: I set a system usability scale (SUS) goal for each milestone and make accessibility, including web content accessibility guidelines (WCAG), dynamic type, and touch Targets, part of the definition of "done."
- Funnel drop-offs and “rage taps”: I track validation errors and places where users get frustrated and repeatedly go back and forth.
Establish Baselines and Targets
Before hiring, I want a realistic picture of where we are and where we’re going. Baselines anchor expectations, and targets shape the roadmap.
Where to pull baselines:
- Product analytics (Firebase, Mixpanel) for acquisition → retention → revenue.
- Crash & performance (Crashlytics, Android vitals) for stability and speed.
- Store consoles (App Store Connect, Google Play Console) for ratings, reviews, conversion rate (CVR).
- Market intel (data.ai/Sensor Tower) for category benchmarks.
For the record, industry benchmarks show median crash-free rates around 99.93% (iOS) and 99.81% (Android) across large datasets.
Set 90/180‑Day Targets With Ranges
I draft floor / expected / stretch for each KPI, then sanity-check the set.
For example, for a subscription app:
- D7 retention: Floor 18% / expected 22% / stretch 26%
- Crash-free sessions: ≥99.5%
- Trial → paid conversion: Floor 4% / expected 6% / stretch 8%
Define success thresholds and kill criteria: We agree on what “good enough to scale” means (e.g., payback ≤3 months, ANR <0.1% DAU). If a KPI stays below the floor for two cycles, we pause spend or pivot.
Instrumentation and Data Governance
This is where I've seen things go wrong before. Now, on every project, I write the data model first, then I enforce quality checks and limit access to named owners.
- Event taxonomy and naming: Maintain an event dictionary (use present-tense verbs like Sign Up, Start Trial, Complete Purchase), required properties (platform, version, channel, experiment ID), and owners.
- User identity strategy: Plan the journey from anonymous → soft ID → authenticated → CRM; alias IDs so funnels don’t split at login.
- Required properties: Standardize platform, app version, build number, country, acquisition channel, cohort date to keep segmentation trustworthy.
- Environments & data hygiene: Use separate keys for development, staging, and production, and block test traffic from production. Add schema checks to catch typos before they affect reports.
- Privacy, consent & retention: Set up consent processes, retention periods, and access roles. If handling personal data, keep a data protection impact assessment (DPIA) and processing records.
- Tooling setup & ownership: Name owners before sprint one; tools don’t matter if nobody owns outcomes.
- Product analytics (pick a right-sized tool):
- Firebase Analytics is a solid free starting point with mobile-friendly software development kits (SDKs) and enough reporting to baseline acquisition, activation, and retention.
- Mixpanel shines when you need deeper funnels, cohorts, and segmentation (e.g., “users who finished onboarding last week and saw Feature X”).
Stabilize, Then Strategize: Crashes, Store Signals, Safe Experiments, and Executive KPIs
You can turn raw telemetry into decisions by monitoring stability and performance, reading store signals, running guarded experiments, and aligning leadership with a crisp weekly KPI pack.
1. Crash and Performance
Use Crashlytics to track crash-free users/sessions and spot patterns by device, OS, or release; pair it with performance monitoring to watch cold-start time, network latency, and slow traces.
Wire alerts to Slack with a clear on-call rotation and thresholds, so the right person triages within minutes, not days.
2. Store Intelligence
Rely on App Store Connect and Google Play Console for first-party truth on conversion, ratings, and reviews per version and country.
Layer in Sensor Tower for category benchmarks, competitor trends, and share-of-voice, so you can tell whether changes are local regressions or market-wide shifts.
3. Experimentation
Ship feature flags and A/B testing from day one so you can iterate without resubmitting.
Add guardrails (e.g., auto-stop if crash-free dips, ANR rises, or p90 start time spikes) to prevent experiments from quietly degrading stability or user experience.
4. Executive Reporting
Send a one-page weekly KPI pack: the North Star, 3–5 drivers, guardrails, week-over-week deltas, and named owner next steps.
In my experience, if it takes more than ten minutes to digest, it won’t be read. Keep commentary tight and action-oriented.
Make Measurement Contractual: Cadence and SLAs
We focus on simple, human cadence (and making measurement contractual) in order to ship value weekly with clear accountability.
The practices that follow hard-wire learning loops because thresholds trigger actions, owners commit, and budgets follow data.
- Weekly Product Review: Acquisition, activation, retention snapshot with owner-written notes on drivers and next actions; no screenshots without commentary.
- Release Health: Per-release stability (crash-free users/sessions), ANR, start time, top regressions, and store feedback; decide roll forward, hotfix, or roll back in one meeting.
- Monthly Growth Review: Cohorts, LTV, and payback by channel/country; decide what to scale, fix, or cut. Budget follows the data.
- Decision Log and Experiment Register: Capture hypothesis, variants, metrics, results, and decisions to compound learning and end “we tried that already.”
- Make it part of the contract:
- Tracking Plan v1.0 (events, properties, IDs, owners) delivered before Sprint 1.
- Definition of Done includes instrumentation and the agreed dashboards.
- Quality SLOs: We hold to crash-free ≥99.5%, ANR <0.10% DAU, and cold-start p90 ≤2.5s (validated in Crashlytics/Android vitals). Google’s penalty line for ANR is about 0.47% DAU so we aim materially better.
- Data ownership: You control analytics properties, service accounts, and raw exports — no agency-owned production data.
- Post-launch SLAs: Monitoring/alerting in place; RCA within X days for P0/P1; monthly patch and SDK-review cadence.

Avoid Common Metric Traps
Before you brief an agency, tighten your measurement. I watch for five patterns that quietly sink dashboards and budgets.
- Vanity vs. decision metrics: Installs without retention are noise.
- Lagging‑only views: Add leading indicators (activation, week‑one engagement).
- Ignoring cohorts/segments: New vs. returning, paid vs. organic behave differently.
- Missing counter‑metrics: Growth with rising crash/ANR is decay in disguise.
- SDK drift/version skew: Stale SDKs and mis‑tagged events break trust in the data.
Pre‑Hire Metrics Readiness Checklist
Before I invite agencies to discovery, I make sure the following is done.
- One‑page KPI summary: NSM + three-to-five drivers + guardrails
- Baseline snapshot and 90/180‑day targets (floor/expected/stretch)
- Tracking plan and event dictionary (IDs, properties, owners)
- Dashboard skeleton created; agency access provisioned
- RACI for metric ownership; escalation path for misses
- Privacy/legal check on data capture and consent
App Metrics: Final Words
When you define your metrics up front, a risky build becomes a managed experiment. Choose a few metrics that genuinely change decisions, write them down where everyone can see them, and let them shape the conversations you have each week.
When the numbers drift, you’ll know early. When they improve, you’ll know why.
Find More Agency Hiring Resources:
- Building a Practical Budget for Mobile App Development
- Top Mobile App Development AI Tools
- iOS Game Development Guide
![]()
Our team ranks agencies worldwide to help you find a qualified partner. Visit our Agency Directory for mobile app development companies:
- Top Software Development Companies
- Top Android App Development Companies
- Top iPhone App Development Companies
- Top Offshore Software Development Companies
- Top AI App Development Companies
Our development experts also spotlight the most groundbreaking app projects from around the world. Visit our Awards section to explore the best in app development.
How To Define App Metrics FAQs
1. How many app metrics should we track?
Aim for five-to-eight total: one North Star, three-to-five drivers, and one or two guardrails. Enough to steer decisions without creating dashboard fatigue.
2. What if we don’t have baselines yet?
Instrument first, then collect two-to-four weeks of data. Treat early numbers as provisional, sanity-check with store consoles and category benchmarks, and update targets once trends stabilize.
3. Which app metrics belong in the contract?
List analytics deliverables (tracking plan v1.0, metric definitions, acceptance criteria), dashboard handoff, and quality objectives (stability and performance) with clear SLAs for investigation and fixes.
4. How often should the executive team review metrics?
Run a weekly pulse for product health, a per-release stability check, and a monthly growth review. Keep it to one page with owners and next actions.