-details-webp.webp)
You’re tracking ROAS, utilization, impressions… but are those metrics actually fueling growth — or hiding problems? Without context, raw numbers like “likes” or impressions can be misleading.
We’ll break down the most important agency KPIs by stage and use case, so you can turn your data into business decisions.
Top Agency Metrics and KPIs: Key Points
- Track by department — Metrics like CSAT, NPS, ROAS, and project margin reveal client health, team output, and profitability.
- Use the right tools — Looker Studio, Databox, and Harvest + Forecast turn raw KPIs into clear, real-time insights.
- Match KPIs to growth stage — Early agencies prioritize leads and burn rate; mature ones track margins and upsells.
Agency Metrics and KPIs Overview
Metrics should guide forward-looking decisions, not just report the past.
Leading agencies achieve this by making KPIs highly visible and actionable in real time.
Core KPIs by Department: What To Track To Maximize Profit
Every department in an agency drives different outcomes; your KPIs should reflect those nuances. Here are the core metrics to watch in each area:
KPI | Definition | Benchmark |
Client Satisfaction Score (CSAT) | Measures client happiness with projects/campaigns. | 80%+ |
Net Promoter Score (NPS) | Gauges client loyalty and likelihood to recommend. | 50+ |
Meeting Velocity | Frequency of key client touchpoints (e.g. check-ins, QBRs). | High, without overwhelming clients |
On-Time Delivery Rate | % of projects/assets delivered by deadline. | ~90%+ |
Revision-to-Approval Ratio | Avg. revision cycles per deliverable. | 2:1 or lower |
Creative Asset Performance | Ties content to results (e.g. CTR, engagement, completion). | Varies by format |
Return on Ad Spend (ROAS) | Revenue per $1 ad spend. | Pair with CAC and LTV |
CPM, CPA by Channel | Cost per 1,000 impressions and per acquisition by channel. | Channel-specific |
Funnel Conversion Rates | Tracks drop-off and success at each funnel stage. | Varies; used for optimization |
Utilization Rate | % of time spent on billable work. | 75–85% ideal; >90% is risky |
Project Margin | Profitability per project. | 20%+ |
Time-to-Invoice & DSO | Speed of invoicing and days to receive payment. | DSO < 60 days |
Strategy & Account Management
These metrics reflect how well your team maintains relationships and delivers value to clients. Strong performance here often leads to retention, referrals, and long-term growth.
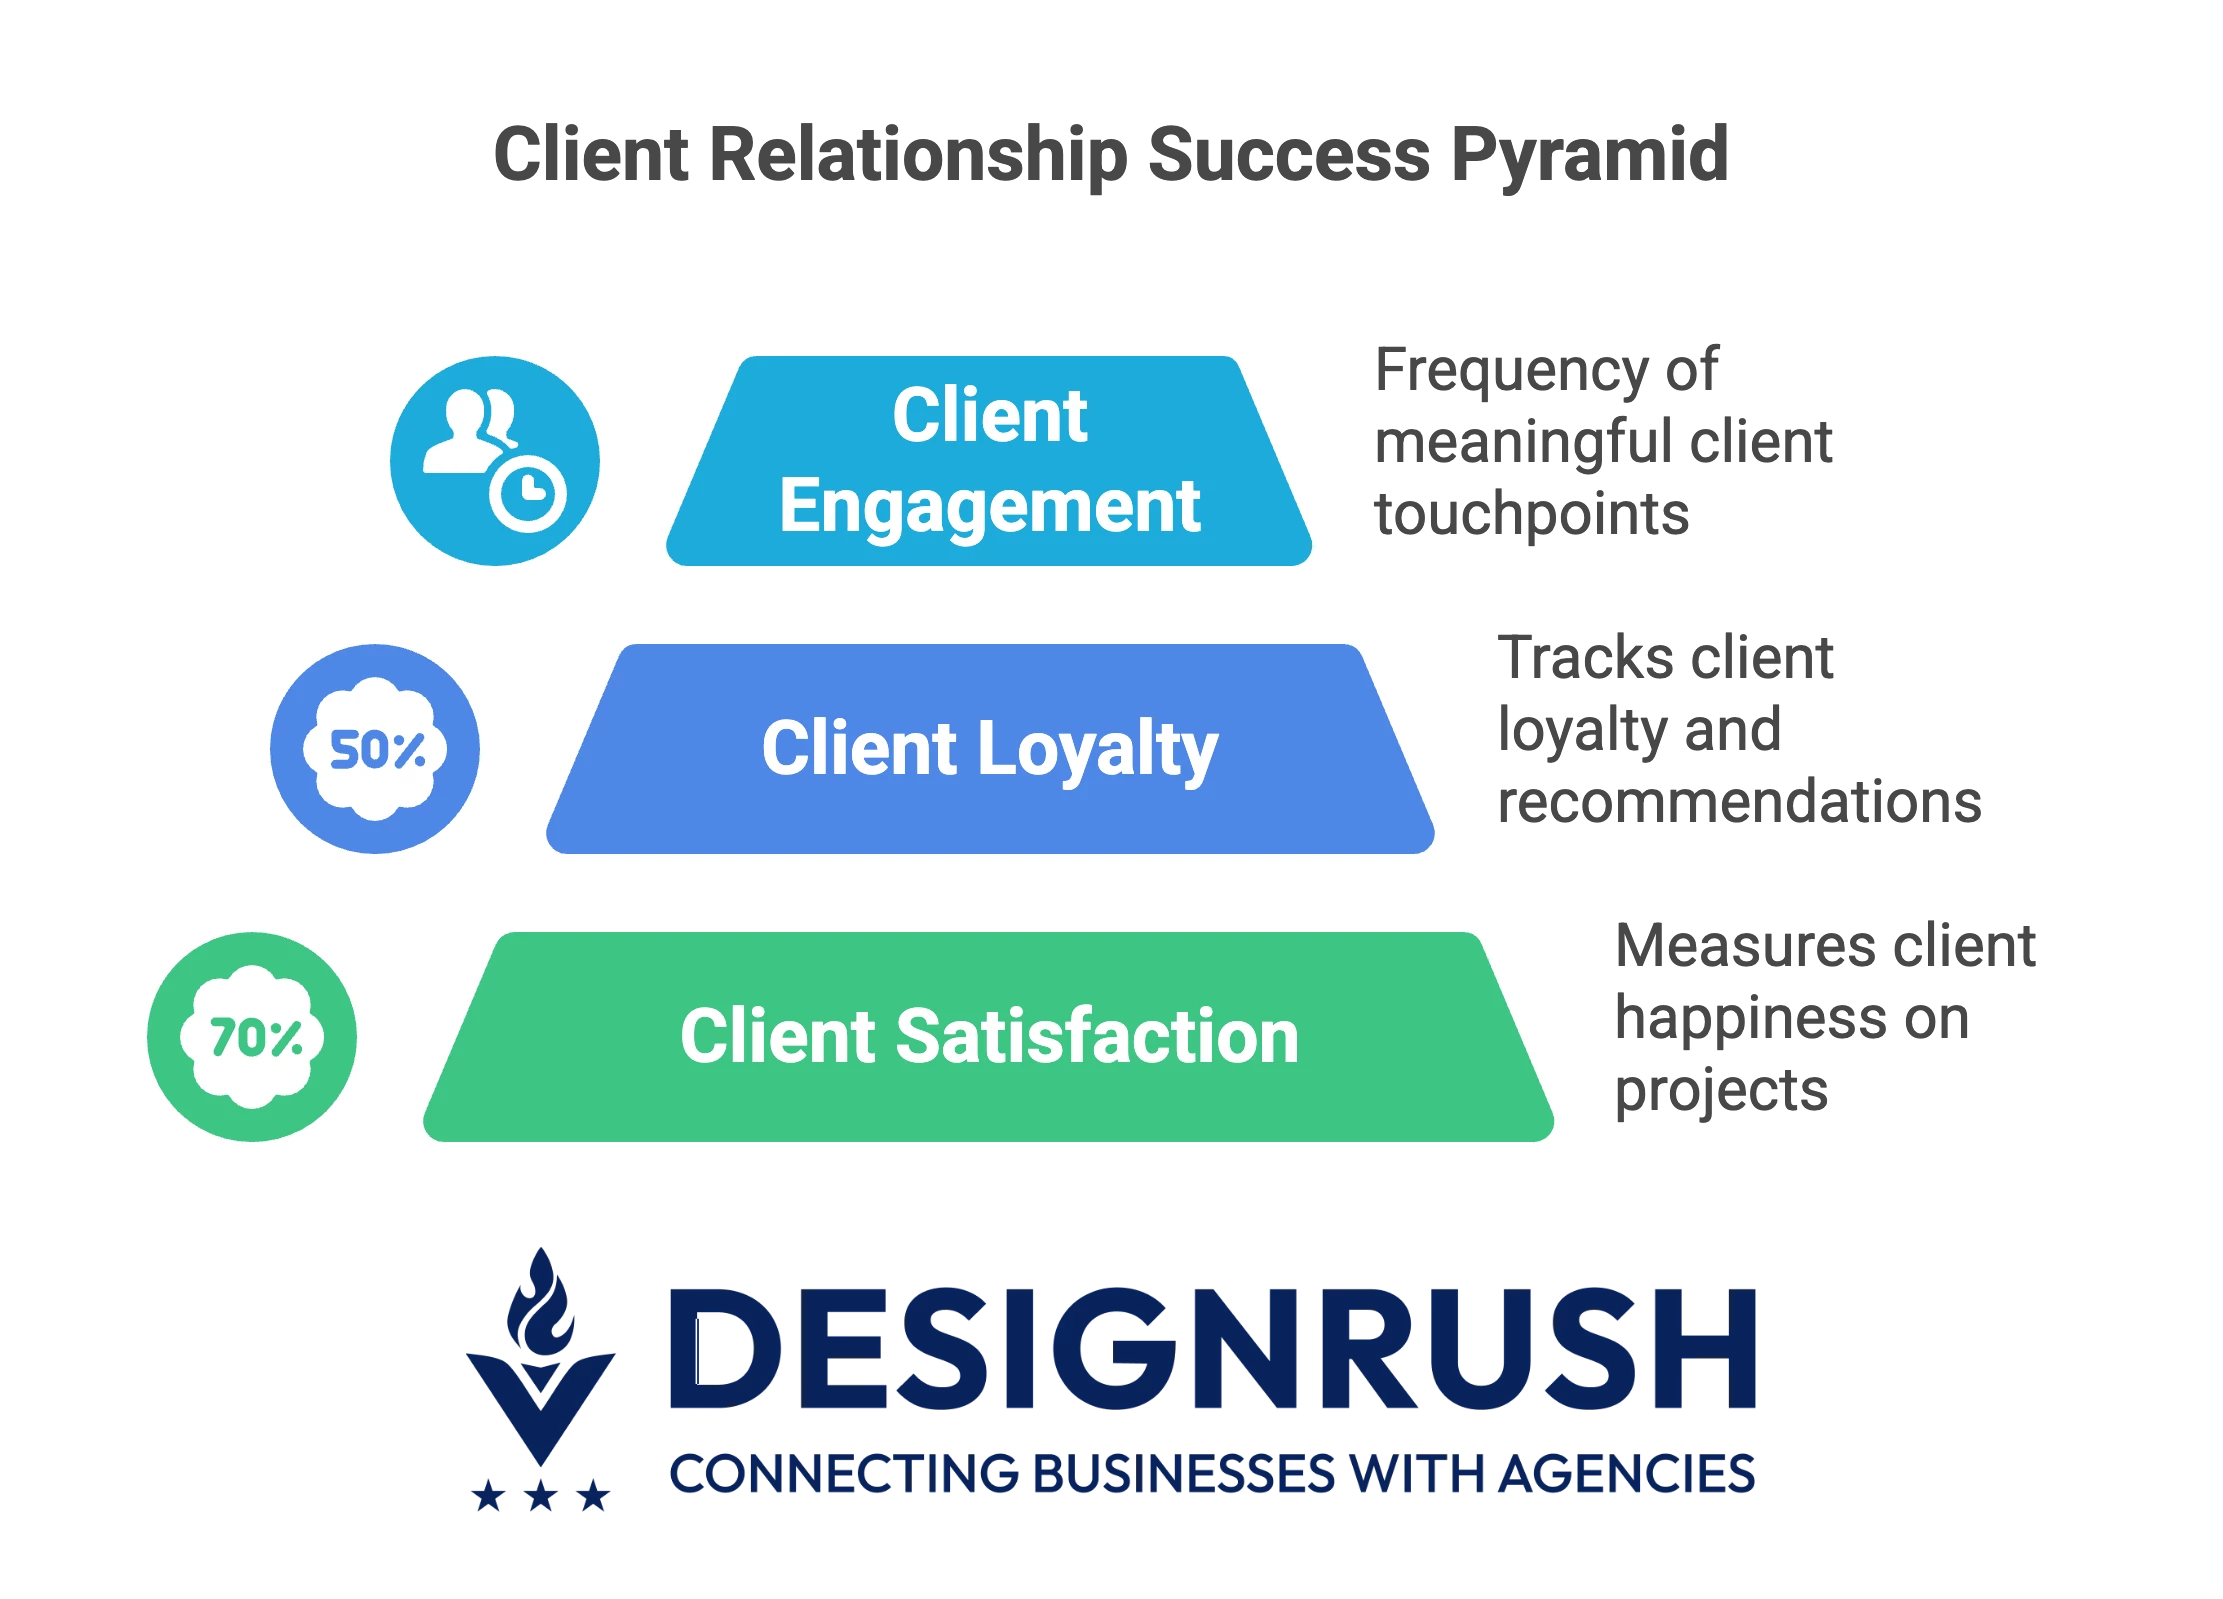
- Client Satisfaction Score (CSAT): Measures client happiness on projects or campaigns. Aim for 80% or higher satisfaction as a benchmark of strong account health. High CSAT correlates with loyalty and renewals.
- Net Promoter Score (NPS): Tracks client loyalty and likelihood to recommend. An NPS above ~50 is considered excellent and indicates strong upsell/cross-sell potential.
- Meeting Velocity: The frequency of meaningful touchpoints with top-tier clients. This could be weekly check-ins, QBRs, strategy sessions, etc. A high meeting cadence shows proactive engagement and can preempt issues.
Creative & Production
Creative KPIs track both the efficiency and impact of your team’s output, from delivering on time to producing content that actually performs.
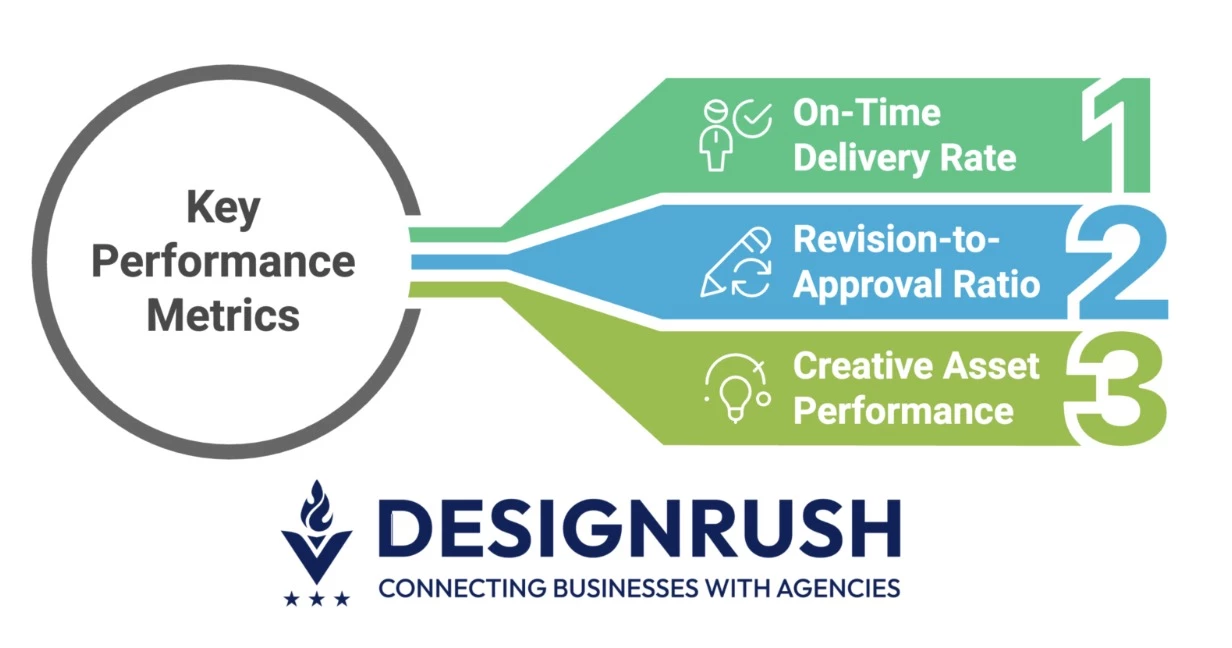
- On-Time Delivery Rate: Percentage of projects or assets delivered by the agreed deadline. A healthy rate is ~90%+ on-time, consistently hitting due dates keeps clients confident and avoids budget overruns.
- Revision-to-Approval Ratio: Measures the average number of revision cycles per deliverable. Aim for 2:1 or lower; more than two rounds may indicate misalignment or scope creep. Industry norms suggest 1–3 rounds, with diminishing returns after each.
- Creative Asset Performance: Qualitative metric tracking how content performs (e.g., ad designs by click-through rate or engagement, videos by completion rate, etc.). It ties the creative team’s output to real-world results.
Media & Performance Marketing
These metrics help you evaluate how well your media spend is turning into tangible business results and where your strategy may need fine-tuning.
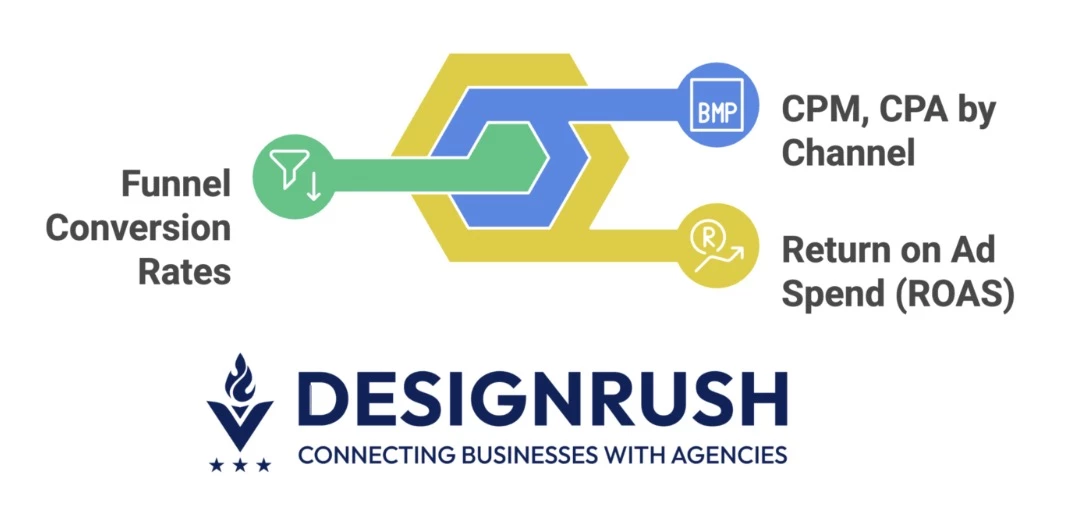
- Return on Ad Spend (ROAS): Revenue earned per dollar spent on ads. It’s a key efficiency metric, but don’t view it alone — a high ROAS can mislead if CAC is rising or LTV is low. Always pair with CAC and LTV to gauge true profitability.
- CPM, CPA by Channel: Track cost per mille (thousand impressions) and cost per acquisition for each advertising channel. These help you optimize budget allocation and identify which channels deliver the best bang for the buck.
- Funnel Conversion Rates: Track conversions at each stage (click-to-lead, lead-to-opportunity, opportunity-to-client) to identify drop-off points and target optimization where it matters most.
Operations & Finance
Ops and finance KPIs measure the backbone of your agency: team efficiency, profitability, and financial health. Use them to spot risks and tighten execution.
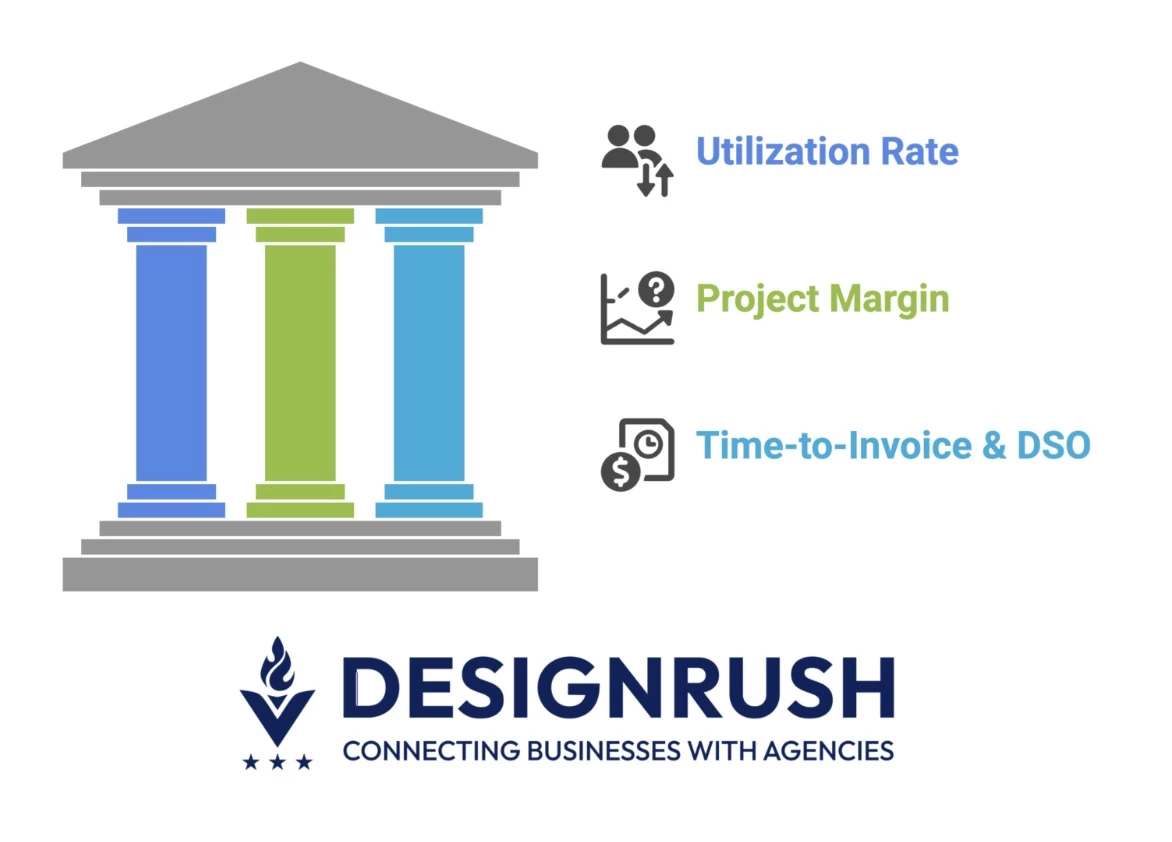
- Utilization Rate: Tracks the percentage of available hours spent on billable work. An optimal range is 75%–85%. Consistently above 90% often indicates overwork or under-scoping. Use utilization to manage workloads and hiring.
- Project Margin: Profitability of individual projects. Aim for 20%+ margin on average engagements. Project margin reveals if you’re pricing properly and executing efficiently. Low margins may indicate overservicing or poor scope discipline.
- Time-to-Invoice & DSO: How quickly you invoice upon project milestones or completion, and Days Sales Outstanding (how long it takes to get paid). Shorter cycles here improve cash flow.
Caution: Over-reliance on certain “headline” metrics can backfire. For instance, focusing only on ROAS might mask problems — your ads could show great ROAS even as customer acquisition costs creep up unsustainably or your margins erode.
Similarly, a very high utilization rate (90%+) might look efficient but actually signals team overwork and impending burnout.
Always contextualize performance metrics with complementary indicators (e.g. ROAS alongside CAC or LTV, utilization alongside employee well-being and project quality).
The KPI Maturity Matrix: How To Prioritize What To Measure
Not all KPIs carry equal weight at every stage of your agency’s growth. Use this simple 3-tier matrix to align your tracking strategy with your business phase:
Agency Stage | Primary KPI Focus |
Early-Stage | Lead velocity (qualified lead growth rate), burn rate (cash burn), pipeline conversion rate, and win/loss ratio of new deals |
Growth-Stage | Client churn rate, Net Revenue Retention (NRR), team utilization rate, project profit margin |
Mature | Operating margin, client upsell/cross-sell ratio, average deal size, Days Sales Outstanding (DSO) |
- Early on, agencies live or die by sales pipeline metrics – Are you generating and converting enough leads before cash runs out?
- In a growth phase, retention and efficiency metrics take center stage – You need to keep clients happy and projects profitable.
- By maturity, the focus shifts to profitability and scalability – Maximizing margins, expanding accounts, and managing cash flow.
Pro Tip: Identify the handful of KPIs that best capture your agency’s growth velocity, profitability, and client loyalty, and double down on monitoring those.
Visualizing Success: KPI Dashboards That Drive Action
Having the right KPIs is only half the battle; you also need to visualize and communicate them effectively.
Here’s how to set up dashboards that actually spur action:
Reporting Tools That Work
Choosing a dashboard platform that suits your needs is crucial. A few popular options:
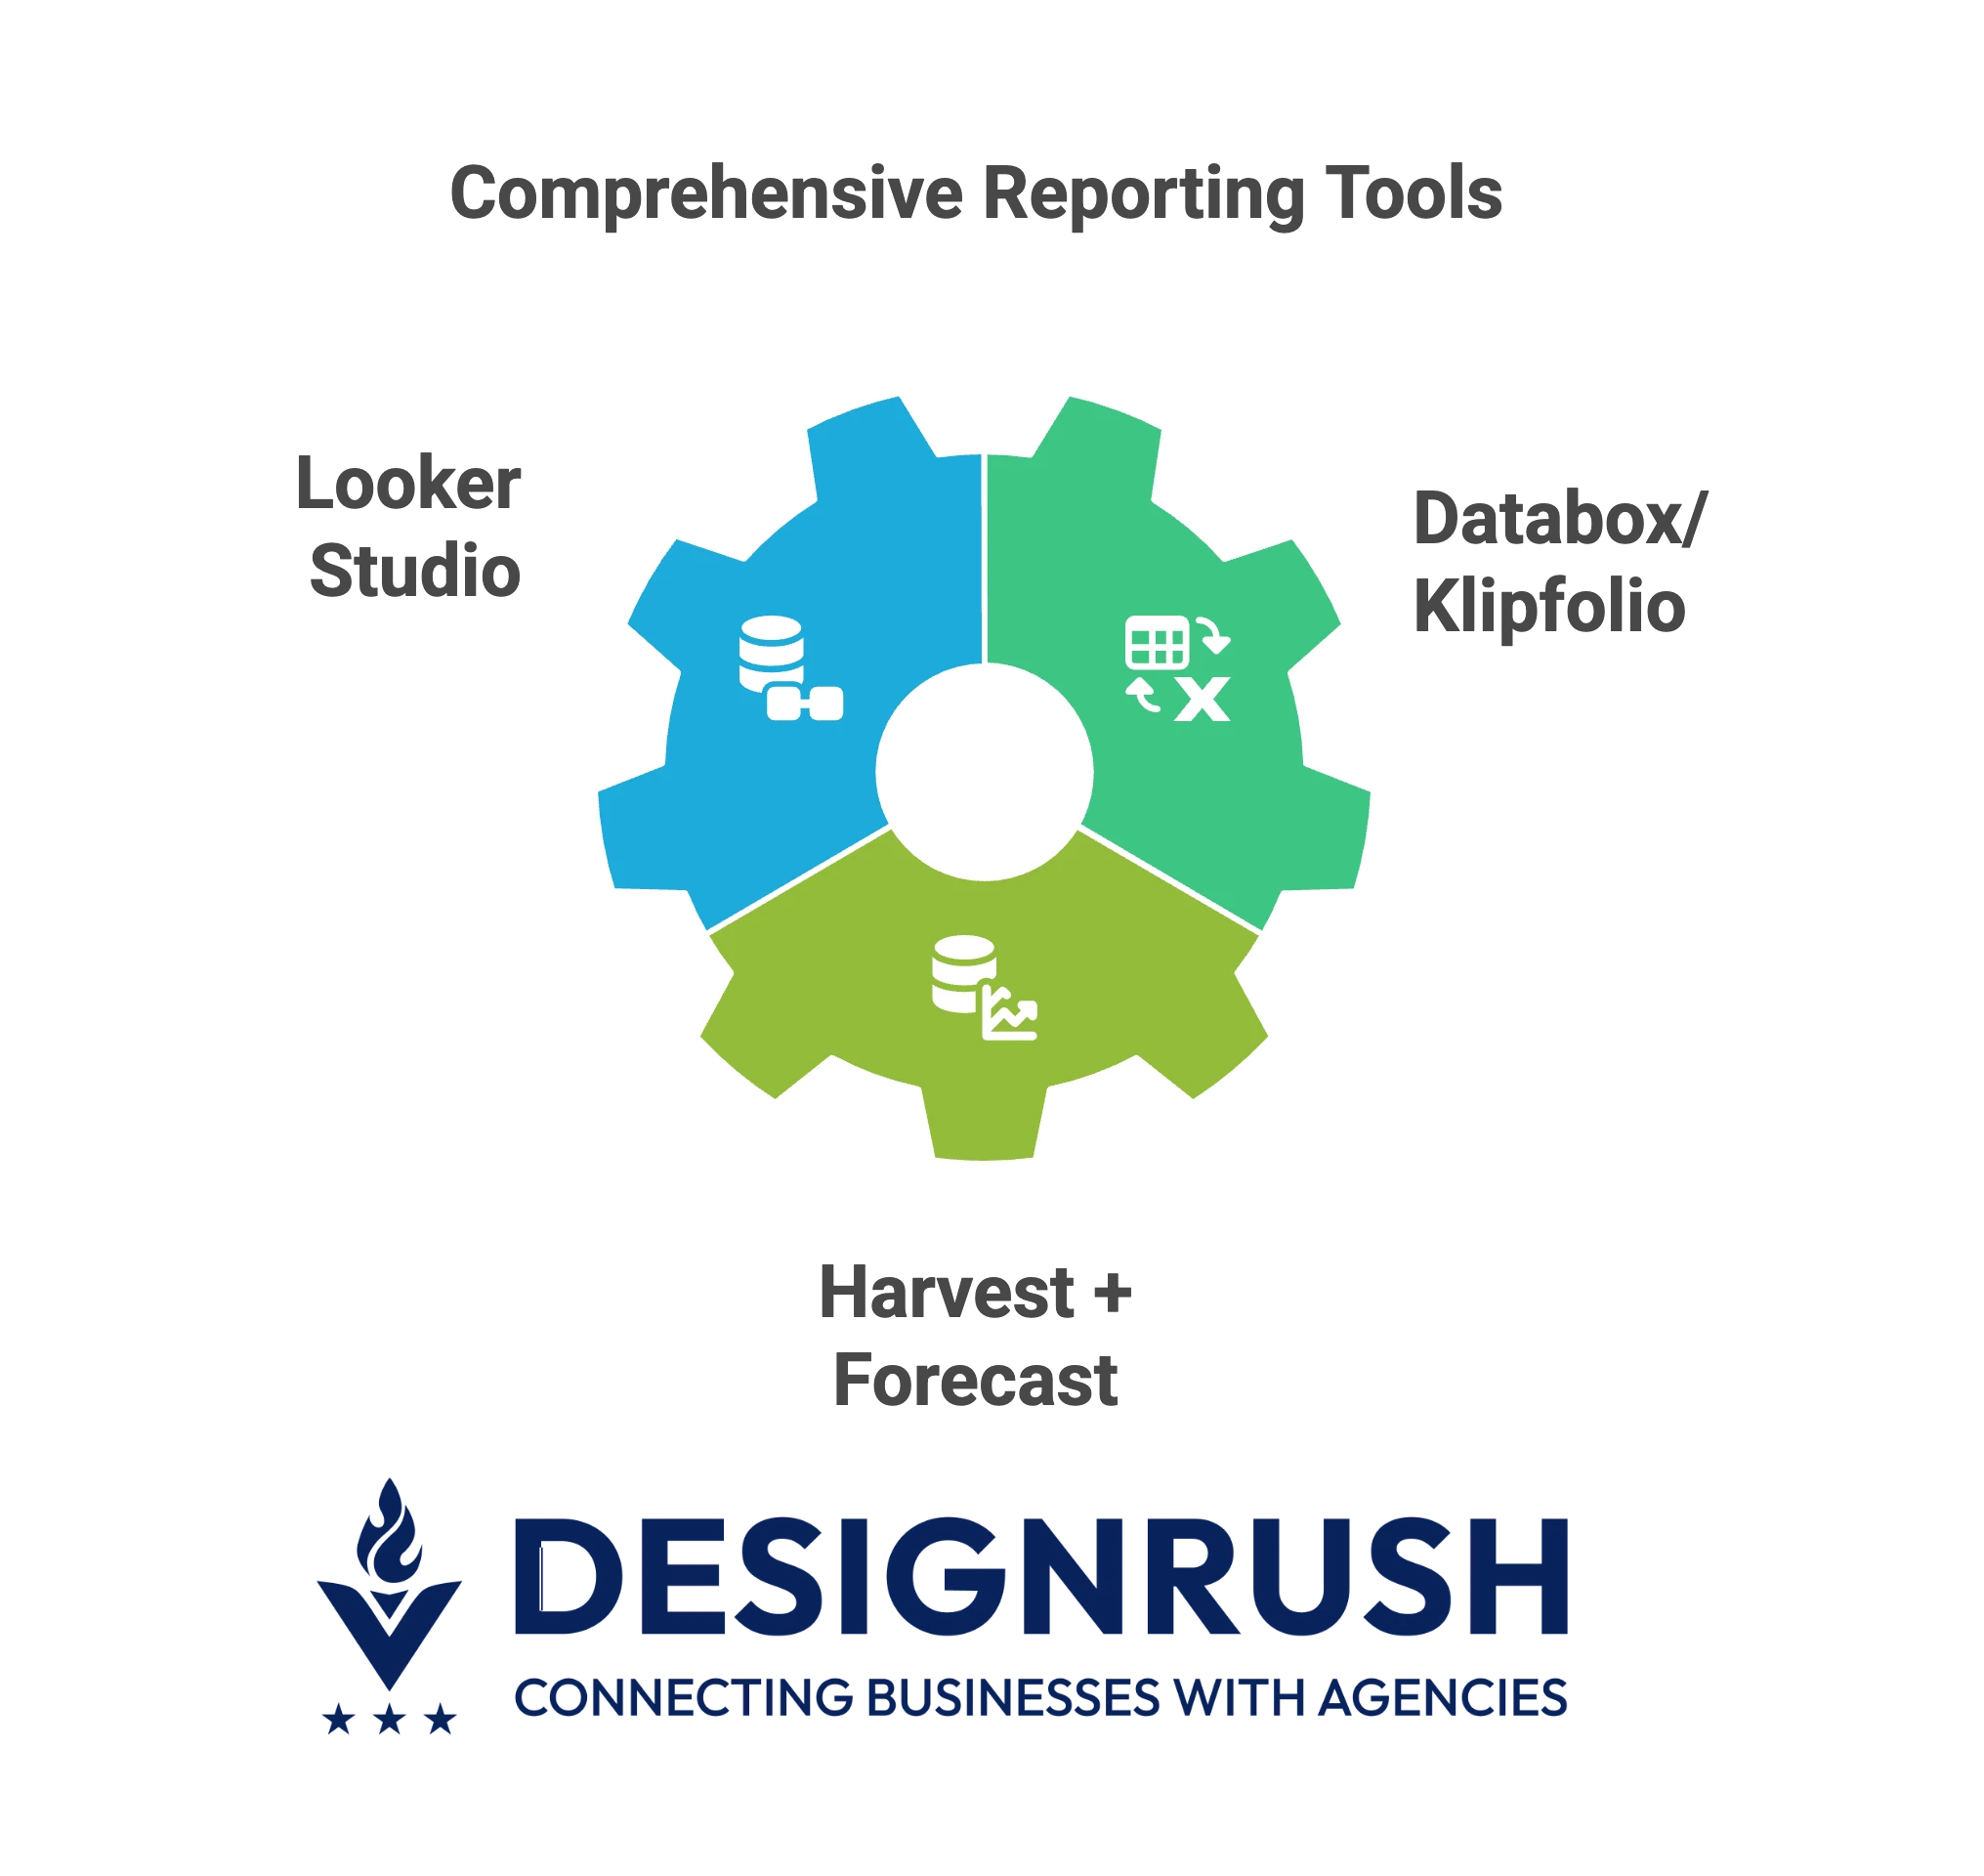
- Looker Studio (Google Data Studio): Great for full-funnel visibility across marketing, sales, and ops data. It’s flexible and integrates with many data sources to provide a unified view of KPIs.
- Databox or Klipfolio: Specialized real-time dashboard tools with tons of integrations. They allow you to pull data from various apps (Google Analytics, social platforms, CRM, etc.) into one live report. Ideal for quick, at-a-glance status checks.
- Harvest + Forecast (or similar PSA software): For agencies, combining time-tracking (Harvest) with planning (Forecast) yields powerful insight. You can blend timesheet data with budget and scheduling info to monitor utilization, project burn, and budget vs. actual in real time.
Note: The best tool is the one your team will actually use. Simpler might be better if it means higher adoption and more frequent checks.
Ownership & Cadence
Establish a regular review cadence and assign owners to each KPI so nothing falls through the cracks:
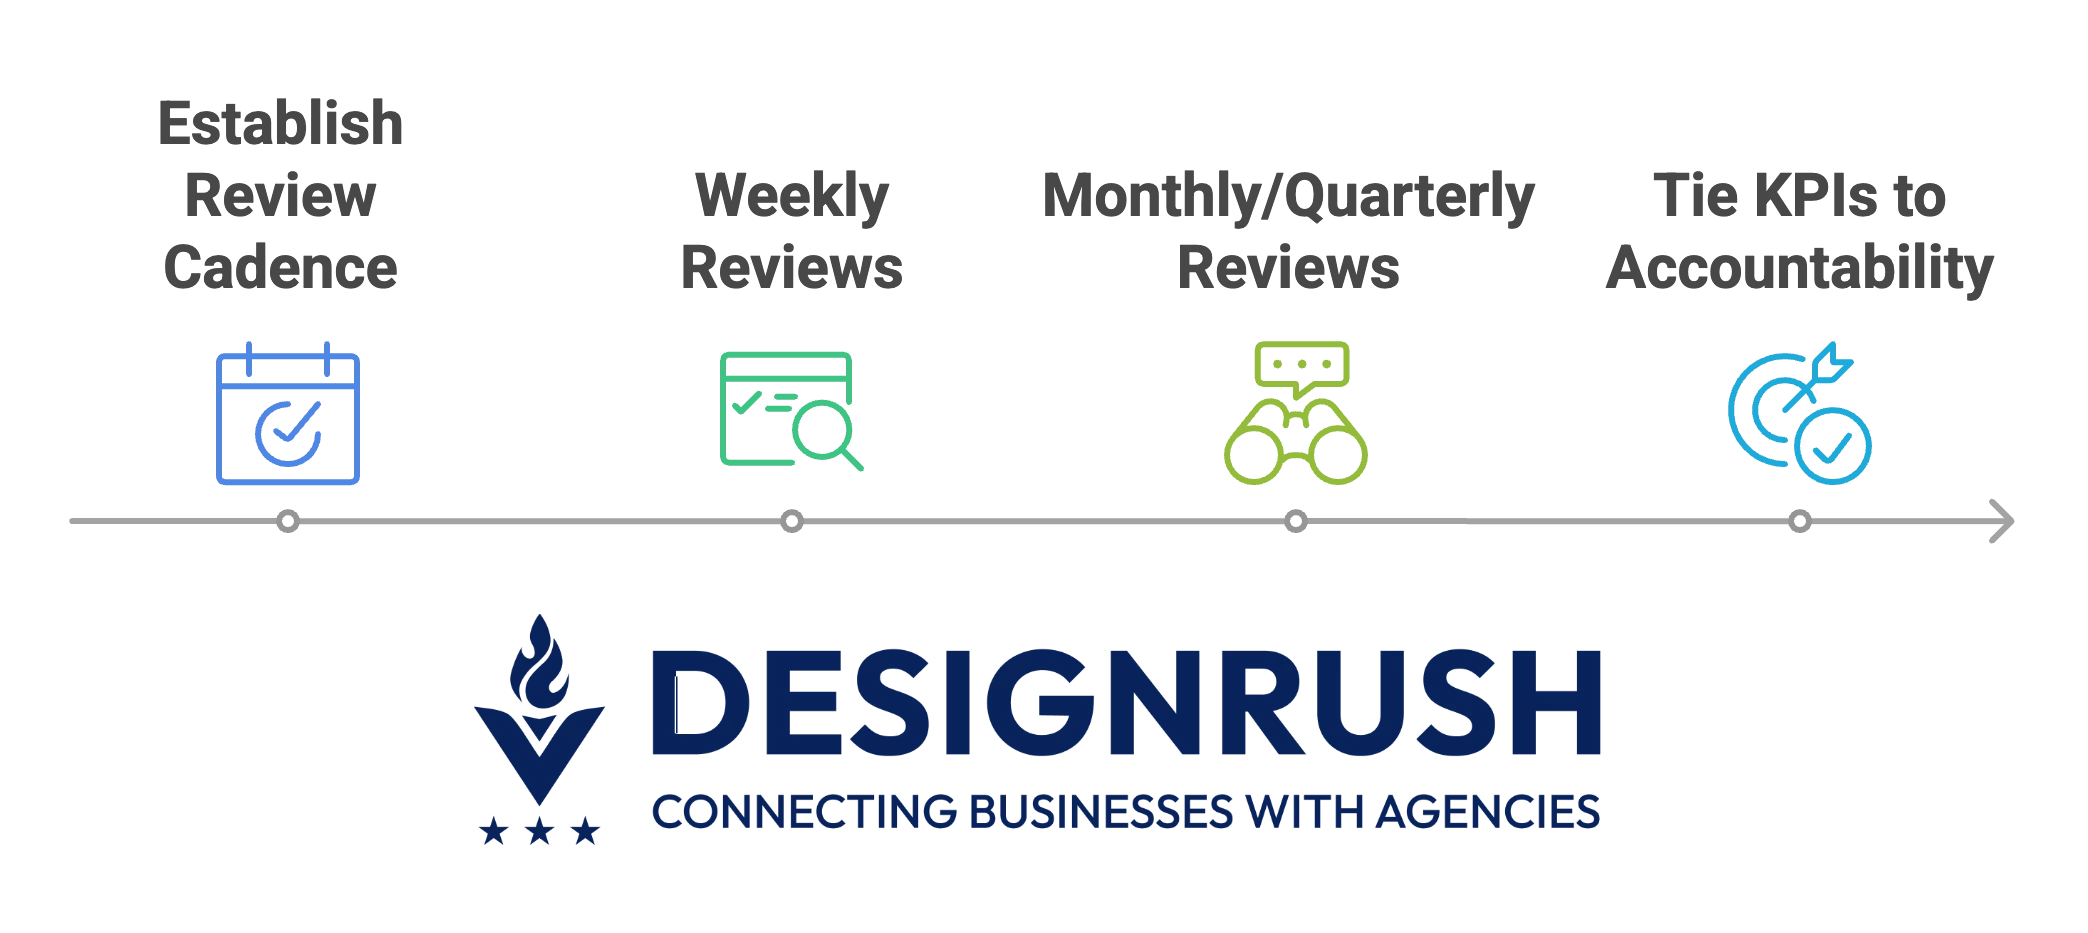
1. Weekly Reviews
Focus on tactical execution metrics. In a weekly team meeting, review items like project delivery status (on-time vs delayed), current spend vs budget, team capacity and workload, etc.
The goal is to catch short-term issues (e.g., a project at risk of delay or a spike in support tickets) and course-correct quickly.
2. Monthly or Quarterly Reviews
Step back for a strategic view. Review client retention and satisfaction, overall profit margins, sales pipeline health, marketing ROI, and progress toward quarterly OKRs.
This is where you identify bigger-picture trends and decide strategic adjustments (e.g., investing in new hires, changing service mix, revising pricing).
3. Tie KPIs to Accountability
Integrate KPI outcomes into performance plans and even incentive schemes. For instance, make improving client NPS or expanding project margins part of team OKRs.
When people know their metrics will be discussed regularly and linked to goals, they are more likely to take ownership.
Common KPI Pitfalls (and How To Fix Them)
Even well-intentioned KPI programs can go awry. Be on the lookout for these common pitfalls and address them head-on:
Pitfall | Description | Solution |
Tracking vanity metrics | Metrics that look good but don’t drive decisions (e.g., raw impressions, follower counts). | Replace with outcome-driven metrics like conversion rate or ROI. Ask: Does this metric drive action? |
Lagging-only indicators | Measuring only past results (e.g., revenue, profit) without forward-looking metrics. | Add leading indicators such as proposal velocity, pipeline value, and lead volume to guide proactive decisions. |
No KPI literacy among staff | Team members don’t understand KPIs or their impact. | Run KPI workshops, explain each metric, and give teams access to their own relevant data. |
Siloed data | Departments use separate metrics and tools, lacking a unified view. | Centralize data with an integrated dashboard and conduct cross-functional KPI reviews for alignment. |
If you’re only looking at end results, you’re reacting after the fact.
Make sure your KPI mix includes metrics that alert you to issues in advance (e.g., declining lead quality, slipping team utilization, rising customer complaints) so you can respond before it’s too late.
Agency Metrics & KPIs: Final Words
KPIs are about direction: measuring what matters and acting on it fast. Use them to guide your agency toward continuous improvement: flagging which clients need attention, which services are most profitable, and which internal processes are slowing you down.
The difference between a reactive agency and a proactive one often comes down to how you use your data. Make it count.
![]()
Our team ranks agencies worldwide to help you find a qualified partner to implement the latest AI solutions. Visit our Agency Directory for the Top Digital Marketing Agencies, as well as:
- Top Digital Advertising Agencies
- Top Digital Strategy Agencies
- Top Marketing Strategy Agencies
- Top Strategy Consultant Firms
- Top Market Research Companies
Agency Metrics & KPIs FAQs
1. What are the most critical KPIs for agency profitability?
While it can vary by agency type, a few metrics consistently top the list: client ROI, project gross margin, team utilization, and client retention. ROI and satisfaction show value delivery; margins reflect profitability; utilization tracks efficiency; and retention signals client health.
2. How often should we review agency KPIs?
Use a layered approach: weekly for tactical metrics (e.g., project status, spend pacing), and monthly or quarterly for strategic ones (e.g., client trends, revenue). Daily dashboards help catch red flags early. Frequent reviews keep teams focused; longer-term reviews support big-picture planning.
3. What’s the most overlooked KPI for agencies?
Proposal-to-Close Ratio. Many focus on delivery, but ignore how well they win new business. A low close rate (e.g., 20%) means wasted effort. Tracking this KPI helps refine sales strategy and boosts growth potential.
4. What’s the difference between a metric and a KPI?
Metrics measure activity; KPIs measure impact. For example, “blog posts published” is a metric, but “leads from content” is a KPI. KPIs are tied directly to business goals and guide decision-making. Focus on a few that truly reflect success.