Mobile is now the default way people connect, browse, and buy goods and services. When you understand how people use it, it’s easier to fine-tune your content, UX, and budget.
This report covers key mobile traffic statistics, the latest mobile usage data, and related trends. Use these benchmarks to support mobile-first strategies and align your decisions with current user behavior.
Mobile Traffic Statistics: Key Findings
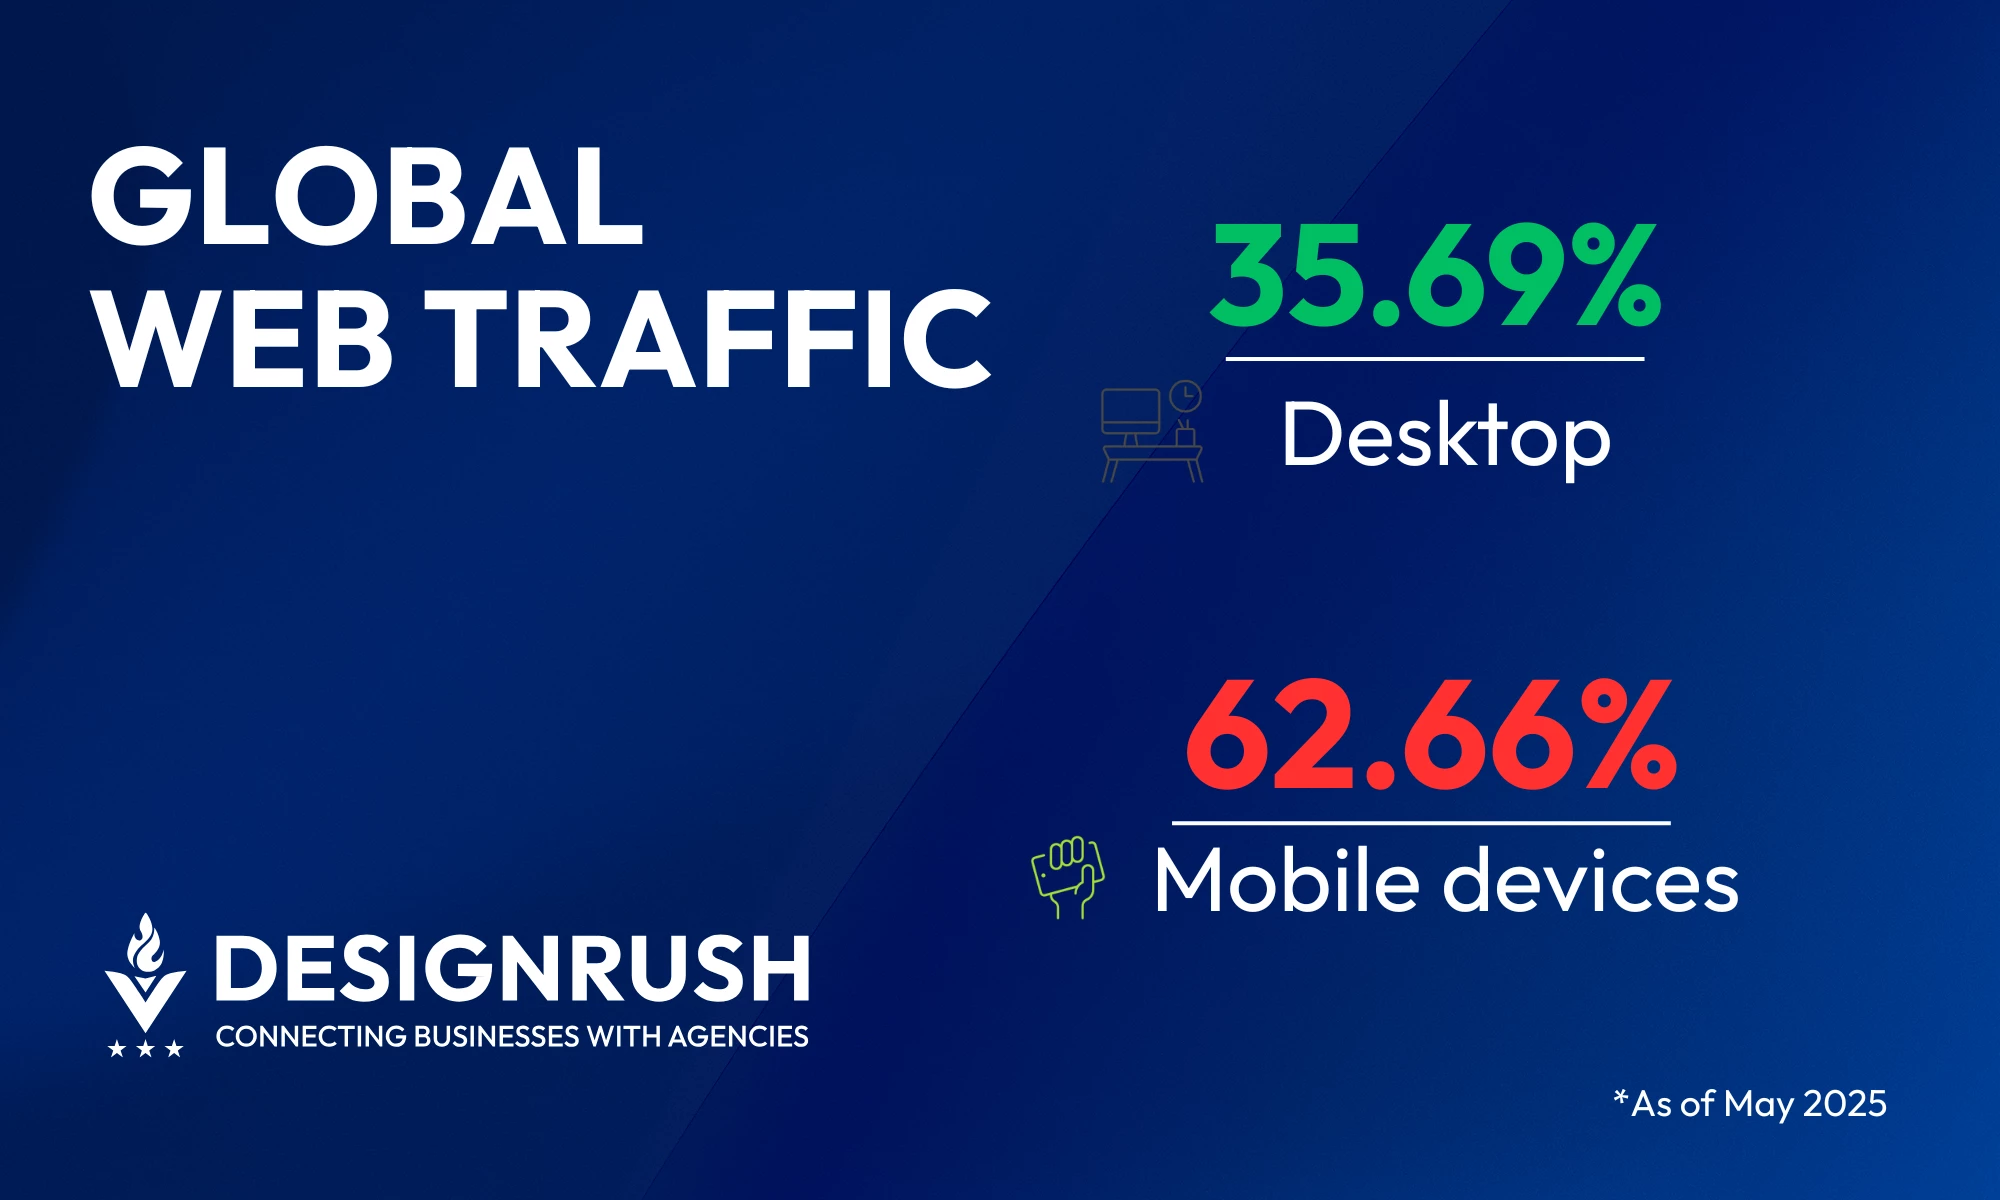
- Mobile phones now account for nearly two-thirds of all global web traffic (62.66%), far surpassing desktop (35.69%) and tablet (1.65%).
- Mobile drove 44.2% of all U.S. retail eCommerce sales in 2025.
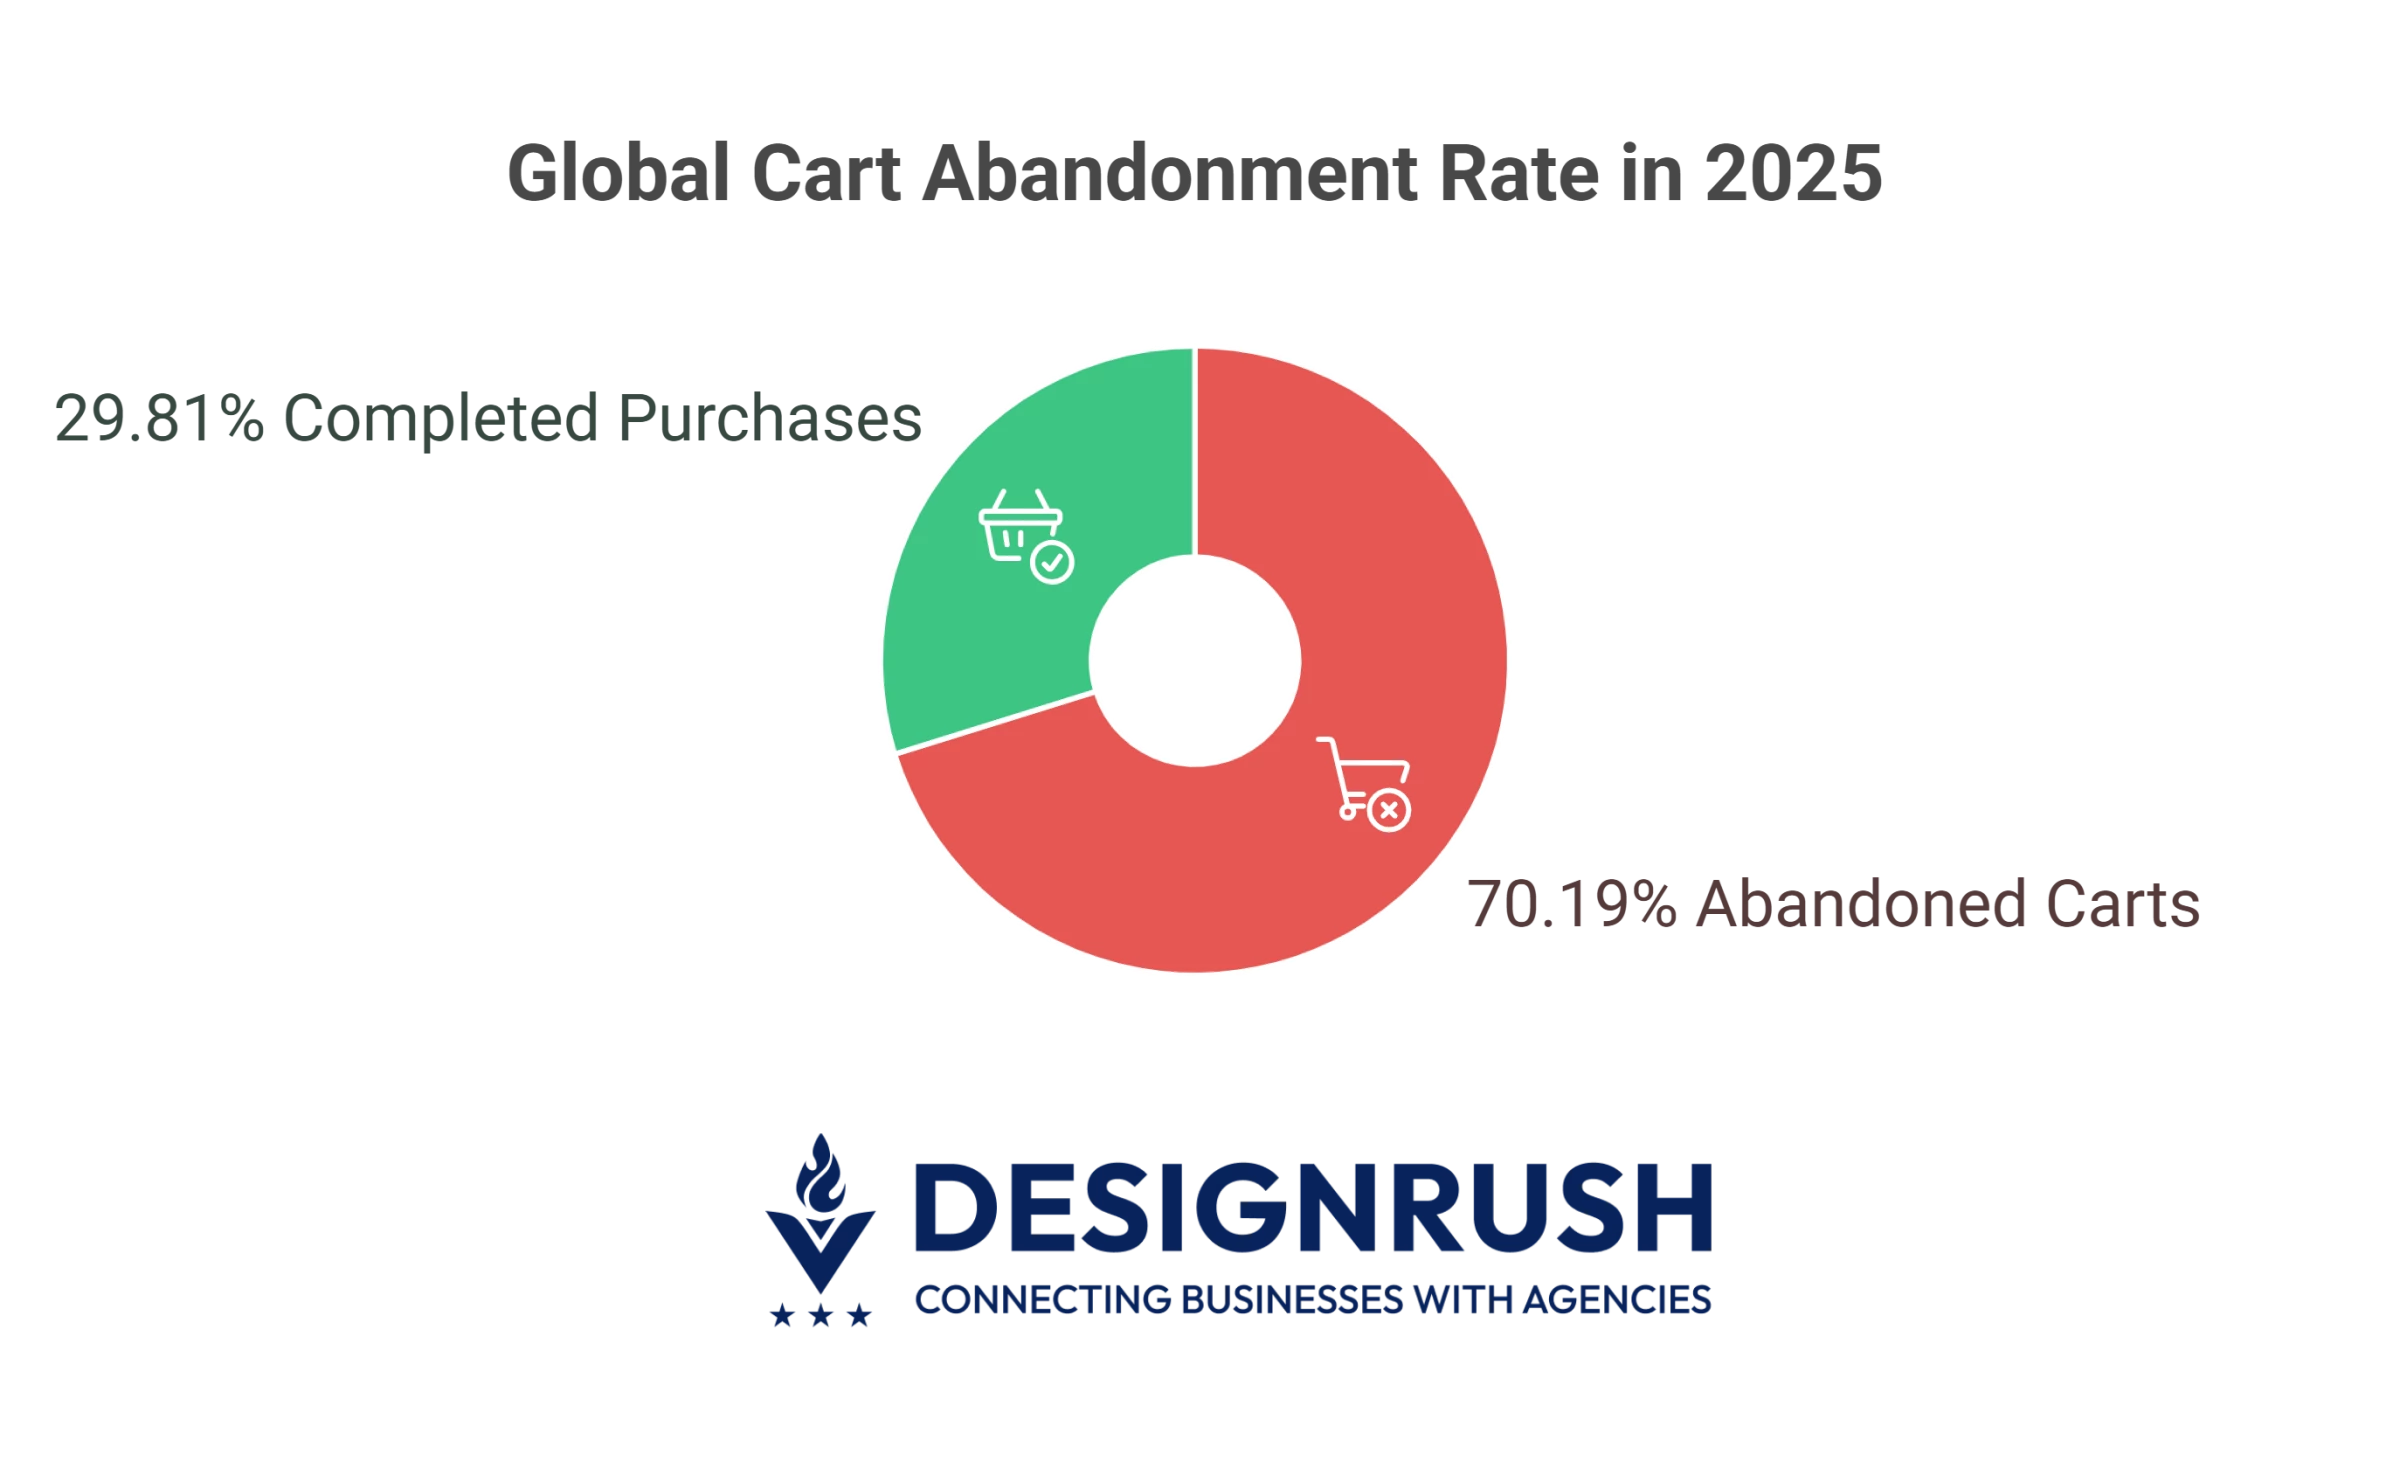
- The global cart abandonment rate stands at 70.19%, with abandonment reaching up to 98% in the travel sector.
Smartphone Growth and Reach in 2026
The rise of mobile traffic starts with one device: the smartphone.
As of 2025, a whopping 5.81 billion people, which is more than 70% of the global population, own a smartphone. This widespread access is what drives mobile-first behavior.
The more smartphones people use, the more web traffic comes from mobile. This means brands must design their sites and campaigns with phone users in mind.
What Percentage of Web Traffic Is Mobile?
Smartphone adoption sets the stage, but how does web traffic actually break down across devices?
Most users today access the internet through one of three channels: desktop computers, tablets, and mobile phones — and their traffic shares are far from equal.
Here’s how web usage is distributed across these platforms in 2026:
- Desktop still matters, but trails behind
- Tablet traffic continues to decline
- Mobile devices lead by a wide margin
1. Desktop Still Matters, But Trails Behind
@jasonhennesseyseo Why does Google care more about mobile than desktop? 📱It’s simple: More users are mobile-first. Make sure your website is ready, or risk losing rankings! 👉 Follow for tips to optimize your site and dominate Google. #MobileFirst#SEOstrategy#WebsiteOptimization♬ original sound - JasonHennessey
At its peak in early 2013, desktop browsing dominated with around 84% of global web traffic — a time when smartphones and tablets were still finding their footing.
The turning point came in 2016, when mobile and tablet usage combined reached 51.3%, overtaking desktop’s 48.7% share for the first time.
Since then, desktops have never reclaimed the majority.
As of May 2025, desktop accounts for just 35.69% of global web traffic. It’s still relevant, especially for enterprise workflows and long-form research, but no longer the default digital touchpoint it once was.
2. Tablet Traffic Continues to Decline
Like desktop, tablet usage has steadily shrunk over the past decade, both in market share and in user behavior trends. In 2013, tablet usage peaked.
Adobe Digital Index reported that 8% of global website visits came from tablets, while smartphones accounted for about 7%.
But more than a decade later, tablets have faded from digital dominance. By May 2025, that number has dropped to just 1.65%.
Larger smartphones and versatile laptops have rendered tablets largely redundant for most users.
While they still appear in specific environments like education, travel, or kiosk displays, they don't play a major role in driving web traffic.
Their role has shifted from primary browsing device to peripheral screen.
3. Mobile Devices Lead by a Wide Margin
Mobile phones dominated web traffic in 2025, reflecting the device’s central role in modern digital behavior.
Just how much of today’s web activity actually happens on mobile devices? It now accounts for 62.66% of all global web traffic — nearly two-thirds of all visits.
This dominance redefines priorities.
Every campaign, UX design, content strategy, and performance metric should assume a mobile-first audience. Ignore that and you risk losing the majority of users before they even engage.
What does this mean for businesses?
These numbers point to where your customers live digitally. Thus, your strategy should meet them there:
- Prioritize responsive, high-speed mobile experiences: With nearly two-thirds of traffic coming from phones, any friction on mobile — slow load times, clunky navigation, poor readability — hurts your bottom line.
- Design for the thumb: Prioritize tap-friendly layouts, streamlined navigation, and above-the-fold CTAs tailored for vertical scrolling.
- Test like your users behave: Run QA on real mobile devices, not just responsive views. Validate every stage — from discovery to conversion — on the screens where users actually live.
Mobile Browsing Behavior: Bounce Rate & Page Speed
Getting users to your site is just the beginning. What happens next is where the real business impact lies.
Mobile visitors behave differently from desktop users. They bounce faster, scroll less, and convert at lower rates, unless your experience is built for how they actually browse.
Here’s how mobile engagement compares, and what it means for your site’s performance:
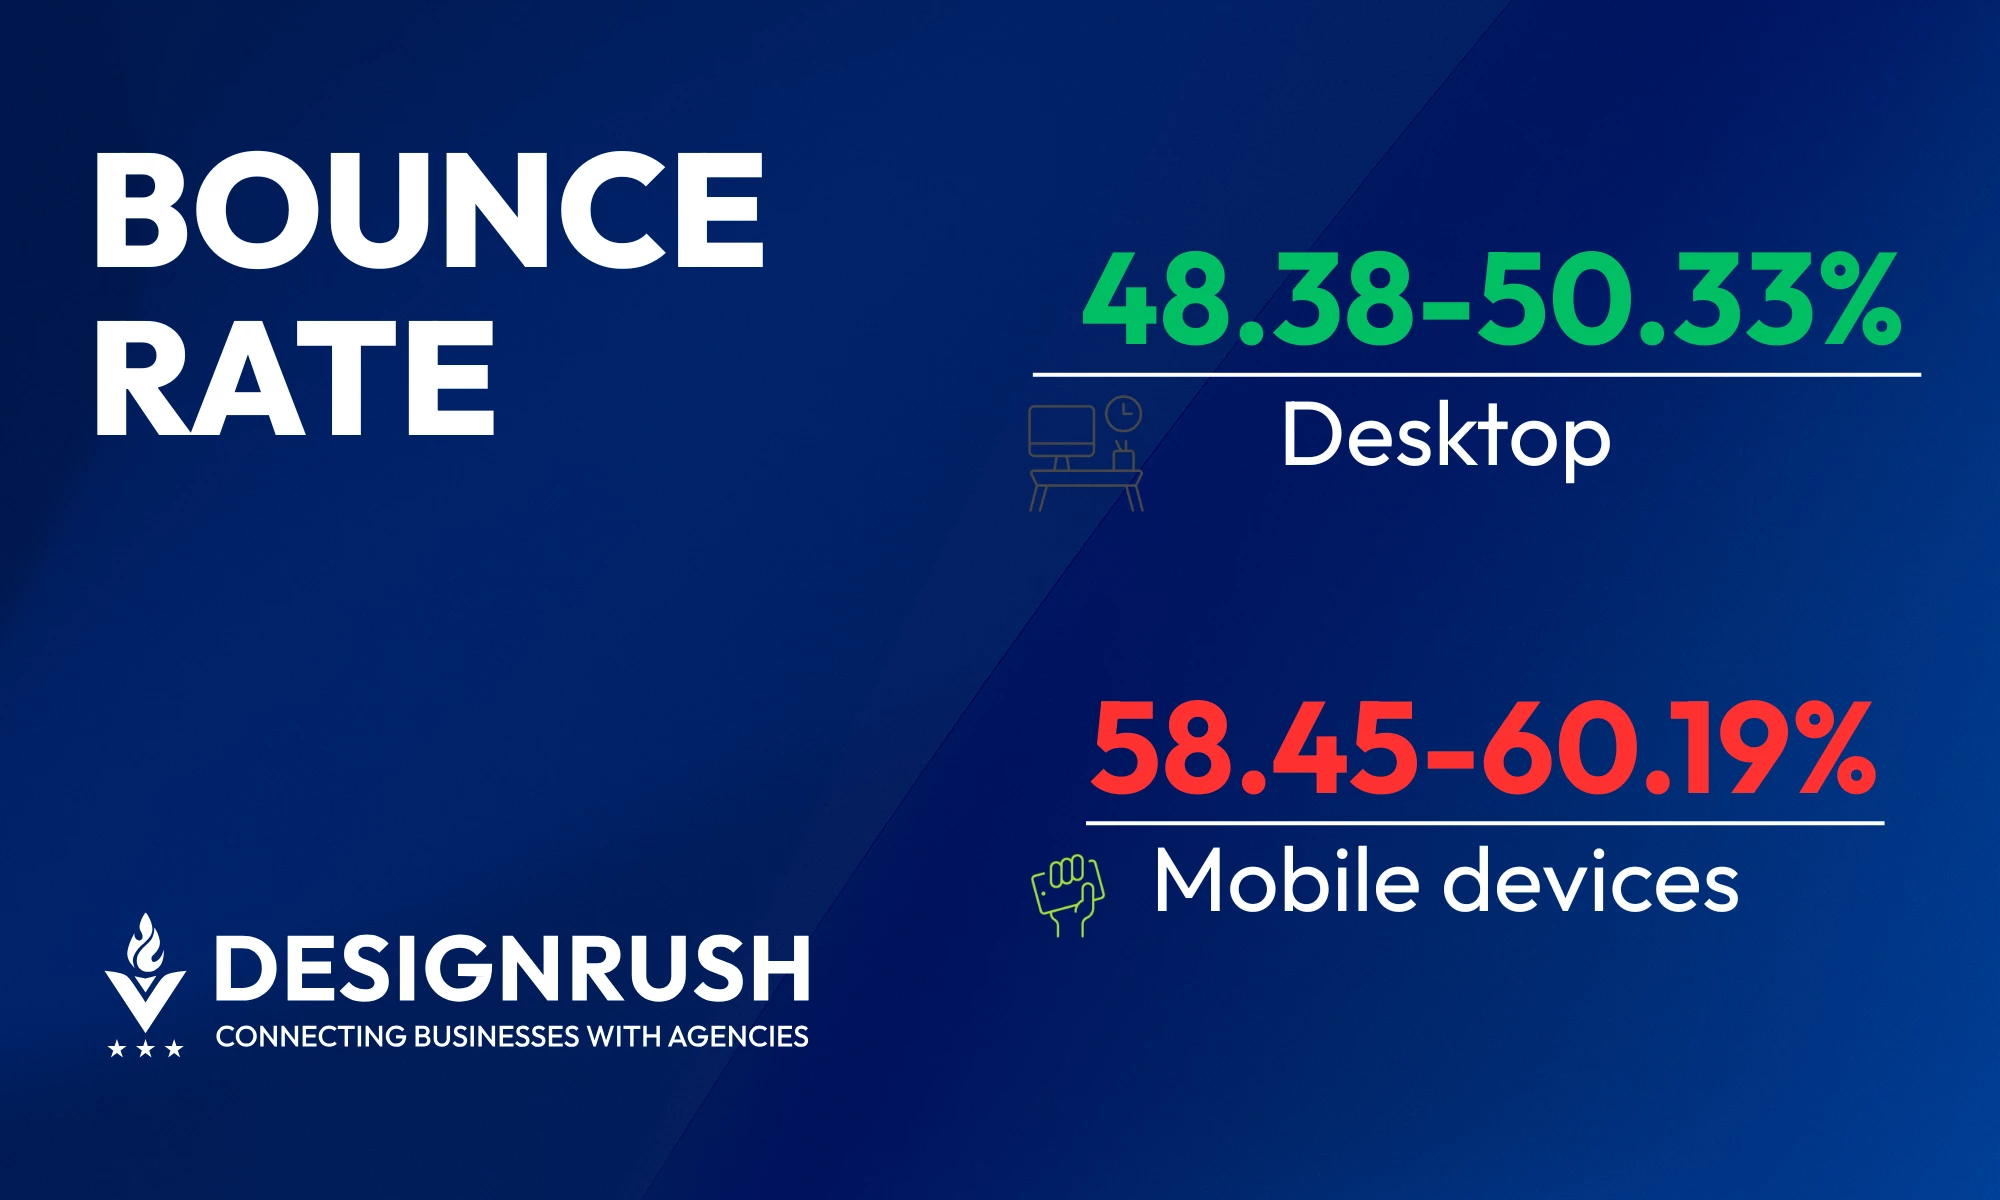
1. Mobile Users Bounce Faster and More Often
Mobile sessions are more fragile than desktop. Users leave sooner and scroll less, especially when the experience doesn’t meet their expectations.
Mobile bounce rates range between 58.45% and 60.19%, compared to 48.38% to 50.33% on desktop. That’s a consistent 8–12% point gap, which can translate into thousands of lost conversions for high-traffic sites.
Why does this happen? Page speed is a major culprit.
The average load time on desktop is around 2.5 seconds, while mobile averages 8.6 seconds — over three times slower. The longer a page takes to load, the more users bounce.
To reduce mobile bounce rates and keep users engaged:
- Optimize load times: Aim for 2.5 seconds or less. Compress assets, use modern formats, and streamline code.
- Simplify navigation: Make menus thumb-friendly and easy to scan on smaller screens.
- Prioritize content clarity: Ensure the most important info is immediately visible and skimmable.
- Test mobile-first: Regularly audit mobile performance and behavior using real-device testing.
- Eliminate friction: Avoid pop-ups, auto-play elements, and slow-loading third-party scripts that interrupt the user flow.
Slow Sites Kill Mobile Conversions
@bhirst_media Website Speed: Why Your Slow Site Kills Conversions Slow websites frustrate visitors and Google. We discuss how speed impacts user experience, SEO, and conversions, urging you to prioritize website optimization for success. #WebsiteSpeed#PageSpeedOptimization#SEO#ConversionRateOptimization#WebPerformance#GoogleRanking#UserExperience#WebsiteTips#DigitalMarketing#SpeedMatters♬ original sound - Brandon Hirst
Mobile users aren’t just more likely to bounce; they’re also less likely to convert when page speed lags.
Portent’s research shows just how costly delays can be for lead-generation websites:
A mobile site that loads in a second converts 3x more than one that loads in 5 seconds
That same one-second site converts 5x more than a site that takes 10 seconds to load
These gaps highlight how sensitive mobile conversion rates are to performance, especially in B2B environments.
To keep conversion rates healthy on mobile:
- Target fast-first design: Build mobile pages to load in under 3 seconds — not just look good.
- Streamline lead generation flows: Cut steps, reduce form fields, and use autofill where possible.
- Audit conversion drop-offs: Use tools like heatmaps or session recordings to find UX bottlenecks.
- Minimize dependencies: Third-party scripts, slow APIs, and bloated frameworks can stall conversion-critical moments.
When speed is strategy, every millisecond saved boosts your chances of turning a visitor into a lead.
Mobile Browsing Behavior: Engagement Trends
Traffic and conversions matter, but so does what users do between the first click and the final action.
Understanding how mobile users interact with content is key to optimizing scroll depth, attention span, and sustained engagement. Distractions, screen size, and session context all shape their journey.
- Mobile distractions hurt engagement
- Younger users spend more time on mobile
- Mobile shopping is on the rise
1. Mobile Distractions Hurt Engagement
Mobile users are constantly dealing with distractions. Notifications, messages, and app alerts make staying focused a real challenge.
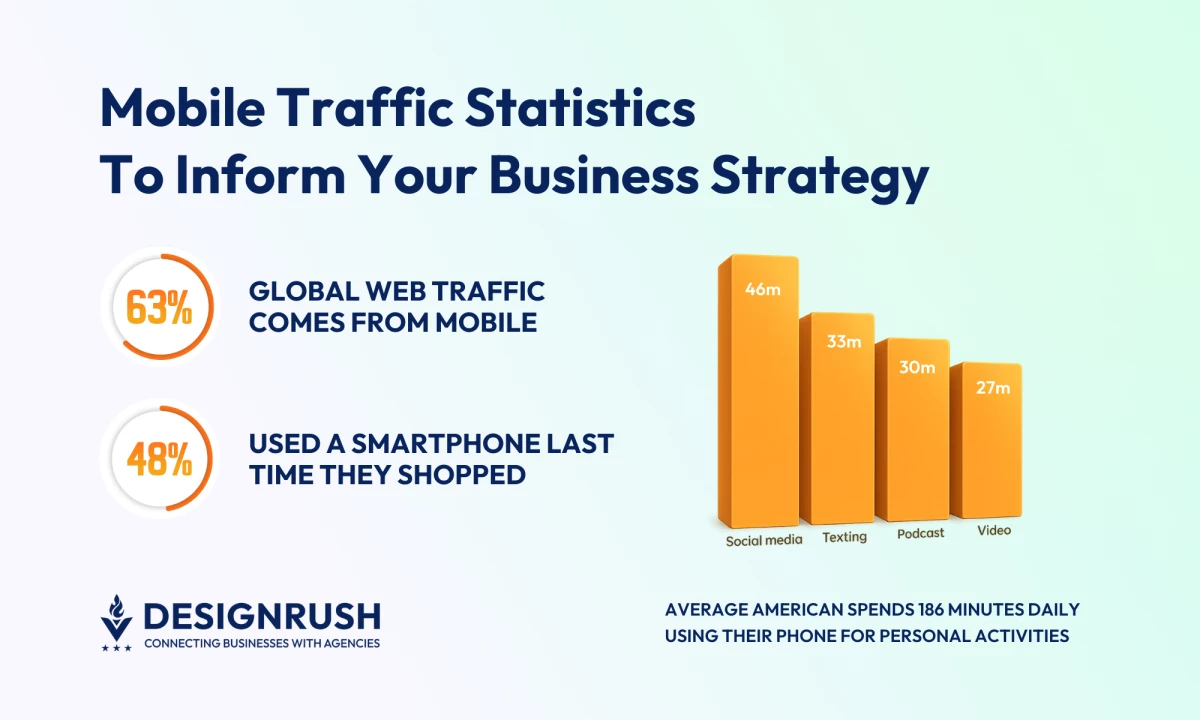
A March 2025 RSS.com survey found that the average American spends 186 minutes per workday using their phone for personal activities. That’s about 3 hours and 6 minutes.
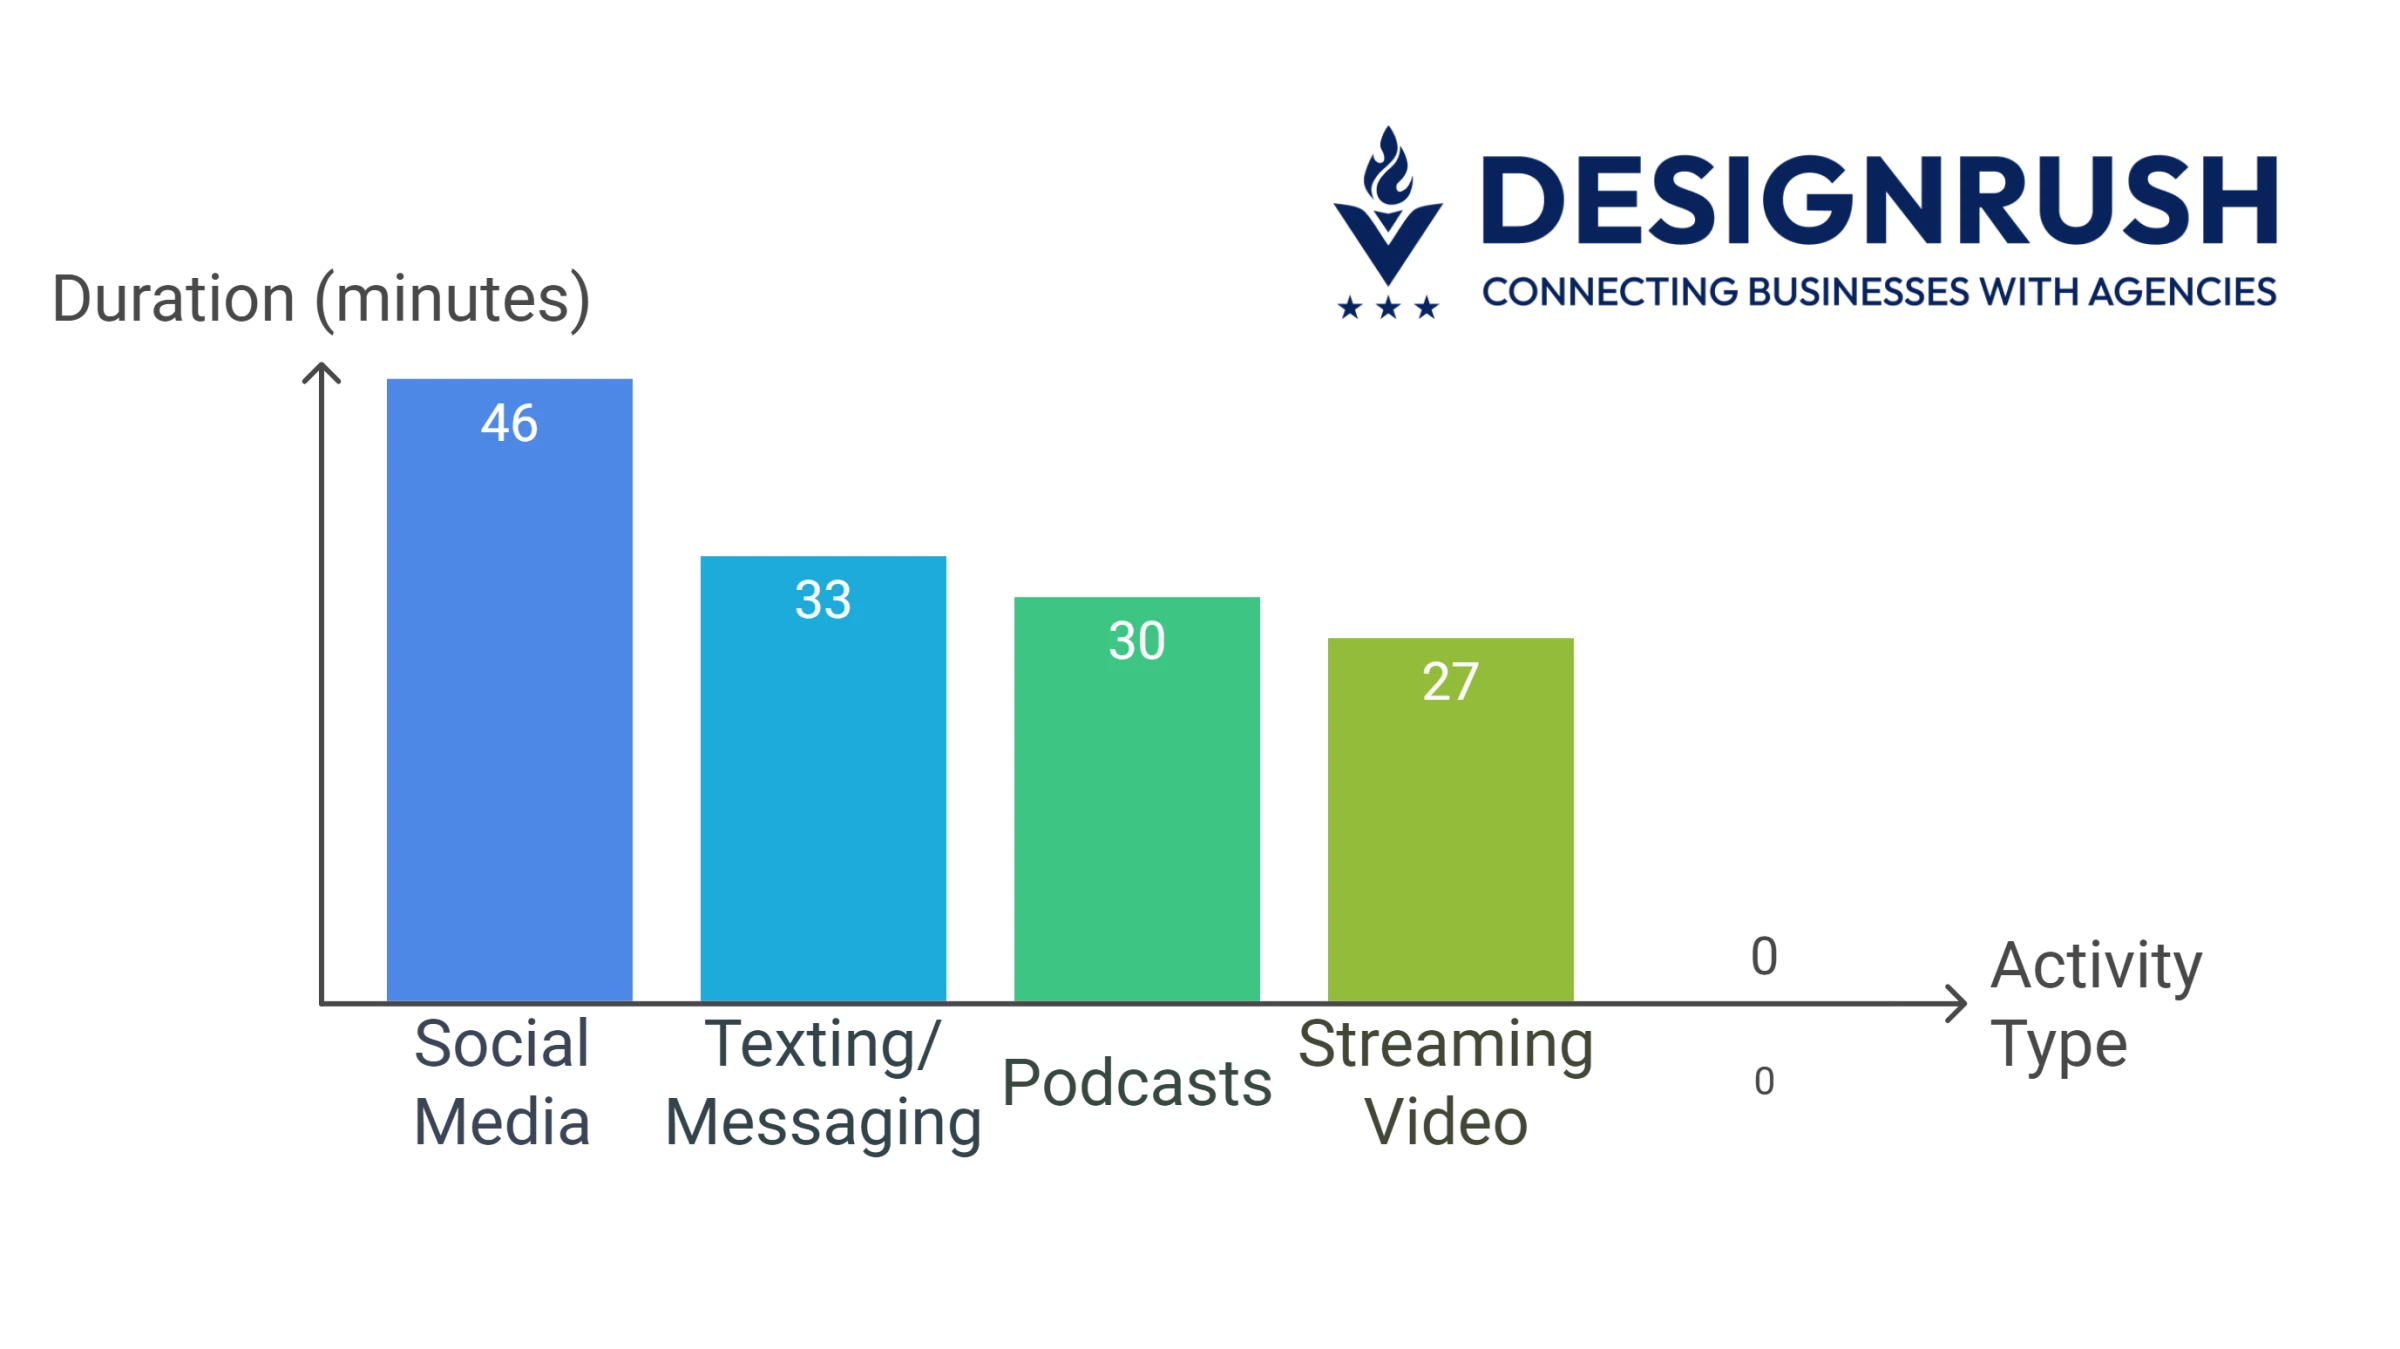
Of that time, usage breaks down as:
- 46 minutes on social media
- 33 minutes texting or messaging
- 30 minutes listening to podcasts
- 27 minutes streaming video
What does this mean for mobile UX?
- You have a narrow window to capture attention. Distractions are always one swipe away.
- Mobile design must prioritize immediacy: fast load, key info above the fold, frictionless interaction.
- Expect fragmented sessions. Many users browse in bursts between tasks or interruptions.
The context of mobile usage is chaotic. Optimize accordingly — or risk being the tab they never return to.
2. Younger Users Spend More Time on Mobile
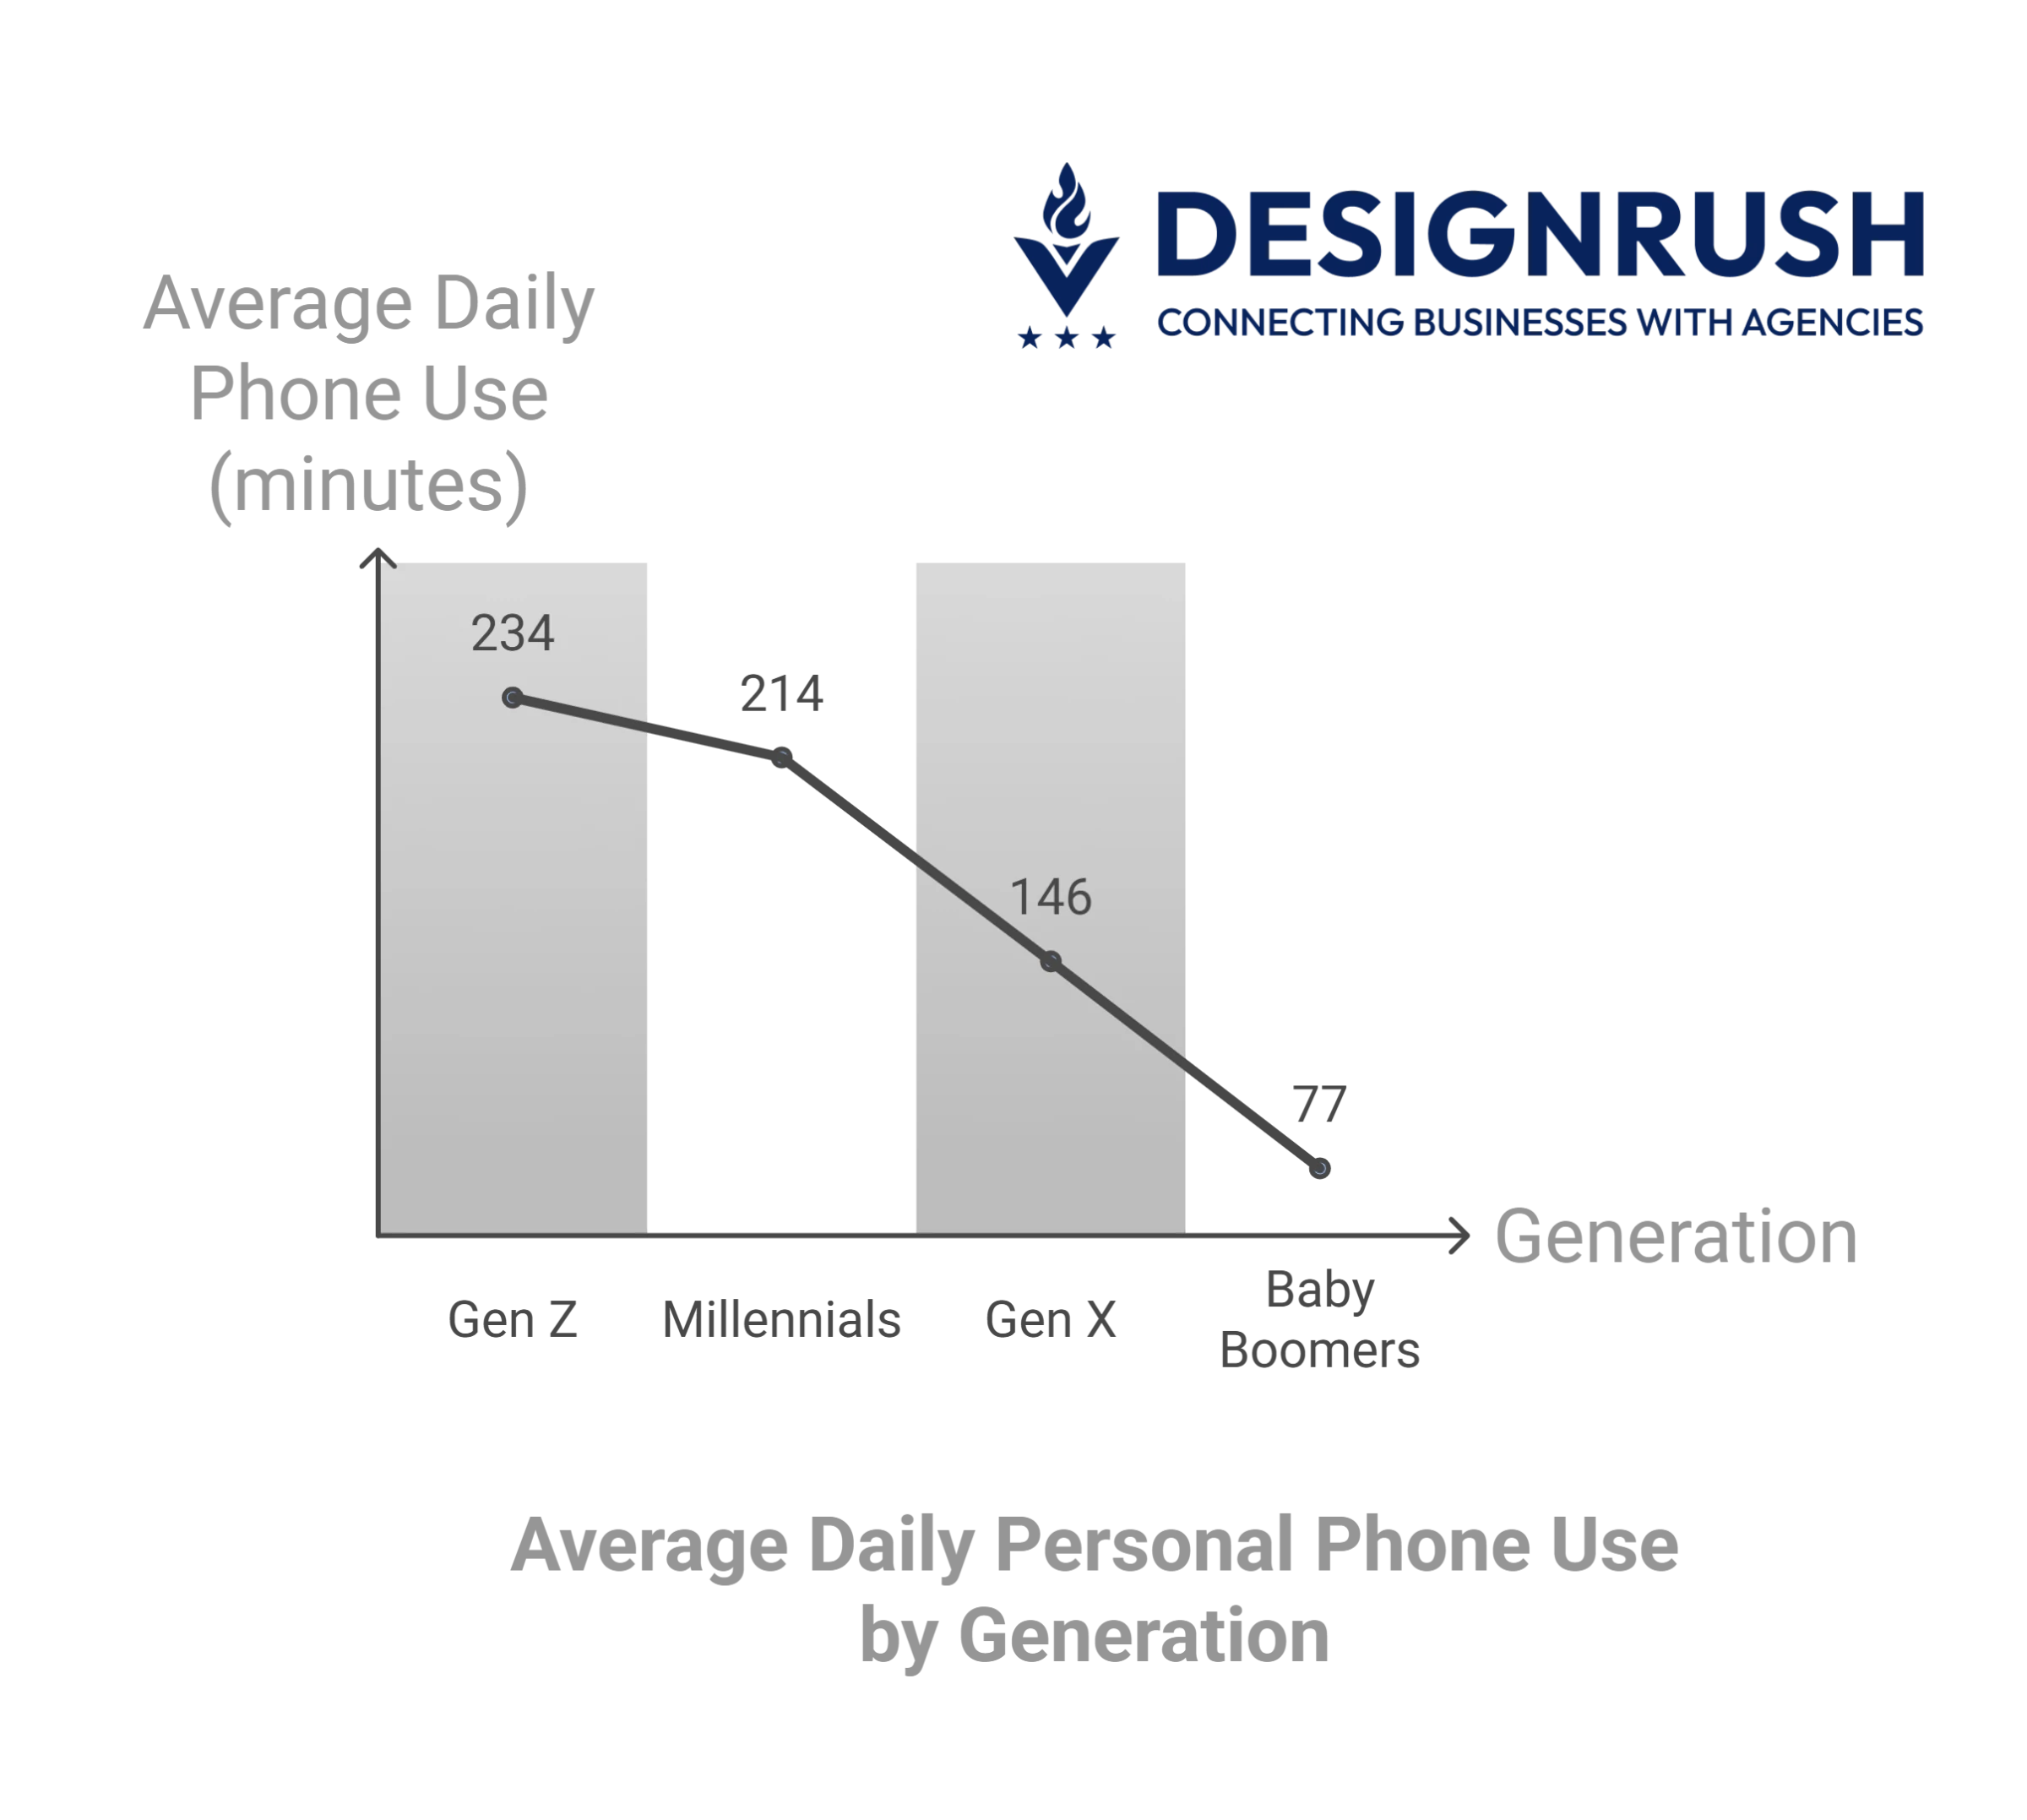
Gen Z is the most mobile-tethered generation in today’s workforce. According to RSS.com’s 2025 findings, they spend an average of 234 minutes per workday on personal phone use.
Here’s how that compares:
- +20 minutes more than millennials
- +88 minutes more than Gen X
- +157 minutes more than baby boomers
What does this mean for user experience?
- Prioritize clarity: Gen Z scrolls fast. Deliver value early or risk losing them.
- Design for task completion: They expect speed and ease, not clutter or complexity.
- Be respectful of attention: Avoid interruptions that feel invasive or tone-deaf.
3. Mobile Shopping Is on the Rise
Smartphones aren’t just for browsing anymore. They’re becoming a core retail channel.
In 2025, mobiles drove 10.4% of all US retail sales, which includes both in-store and online purchases. That’s a significant slice of the full retail pie, showing how smartphones are influencing even traditional buying behavior.
But within online shopping, the role of mobile is even bigger.
For businesses, this means:
- Targeted UX strategy: If you’re in a vertical like fashion or electronics, mobile-first optimization is essential. For grocery or complex purchases, seamless mobile checkout matters more than ever.
- Streamline mobile paths: Use autofill, one-tap payments, and fast-loading pages to prevent abandonment.
- Monitor mobile adoption: Track your device-based trends; a vertical neutral today could tip heavily mobile tomorrow.
Mobile Purchasing Behavior Trends
If mobile traffic shows where users are browsing, purchasing behavior reveals how far they’re willing to go.
Smartphones have become both discovery tools and purchase portals. Understanding consumer behavior on mobile is essential to unlocking revenue.
Take a look at these:
- Mobile transactions are projected to account for 44.2% of all US retail eCommerce sales, totaling around $728 billion.
That means nearly half of all online retail purchases will happen through smartphones, not desktops or tablets. - 48% of US consumers use a smartphone in their most recent retail interaction, whether browsing, comparing, or buying.
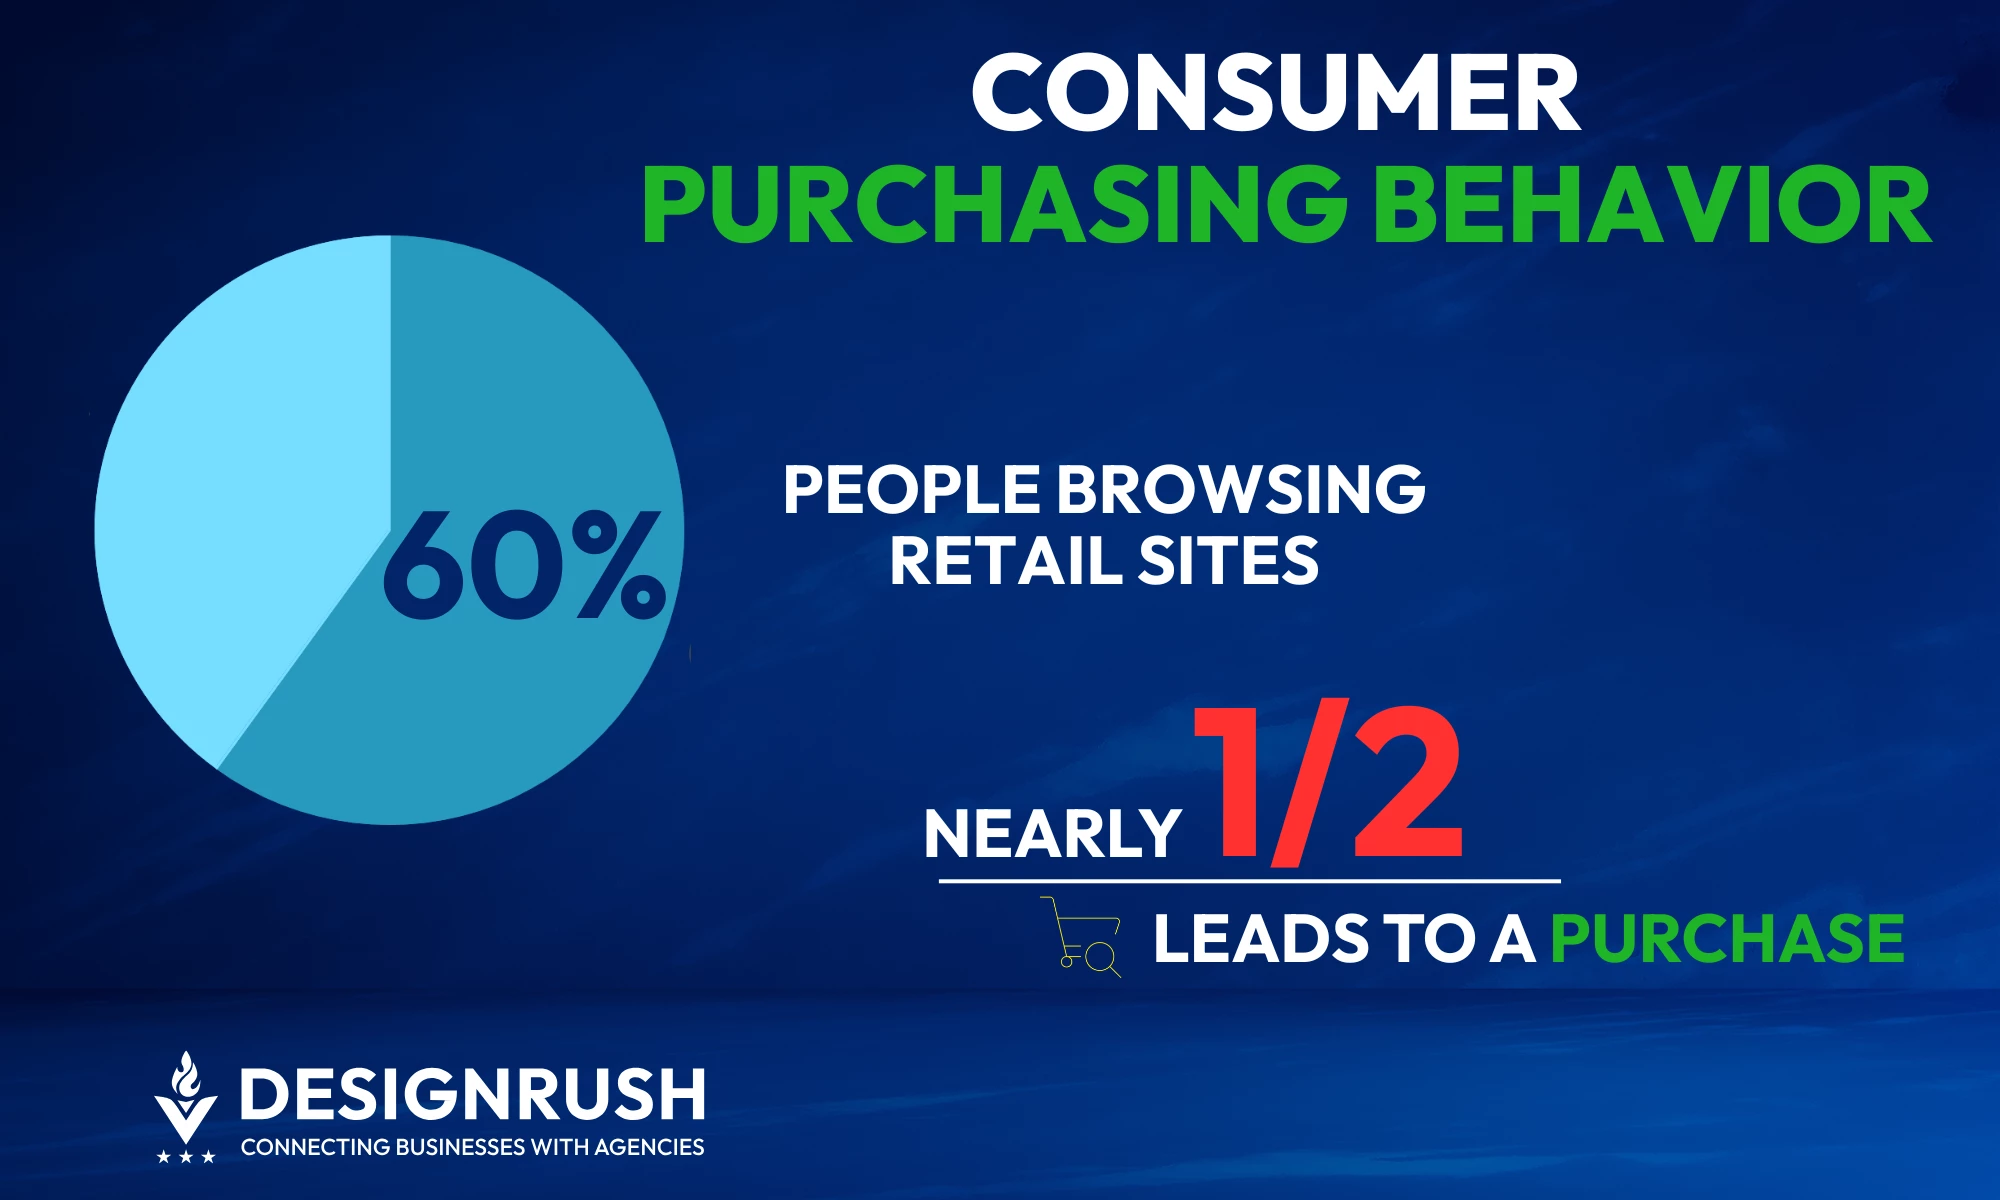
- 60% of consumers browse retail sites on their phones multiple times a week, and nearly half of those browsing sessions lead to a purchase.
US consumers use their phones to browse merchant sites and conduct product research 12.4 days per month, compared to fewer sessions on desktop.
They also use mobile devices 7.3 days a month for delivery purchases and 4.7 days for pickup.
Younger users dominate mobile shopping behavior, with Gen Z and millennials making at least two digital shopping activities a day.
To tap into the mobile-first market:
- Streamline your checkout flows: Remove friction wherever possible. Use mobile wallets, autofill, and progress indicators to make conversion seamless.
- Support discovery and decision-making: Prioritize fast-loading product pages, mobile-friendly filters, and accessible reviews.
- Build for return behavior: Use retargeting, saved preferences, and personalized offers to re-engage mobile users who browse in bursts.
Mobile Conversion Friction: Drop-Offs and Abandonment
Not all mobile visits translate into sales.
Cart and checkout abandonment run high on mobile, often triggered by interruptions, slow loading, and clunky UX. Even small points of friction can push users to exit before completing a transaction.
Here’s what the numbers show:
- According to Statista, the global cart abandonment rate stands at 70.19% as of 2025, from 69.99% in 2022.
- PYMNTS’ 2025 Global Digital Shopping Index revealed that 56% of shoppers prefer merchants with fast payment options, especially those using stored credentials and biometric authentication.
- Only 20.6% of consumers manually enter payment details. The rest opt for faster alternatives like autofill or stored credentials. This shows how frictionless payments can make or break conversions.
- Cart abandonment varies by sector. According to Statista and SaleCycle, cruise and ferry tops the list (98%), followed by mobile providers (90.76%), and airlines (90%).
These figures highlight where sales are slipping away. The only way to fix it is to understand where users leave and why they hesitate.
Here’s how to act on the data:
- Use funnel analytics: Map the exact drop-off points in your mobile checkout flow — from cart review to payment confirmation.
- Segment by behavior: Identify whether abandonment comes from hesitant first-timers, repeat browsers, or price-sensitive users.
- Tailor flows by industry: High-abandonment verticals like travel, luxury, and telecom need UX specifically designed for urgency, complexity, or price sensitivity.
- Personalize recovery efforts: Trigger reminders, pre-filled carts, or incentives tailored to each user segment and their stage in the funnel.
- Test relentlessly: Run A/B tests on mobile-specific elements like CTA placement, input formats, and microcopy clarity — the small things make a big impact on conversion.
Emerging Technologies Shaping Mobile Traffic in 2026
New tools are changing how people browse on mobile. Faster networks, smarter browsers, and app-like sites are raising expectations and reshaping user behavior.
These shifts are already influencing how mobile traffic flows — and how businesses need to respond.
- More than 2 billion 5G connections are expected in 2026, with adoption expanding rapidly worldwide.
- According to Adobe, progressive web apps (PWAs) can deliver up to 36% uplift in mobile conversions.
- Opera Mini, used by 100M+ globally, now integrates AI to assist mobile browsing and reduce search friction
To stay ahead, businesses should:
- Evaluate whether your mobile experience is 5G-ready — faster networks support richer content and heavier features.
- Consider offering a PWA if your audience needs fast, installable, app-like access without downloads.
- Keep your content structured and mobile-friendly so AI-powered browsers can find and display it accurately.
- Monitor how mobile browsing behavior shifts with these tools and adjust SEO, UX, and performance strategies accordingly.
Mobile Traffic Statistics: Final Notes
Most digital journeys start on a phone, and many end there too. With mobile traffic making up the majority of site visits in 2026, the stakes are higher than ever.
If mobile growth is outpacing your site’s performance, it’s time to recalibrate.
A specialized SEO agency can help you spot where traffic drops off, optimize what users actually see, and build a faster, smarter mobile path to conversion.

Our team ranks agencies worldwide to help you find a qualified partner. Visit our Agency Directory for the top SEO agencies, as well as:
- Top SEO Agencies in Baltimore
- Top Event Marketing Agencies
- Top Branding Companies
- Top Reputation Management Companies
- Top Content Marketing Agencies
Mobile Web Traffic: FAQs
1. How can businesses optimize for mobile-first users?
Start by checking your site on mobile. Fix speed issues, simplify menus, and make sure your content fits smaller screens.
Don't forget to streamline checkout, reduce form fields, and offer mobile-friendly payment options like Apple Pay or Google Pay.
2. What tools help track mobile traffic?
Use Google Analytics 4 (GA4) to see how much of your traffic comes from mobile.
Tools like Hotjar or FullStory show what users do on your site through heatmaps and recordings. Google’s PageSpeed Insights can help you fix mobile speed issues.
3. Which industries gain the most from mobile-first strategies?
Retail, food delivery, healthcare, travel, and media see the biggest gains. But any business with customers on the go can benefit, especially if they browse, compare, or buy from their phones.