Digital marketing costs depend entirely on what a company is trying to achieve. Surface-level averages rarely tell the full story because budgets shift based on competition, growth expectations, funnel efficiency, and operational structure.
Using DesignRush Agency Directory data, in this breakdown I’ll show you what companies actually spend, why costs vary, and how to structure a budget that supports profitable growth.
Digital Marketing Cost: Key Findings
- Most focused digital marketing projects average around $5,000, while enterprise programs raise overall averages to $67,700, with monthly spend ranging from under $1,000 to $80,000+.
- Companies allocate an average of 7.7% of revenue to marketing, but high-growth companies in the $10-25M range invest over 21% to accelerate expansion.
- Digital marketing cost is driven less by channels and more by growth expectations, competition intensity, and funnel efficiency.
The Real Cost of Digital Marketing Is Not What Most Companies Think
I see most businesses anchor on surface numbers, average monthly retainers, percentage-of-revenue benchmarks, or what a competitor claims to spend.
In real life, digital marketing cost is determined by growth expectations, competition intensity, operational efficiency, and how well the funnel converts.
Two companies in the same industry can spend radically different amounts and see completely different returns.
Understanding the real cost means looking beyond line items and examining what it actually takes to generate profitable, repeatable growth, and that’s exactly what I unpack in this piece using real benchmarks, real allocation data, and practical budget logic.
How Much Does Digital Marketing Cost?
Digital marketing costs depend on a lot of things. For instance, a focused SEO or PPC program costs significantly less than a multi-channel strategy with ongoing testing, creative production, and analytics.
Below are benchmark costs based on DesignRush Agency Directory portfolio data divided by service, industry, and business size to help you estimate realistic investment levels.
- Average digital marketing cost
- Digital marketing cost by service
- Digital marketing cost by industry
- Digital marketing cost by company size
Average Digital Marketing Cost
View this post on Instagram
Based on what I analyzed, digital marketing costs scale with scope, channels, and business size. Most brands run focused programs, not full-scale campaigns, which keeps many budgets on the lower end.
- Typical project cost: ~$5,000
- Overall average (including enterprise): ~$67,700
- Typical monthly spend: ~$833
- Advanced, multi-channel programs: Up to five figures per month
Digital Marketing Cost by Service
When I break the data down by service, the pricing is fairly consistent:
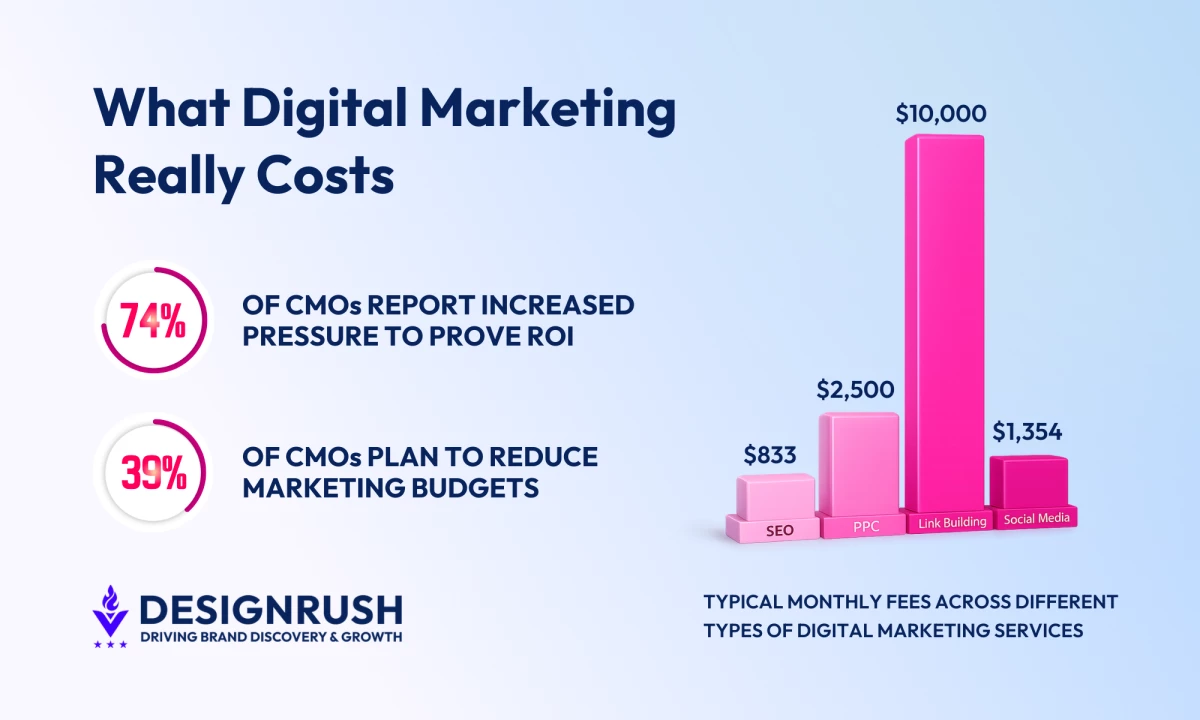
- SEO work usually comes in at around $2,500 per project or $833 per month for ongoing optimization.
- PPC requires more hands-on management, which pushes costs higher, typically $12,500 per project or $2,500 per month, not including ad spend.
- Google Ads management is often more tightly scoped, averaging $2,500 per project or about $365 per month.
- Link building sits at the top of the pricing range, with projects averaging around $60,000 or $10,000 per month, driven by outreach volume and authority targets.
- Social media marketing typically lands at $2,500 per project or $1,354 per month, while full marketing strategy work averages $36,250 per project or $6,563 per month.
Digital Marketing Cost by Industry
Industry also influences pricing, mostly because of complexity and sales cycles.
- Ecommerce and retail projects average around $12,500.
- B2B and industrial brands tend to invest more, closer to $36,250, because leads take longer to convert.
- SaaS and technology projects often sit lower, around $2,500, especially when campaigns are narrowly focused.
- Healthcare projects also average around $2,500, usually due to tighter scopes.
- Education brands typically invest more, averaging around $36,250, driven by enrollment goals and multi-channel campaigns.
Digital Marketing Cost by Company Size
When I group spend by company size, the pattern is extremely consistent:
- Micro and local businesses typically invest about $417 per month. Small businesses average around $2,083 per month.
- Mid-market companies move into the $10,000 per month range, while upper mid-market brands sit closer to $14,583 per month.
- Once you reach the enterprise level, monthly spend jumps sharply to $80,000 or more. At that point, budgets reflect constant optimization, multiple agencies or teams, and always-on performance tracking.
What Is the Average Digital Marketing Budget?
@jonloomer What's a good Cost Per Lead? You won't be surprised that it depends on a lot of factors, but the main thing is understanding a few things: How much is a lead worth to you? How often do leads buy from you? At this point, you'll be able to start figuring out a baseline for what should be acceptable for a cost per lead based on value. #facebookads#facebookadstips♬ original sound - Jon Loomer
My piece of advice is that when working with budget data, you should never look at the percentage in isolation. The number only matters in context.
In 2025, the average marketing budget sat at 7.7% of company revenue, but very few companies actually budget “the average.”
What I see instead is intentional over-investment at certain stages and tighter control at others.
Marketing Budget as a Percentage of Revenue
Companies under pressure to grow allocate a higher share of revenue to marketing. Once growth becomes incremental rather than foundational, that percentage drops.
See it in Deloitte’s research numbers first-hand:
- Under $10M in revenue: 17.01%
- $10-25M: 21.47%
- $26-99M: 8.26%
- $100-499M: 8.52%
- $500-999M: 7.27%
- $1-9.9B: 7.19%
- $10B+: 4.94%
The spike at $10-25M is not accidental whatsoever. This is the stage where companies fund acquisition aggressively to break into the next revenue tier.
Above that, budgets are set with a focus on return.
Marketing Budget by Company Size and Employee Count
Employee count gives a clearer picture of how marketing supports operations.
Here’s what Deloitte says on marketing budget by employee count:
- Under 50 employees: 19.16%
- 50-99: 7.47%
- 100-499: 12.79%
- 500-999: 4.90%
- 1,000-2,499: 8.55%
- 2,500-4,999: 5.67%
- 5,000-9,999: 4.06%
- 10,000+: 6.04%
Smaller teams allocate more because marketing carries acquisition, brand, and demand generation at the same time.
As headcount increases, those responsibilities split across sales, partnerships, and internal teams, which pulls the percentage down even when total spend rises.
The value here is knowing where you sit on the curve and budgeting deliberately for that stage, not against a global average that was never meant to apply to you.
What Drives Digital Marketing Costs Up or Down?
Beyond the obvious line items, there are a few factors that consistently move digital marketing costs up or down.
These are the ones I see influencing budgets most often.
- Market competition and rising ad auction costs
- Growth targets and speed-to-scale expectations
- Agency structure and scope efficiency
- Media mix complexity and channel consolidation
- Team structure and labor efficiency
- Marketing technology stack and software overload
Market Competition and Rising Ad Auction Costs
View this post on Instagram
In highly competitive industries such as legal services, insurance, financial services, SaaS, eCommerce, healthcare, and home services, multiple brands target the same high-intent keywords and audiences.
Because ad platforms operate on auction systems, this concentration of demand pushes bids higher and increases customer acquisition costs.
Maintaining the same level of visibility therefore requires larger budgets, stronger creative, and more rigorous testing.
As competition intensifies, profitability depends less on visibility alone and more on funnel efficiency. If conversion rates are weak or the customer journey has friction, rising media costs reduce profitability much faster.
Strong fundamentals in landing pages, messaging, and offer structure help protect margins when auction prices climb.
Growth Targets and Speed-to-Scale Expectations
When leadership sets aggressive growth targets or expects rapid results, execution costs increase because speed limits the ability to optimize gradually.
Short launch timelines, quarterly revenue pressure, or investor expectations often require running multiple tests at the same time instead of phasing them. That means higher upfront media spend, more creative variations, and additional production resources to gather data quickly.
This disconnect between goals and budget is common. As Chantelle King, Co-Founder of Reckless Projects, explains:
“Many businesses that reach out to us have little to no experience in marketing and often expect minimal costs without a clear understanding of ad expenses. This leads to unrealistic expectations regarding the budget and time frame for achieving their goals.”
To manage this efficiently, expectations and budget must align:
- If rapid growth is required, allocate sufficient budget for parallel testing and creative production from the start.
- If budget is constrained, extend timelines so campaigns can optimize sequentially rather than all at once.
Agency Structure and Scope Efficiency
According to Gartner’s latest CMO spend research, 39% of CMOs plan to reduce agency budgets.
A primary driver behind this shift is structural inefficiency rather than pure cost cutting. When multiple agencies handle overlapping responsibilities, complexity increases and expenses accumulate in ways that are not always visible at first glance.
The most common actions CMOs take:
- Eliminating underperforming agency relationships
- Simplifying agency rosters
- Renegotiating contracts and scope
Consolidating agencies and defining clear ownership across channels often reduces total spend while maintaining or even improving output.
Clear scopes of work, unified reporting frameworks, and accountability at the channel or outcome level help control costs without sacrificing performance.
Media Mix Complexity and Channel Consolidation
Gartner reports that 18% of CMOs are reducing media budgets, primarily by simplifying channel mix.
What I know is that performance often suffers when budgets are spread too thin across too many platforms. Each additional channel requires planning, creative adaptation, reporting, optimization time, and platform expertise.
When investment is fragmented, none of the channels receive enough budget to generate meaningful data or stable returns.
Cost control in this case typically starts with consolidation:
- High-performing channels should receive priority funding, while underperforming or marginal platforms are paused or removed.
- Media planning processes should become standardized, so budget allocation follows clear performance criteria rather than experimentation without structure.
- Before expanding into new platforms, you should increase output and optimization depth within existing high-yield channels.
Team Structure and Labor Efficiency
Another 39% of CMOs are addressing labor costs, but this does not automatically mean layoffs. In many cases, it means cleaning up inefficiencies inside the team.
Companies often discover that different people are doing similar work, or that the same task is being repeated across departments.
For example, paid media, content, and analytics teams may each build their own reports, plan campaigns separately, or work toward slightly different goals. That lack of alignment increases cost because time is wasted and decisions take longer.
Simplifying roles, clarifying ownership, and centralizing key functions such as strategy and reporting reduce friction.
When everyone works from the same goals and data, output improves and unnecessary effort is removed without cutting performance.
Marketing Technology Stack and Software Overload
12% of CMOs are actively cutting marketing technology budgets.
Over time, many teams add new tools without fully using the ones they already have. As the stack grows, subscription costs increase and day-to-day work becomes more complicated.
Common cost-saving moves include relying more on existing platforms, removing tools that are rarely used, and consolidating software that performs similar functions.
When multiple tools overlap, teams waste time switching between systems, reconciling data, and maintaining integrations.
A simplified martech stack lowers subscription expenses and improves speed. If a team spends more time managing dashboards and integrations than acting on insights, technology is adding overhead instead of improving performance.
How Companies Allocate Digital Marketing Budgets
Understanding the percentage of revenue allocated to marketing is only half the equation. The second half is understanding how that budget is distributed across digital channels.
Coming from Gartner’s CMO Spend report we can see that paid media continues to dominate digital investment:
- Search advertising: 13.9%
- Digital display advertising: 12.5%
- Social advertising: 12.2%
- Video and streaming: 10.7%
- Audio and podcast: 7.5%
- Retail media networks: 6.4%
- Digital OOH: 5.4%
Search remains the largest single allocation, reflecting continued emphasis on high-intent capture.
Display and social follow closely, supporting both performance and mid-funnel demand creation.
Video and streaming’s double-digit allocation signals the shift toward attention-based formats rather than pure click capture.
Retail media’s 6.4% share highlights how platforms like Amazon and large marketplaces are absorbing more performance budgets. Meanwhile, digital OOH is re-emerging as brands pursue blended online-offline visibility.
On the owned and earned side, investment is more concentrated but strategically important:
- SEO: 8.9%
- Email marketing: 7.4%
- Influencer marketing: 5.9%
- Sponsored content: 5.5%
- SMS/Push: 3.5%
SEO continues to anchor long-term organic visibility. Email’s steady allocation reflects its proven revenue efficiency.
Influencer and sponsored content investments show brands blending performance with trust-based amplification.
SMS and push remain smaller line items, but often punch above their weight in retention programs.
How To Plan Your Digital Marketing Budget Strategically
When I plan a digital marketing budget, I start with revenue math and decision rules, because costs move fast and “we’ll see” gets expensive.
- Step 1: Start with revenue targets and acceptable acquisition cost
- Step 2: Build the funnel backward to determine lead volume and spend
- Step 3: Fund outcomes first then match channels to the job
- Step 4: Balance proven channels with structured testing
- Step 5: Set clear evaluation timelines before launch
- Step 6: Build in reset triggers and reforecast points
- Step 7: Match marketing ambition to sales and delivery capacity
Step 1: Start With Revenue Targets and Acceptable Acquisition Cost
Before assigning dollars to media, define what marketing is responsible for delivering.
Your budget should answer one question:
How much revenue do we need marketing to generate, and what can we afford to pay to acquire it?
For example, if a customer generates $6,000 annually at an 80% margin, that’s $4,800 in gross profit. If leadership expects payback within six months, acquisition cost cannot exceed roughly $2,400. That ceiling becomes your guardrail. Every channel, campaign, and test must operate within it.
Step 2: Build the Funnel Backward to Determine Lead Volume and Spend
Once CAC is defined, work backward through conversion rates.
If only 5% of leads convert to customers and the company needs 30 new customers next quarter, marketing must produce 600 leads. If the maximum viable cost per lead is $120, the required working media budget becomes $72,000.
This approach replaces arbitrary budgeting with derived budgeting, which means that the spend is justified by math, not optimism.
Step 3: Fund Outcomes First Then Match Channels to the Job
Rising auction pressure has pushed CPCs up approximately 20% year over year in several categories, while 74% of executives report increased pressure to prove ROI. That combination demands disciplined allocation.
Demand capture channels like search and retargeting typically command the largest share because they convert existing intent. Demand creation channels build future pipeline and require patience.
Lifecycle marketing often delivers disproportionate returns: Email averages roughly $36 in revenue for every $1 spent, yet it is frequently underfunded.
Conversion rate optimization (CRO) deserves deliberate investment as well. Companies that push incremental sales through targeted promotions can see a 1-2% lift in sales and a 1-3% improvement in margins making CRO one of the highest leverage investments in the mix.
A strong budget funds the entire growth system: acquisition, conversion, retention, creative, and measurement.
Step 4: Balance Proven Channels With Structured Testing
View this post on Instagram
A common budgeting mistake I see often is either overcommitting to experiments or avoiding them entirely. Many teams apply a 70/20/10 model to maintain balance:
- 70% toward proven drivers
- 20% toward iterative improvements
- 10% toward controlled experimentation
This balance matters, as proved by numbers. Marketing budgets allocated to new product launches increased from 5.9% to 8.1% in 2025, signaling that structured innovation is rising.
Companies that do not reserve room for testing risk stagnation.
Step 5: Set Clear Evaluation Timelines Before Launch
Different tactics mature at different speeds. Paid search often shows performance signals within one to two weeks. Paid social prospecting requires several weeks to stabilize. SEO and content strategies sometimes take three to six months before compounding effects appear.
Defining evaluation windows in advance prevents premature cuts or prolonged underperformance.
Step 6: Build in Reset Triggers and Reforecast Points
A digital marketing budget should not be static, as markets move, competitors increase pressure, algorithms shift, and conversion rates fluctuate. If your budget only works under ideal conditions, it is fragile.
Instead of reacting emotionally to performance swings, define reset triggers in advance.
Decide what level of cost increase, conversion drop, or pipeline shortfall requires budget redistribution. Determine how long a campaign must run before it is judged fairly. Establish what qualifies as a scale signal versus a pause signal.
As Vladislav Podolyako, Founder and CEO of Folderly, notes,
“Avoid wasted spend on ineffective campaigns and reduce the need for extensive troubleshooting. Sustainable practices contribute to ongoing success and scalability, and clear metrics and reporting demonstrate the value and ROI of the services.”
This structure prevents two common failures: cutting campaigns just as they stabilize or continuing to fund channels that are quietly eroding profitability.
Step 7: Match Marketing Ambition to Sales and Delivery Capacity
A budget can look strong on paper and still fail in execution if the business cannot absorb the growth it creates.
Before finalizing allocations, validate downstream capacity:
- Can sales respond to increased lead flow without response time slipping?
- Is onboarding equipped to handle volume without churn rising?
- Are inventory, fulfillment, or support teams prepared for expansion?
Marketing efficiency is measured by how smoothly those leads convert into retained, profitable customers. When marketing scales faster than operations, acquisition costs rise indirectly through lost opportunities and damaged customer experience.
![]()
Our team ranks agencies worldwide to help you find a qualified partner. Visit our Agency Directory to find top-rated digital marketing companies, as well as:
- Content Marketing Agencies
- Conversion Rate Optimization Services
- Media Buying Agencies
- Affiliate Marketing Companies
- Direct Marketing Companies
Digital Marketing Cost FAQs
1. How much should a small business spend on digital marketing?
Most small businesses allocate between a few hundred to a few thousand dollars per month, depending on revenue, competition, and growth goals. Companies in active growth phases often invest a higher percentage of revenue to accelerate acquisition.
2. Is digital marketing cost based on a percentage of revenue?
Many companies benchmark marketing spend as a percentage of revenue, with averages around 7-8%. However, high-growth companies often invest significantly more, especially when entering new markets or scaling aggressively.
3. Why do digital marketing costs vary so widely between companies?
Costs differ based on industry competition, target audience size, sales cycle length, growth expectations, and funnel efficiency. Two companies in the same industry may spend very different amounts depending on their conversion rates and expansion goals.
4. Does digital marketing cost include ad spend?
Not always. Agency or management fees are often separate from media spend. Businesses should clarify whether pricing includes strategy and execution only or also covers advertising budgets.
5. How can I reduce digital marketing costs without hurting performance?
Improving conversion rates, consolidating underperforming channels, simplifying agency structures, and eliminating unused tools often reduce cost more effectively than cutting media budgets alone.